Market Data

July 16, 2021
Service Center Shipments and Inventories Report for June
Written by Estelle Tran
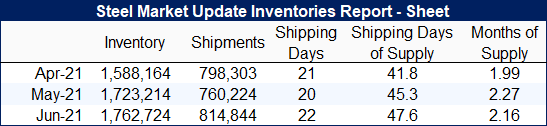
Flat Rolled = 47.6 Shipping Days of Supply
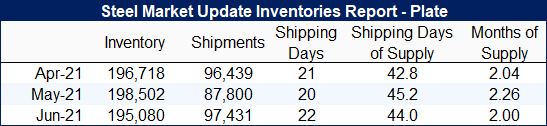
Plate = 44 Shipping Days of Supply
Flat Rolled
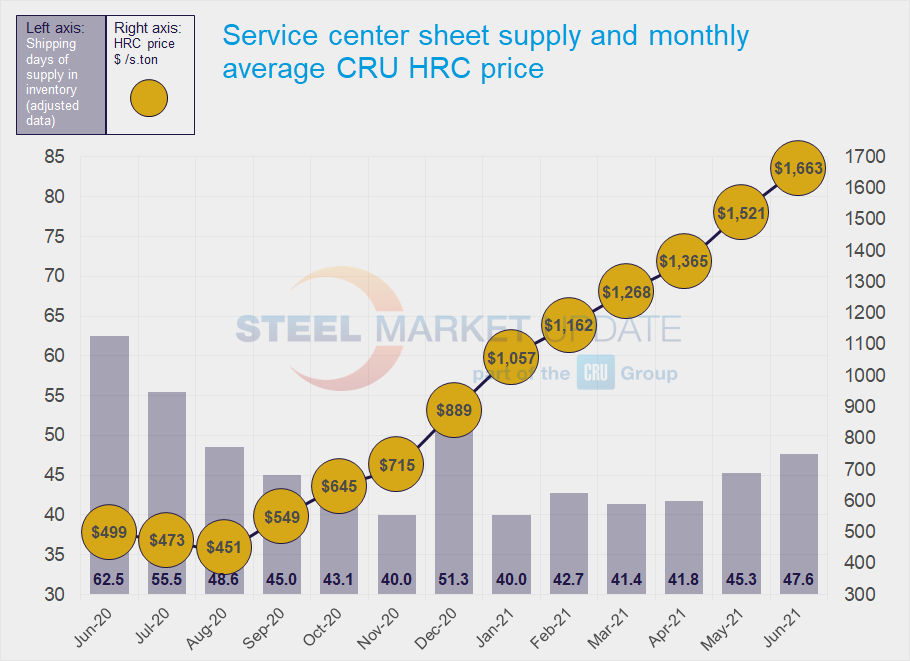
U.S. service center flat rolled inventories increased again in June, though service centers continue to report that they are unable to meet customer demand. At the end of June, service centers carried 47.6 shipping days of supply, up from the final adjusted May level of 45.3. Because June had 22 shipping days and May had 20, the amount of supply in terms of months on hand is distorted – 2.16 for June on a preliminary basis versus 2.27 in May.
From the data, it seems inventories have risen from their low point in relation to outbound shipments. Lower than expected mill operating rates caused by production issues and weather disruptions held service center shipments back slightly in June.
There was a point in June when mills had more spot availability, and service centers started to report more resistance from manufacturers regarding price, as supply had been able to catch up in recent weeks. SMU’s lead time survey over the last several weeks showed signs that mills were able to catch up on orders with fluctuations in the HRC lead times around the 10-week mark. Recent news about SDI’s unplanned outage at Columbus and Cleveland-Cliffs scheduling a maintenance outage at Indiana Harbor #7 in September empowered mills to pull back on offers and try for higher prices.
On-order flat rolled volumes peaked in April and edged further down in June. If the material on order continues to slide, we would expect mill lead times to continue to shorten. Inventories are in better balance but still lean; this has supported continued price increases. We expect intake to pick up slightly in July and August, as imports arrive and domestic production hits the highest level seen since the start of the pandemic.
As prices continue to rise, we continue to see an increase in the percentage of inventory committed to contracts. Service centers have been trying to limit purchases of material that is not pre-sold. As a result, the percentage of flat rolled inventory committed to contract has risen to 61.9% in June, up from 59.5% in May and 50.7% in June 2020.
Plate
Service center plate inventories decreased in June, as service centers’ shipping rates outpaced inbound supply. At the end of June, service centers carried 44 shipping days of supply, down from 45.2 in May. Service centers had 2.0 months of plate supply at the end of June, compared with 2.26 in May.
Service centers reported strong shipments, as customers continued to request material beyond their forecasted amounts. Shipments increased 11% month on month, consistent with the increase in shipping days, however, contacts also noted that business was very strong. There have been reports of service centers having to decline to quote on jobs because they did not have the material to price. Reduced mill allocation has caused further tightness in the U.S. plate market. Meanwhile, demand has been strong across a range of sectors, including construction, mining, yellow goods and energy.
The volume of plate inventory on order increased and so did the percentage of inventory on order.
Mill lead times for plate have been longer than nine weeks for the last few months. The picture is mixed as multiple contacts have reported extremely limited spot availability from certain mills while on-order data has increased. The extended lead times and strong demand should indicate further pricing strength moving through Q3.