Market Data

May 17, 2021
Service Center Shipments and Inventories Report for April
Written by Estelle Tran
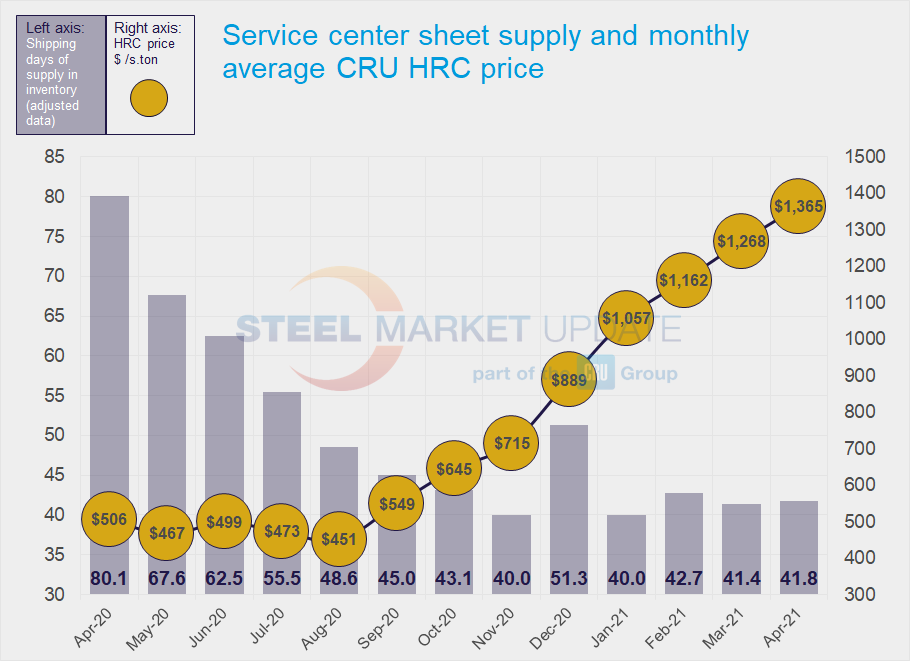
Flat Rolled = 41.8 Shipping Days of Supply
Plate = 42.8 Shipping Days of Supply
Flat Rolled
U.S. service center flat rolled inventories remain low, though steel mills are starting to catch up on delayed orders. Service centers carried 41.8 shipping days of supply at the end of April, flat compared to March’s adjusted inventory of 41.4 days of supply. April inventories represented 1.99 months of supply, up from 1.8 in March.
Shipments fell 10% month on month, a trend that resulted mostly from April having two fewer shipping days than March and also from a dip in auto-related shipments. The daily shipping rate for April was flat month on month.
The amount of supply on order increased again in April, and the volume of material on order in April may be the peak.
Flat rolled inventories are still very lean with inter-trade among service centers remaining common. Service centers customers still have low inventories but are nonetheless uncomfortable with rapidly rising steel prices. Multiple contacts have said they are not able to supply all their regular customers and have had to turn down business from less frequent customers.
As prices reach new highs, service centers have increased the amount of inventory tied to contracts, Service center flat rolled inventories tied to contracts have been about 60% for the last three months, up from 54.5% in April 2020.
Mills continue to run behind on orders, though some service centers have noted that mill shipments are slowly catching up. Mill lead times recorded by SMU reached new highs – 10.81 weeks for HRC, 12.25 weeks for CRC and 12.71 weeks for HDG – according to the latest survey.
We expect inventories to grow from here as intake increases. While inventories remain lean for now, there is likely double ordering taking place downstream. As imports arrive, we expect inventories could be balanced at the time of the June or July survey.


Plate
Service center plate inventories remained flat in April with 42.8 shipping days of supply. In March, service centers carried 43 shipping days of supply. Months of supply rose to 2.04 months in April from 1.87 months in March.
Shipments fell about 10% month on month because of the difference in shipping days. Market contacts reported that demand for plate remained steady but that there were no standout end markets. For plate, prices have continued to trend higher because of mill supply restrictions, mills opting to roll more profitable sheet and a lack of imports.
Though inventories rose in April, service centers reported continued discomfort with the steadily rising prices. Expectations are that prices will be up substantially with July orders.
Mill lead times for plate also jumped out to 9.1 weeks in the latest SMU survey, and contacts continue to report mills limiting the amount of material they can buy. With supply limited and mills running behind schedule, service centers are managing holes in their inventories by buying material from other service centers.
Inventories fell critically low in March, and some service centers said they were unable to quote on new business. On-order volumes grew and reached a new peak in April.
The amount of plate in inventories tied to contracts was 34.5% in April, down slightly from 35.7% in March.


