

Market Data

April 15, 2021
Shipments and Supply of Steel Products Slip in February
Written by David Schollaert
Mill shipments of steel products fell 9.8% month on month in February, while apparent supply was down by 12.5% during the same period. This is the first noticeable decrease in both apparent supply and shipments of steel since the market reached bottom back in May 2020. Mill shipments were down by 13.1% year on year, while supply trailed February 2020 totals by 11.2%. This data provides further clarity to the extended lead times and lack of supply that has failed to meet rising demand, and consequently has ballooned steel prices to historic levels.
This analysis is based on steel mill shipment data from the American Iron and Steel Institute (AISI) and import-export data from the U.S. Department of Commerce (DOC). The analysis summarizes total steel supply by product from 2008 through February 2021 and year-on-year changes.
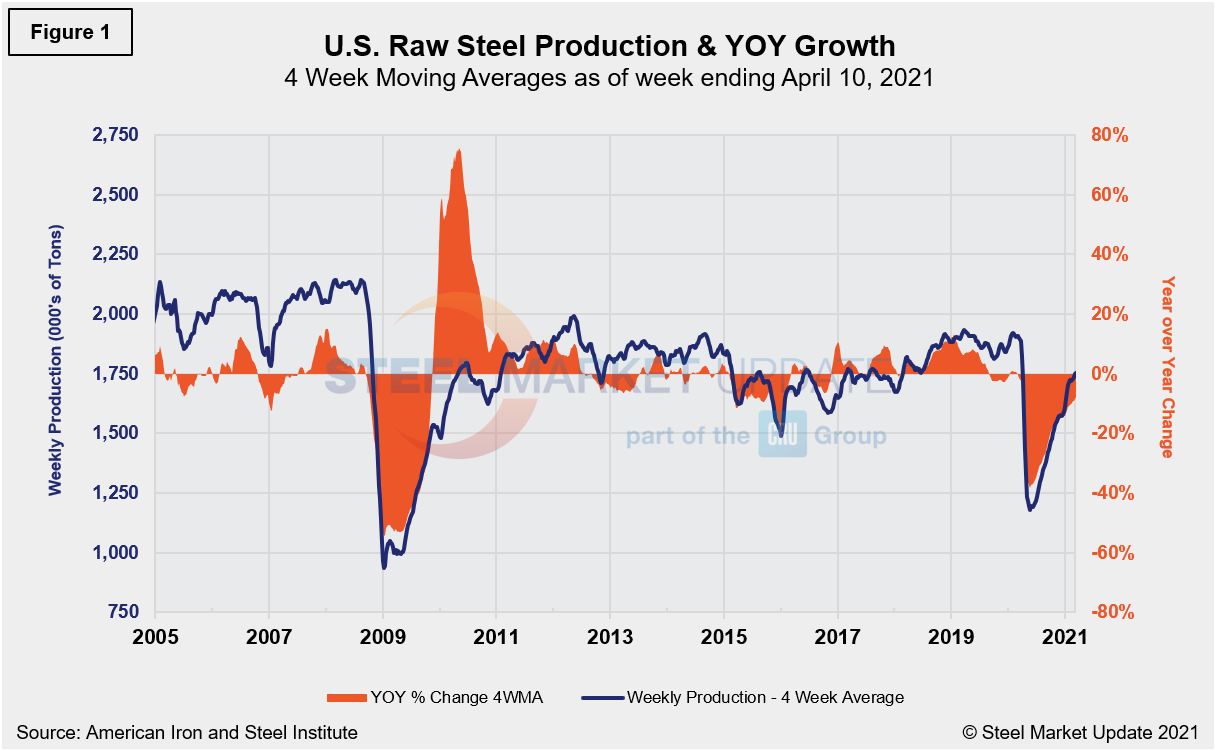
Pent-up demand continues to outpace supply, extending lead times and driving prices to unimaginable highs. As COVID-19 set in during the first half of 2020, prices were driven down by poor demand resulting from the widespread shutdowns. At its lowest point in mid-August, prices fell to $440 per ton, according to Steel Market Update’s check of the market. Prices for HRC are presently at an average of $1,370 per ton, topping the previous record high by $300, with further increases expected in the near-term. Despite strong efforts across the steel sector, shipments and supply of steel products have not reached pre-pandemic levels. Since plummeting to a negative 37.3% in the week ending May 16, 2020, raw steel production continues to lag pre-COVID-19 output. Thus, contrasting production with year-ago levels can be misleading. If compared with the same period in 2019, however, production is down by 8.7%. These are four-week moving averages and are based on weekly data from the AISI in Figure 1 below.
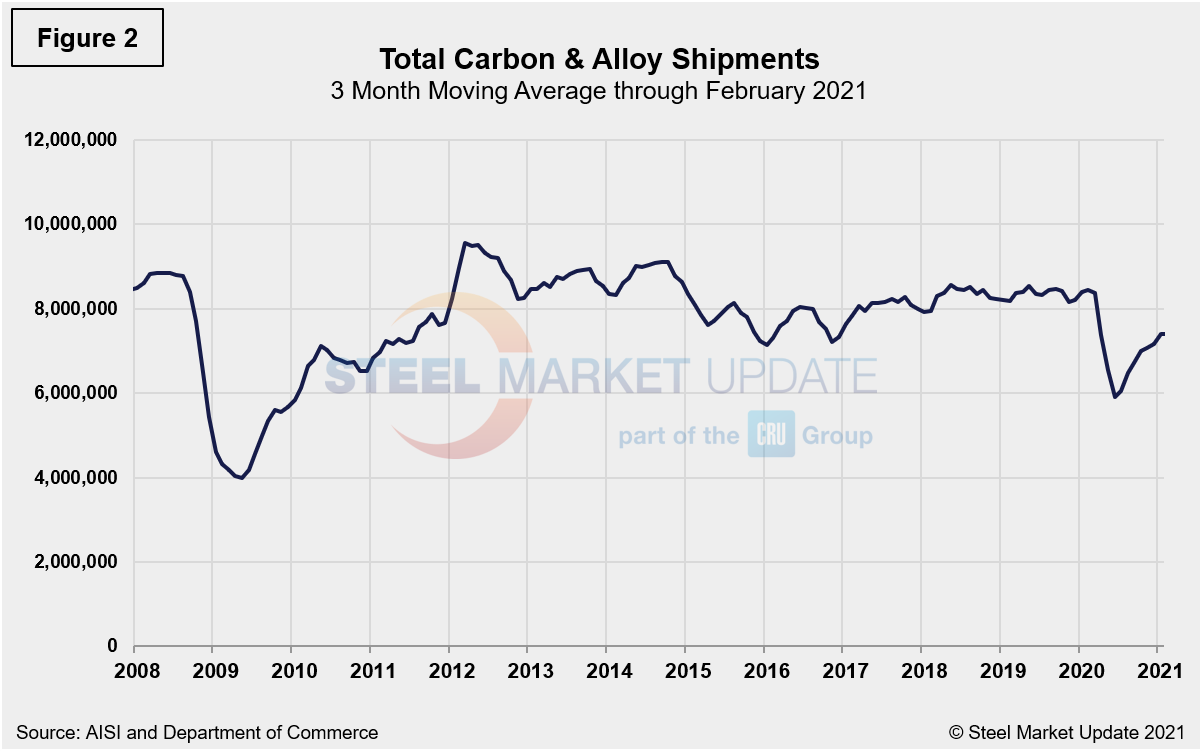
Monthly shipment data for all rolled steel products is noted in Figure 2. The trajectories of the rebounds since Q2 2020 are comparable in Figures 1 and 2. Measured as a 3MMA of the monthly data, February’s total was 7.108 million tons, compared to 7.877 million tons in January, a 9.8% decrease month on month. More importantly, shipments are still trailing year-ago totals of 8.176 million ton by 13.1%.
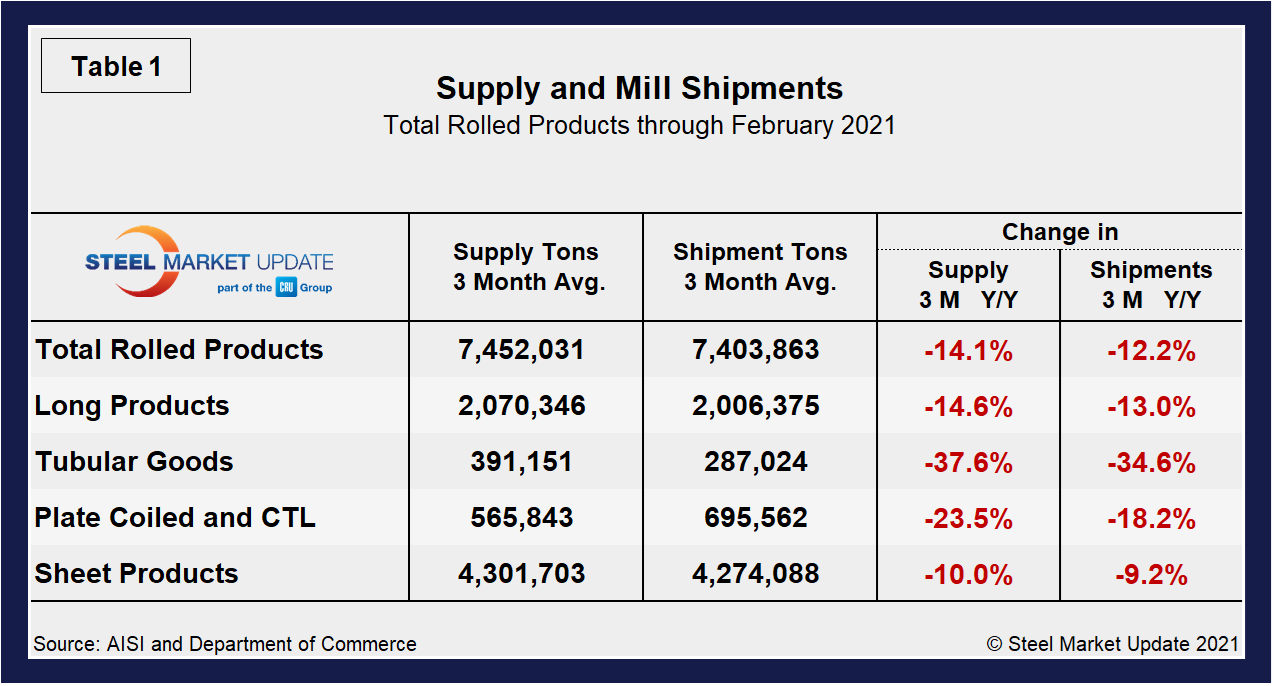
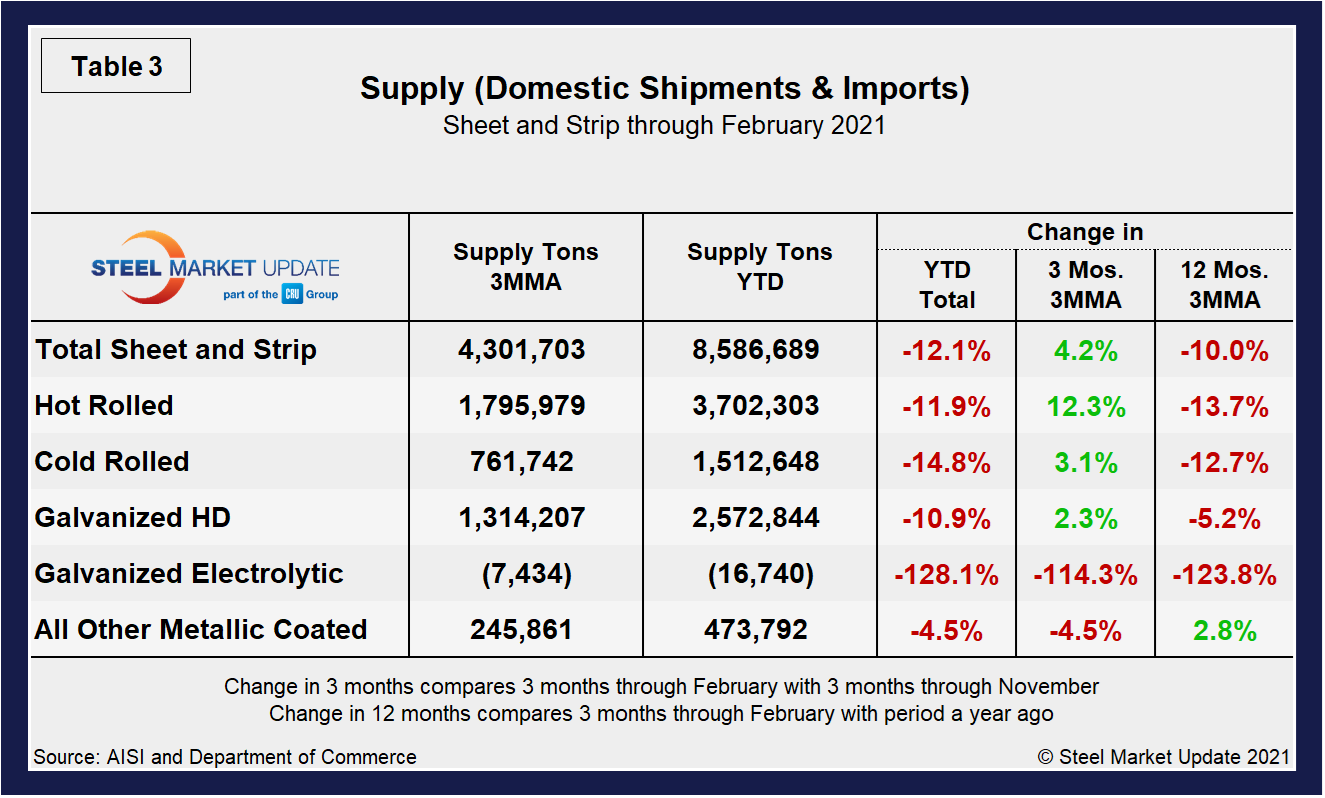
Shipment and supply details for all product groups are noted in Table 1, followed by individual sheet products in Table 2, and domestic supply (shipments and imports) in Table 3. Total supply (proxy for market demand) as a 3MMA was down by 14.1% year over year in February, but up from negative 14.9% in January and negative 28.1% last June when the market was at its lowest. Apparent supply is defined as domestic mill shipments to domestic locations plus imports. Mill shipments fell to negative 12.2% in February, compared to a negative 11.9% in January, but was still an improvement from negative 29.1% in June 2020. There is still a major variance between products. Even though a decline across all products was seen, tubular products continue to be the most affected at negative 37.6%, but a big improvement from negative 46.0% in January.
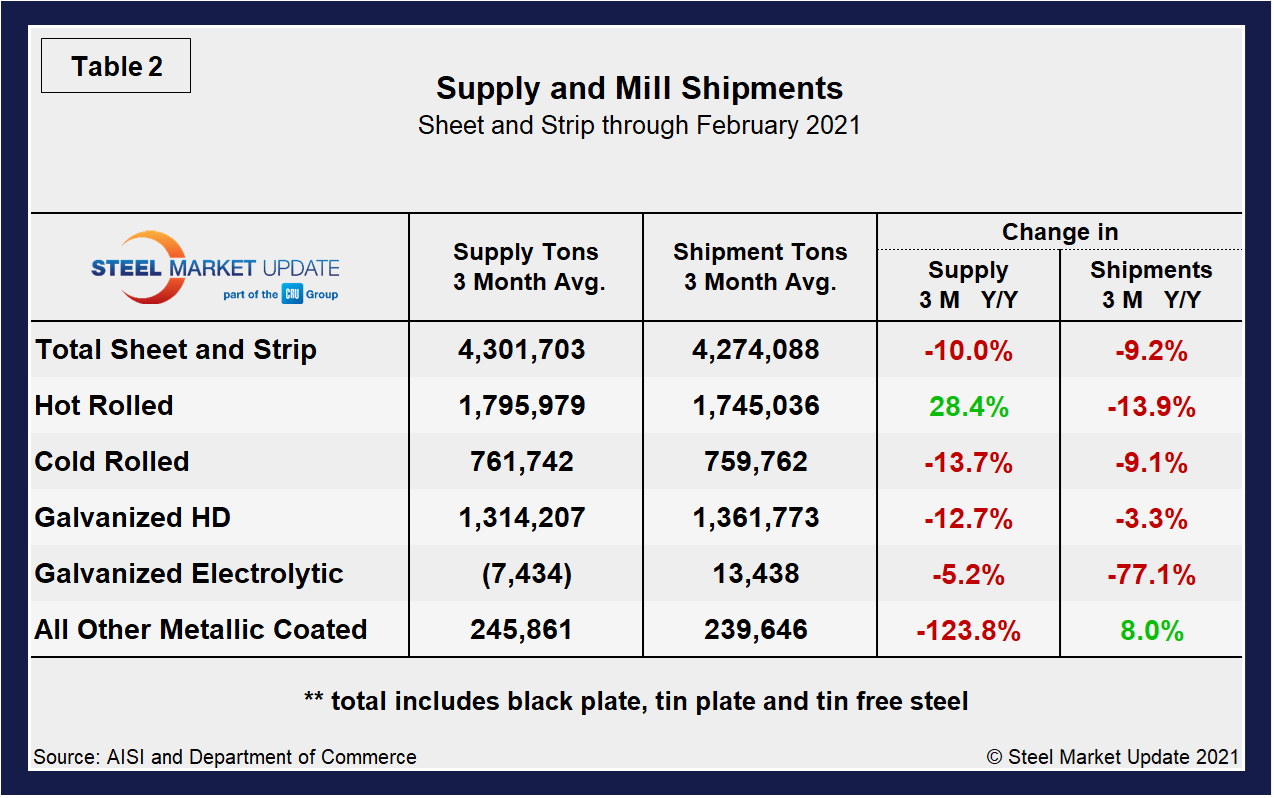
Overall sheet product shipments are down (Table 2). However, hot rolled has surged of late, reaching a positive mark of 28.4% in February, but down from 38.2% in January. In the three months through February 2021, the average monthly supply of sheet and strip was 4.302 million tons, down from 4.779 million tons the year prior. Note that year-over-year comparisons have seasonality removed. Total sheet and strip product shipments were down by 12.1% year to date (Table 3) compared to 2020. As a 3MMA, however, it’s important to note that all products have continued to turn, in some cases, markedly.
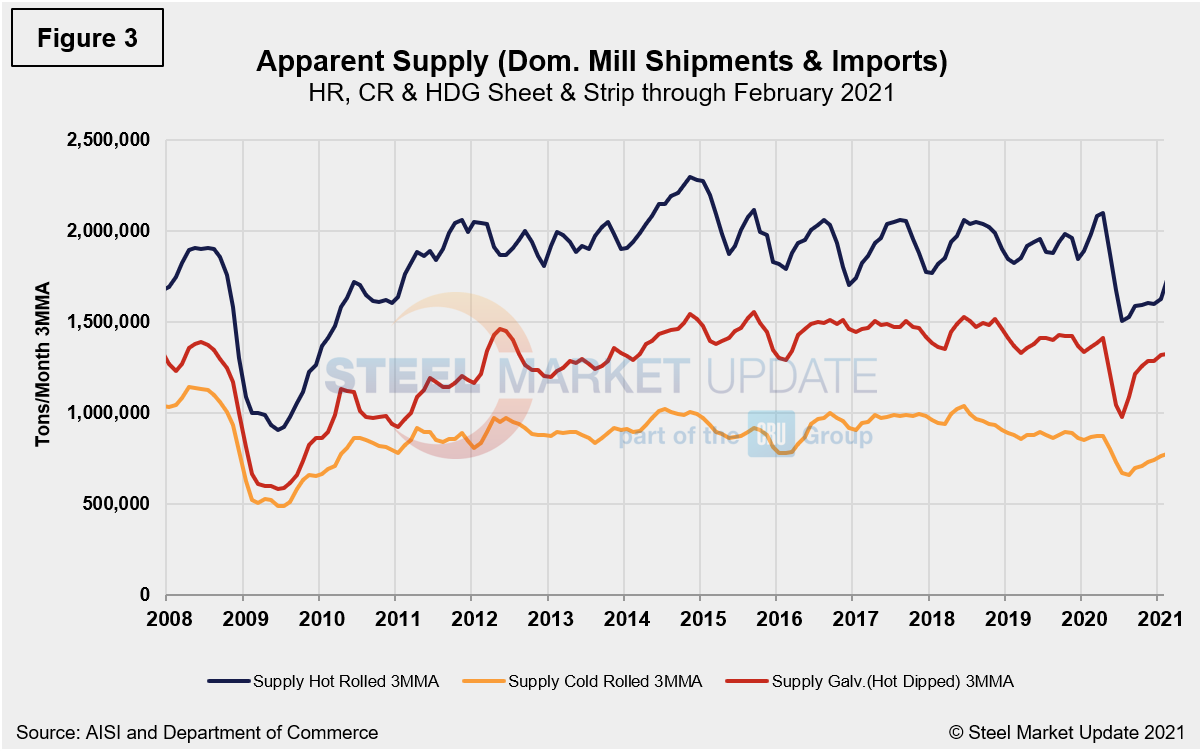
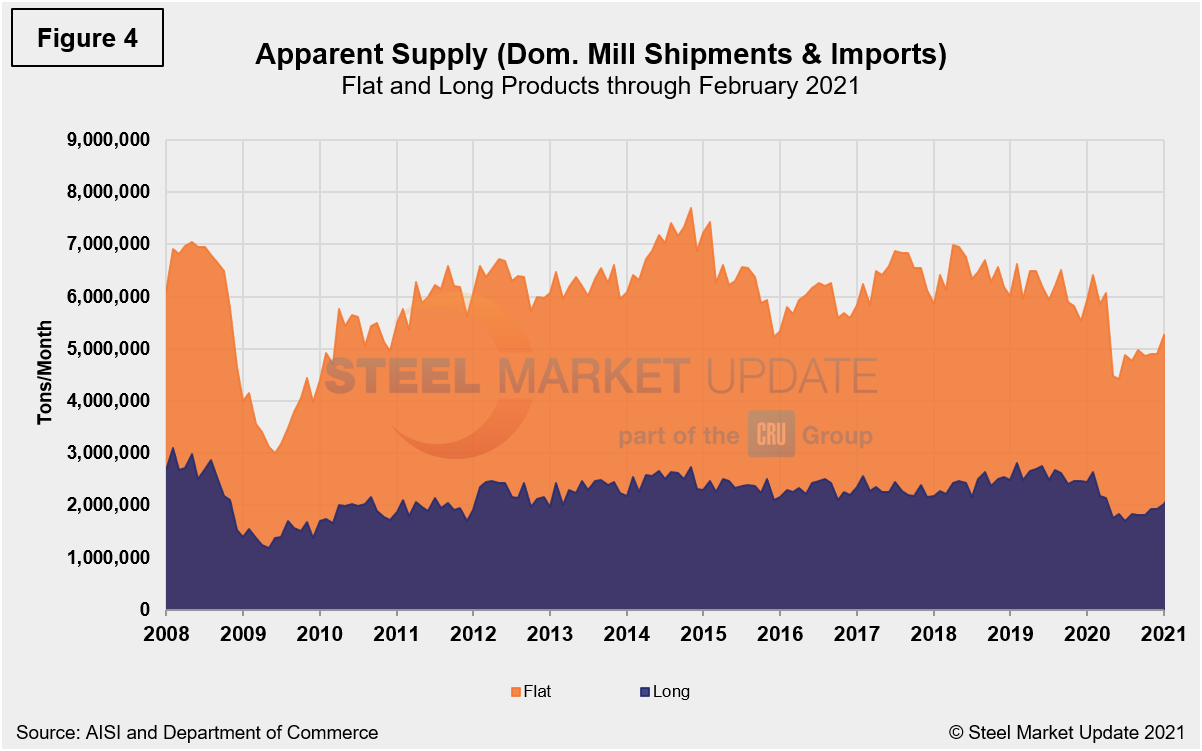
The long-term supply picture for HRC, CRC and HDG since August 2008 as three-month moving averages in Figure 3 and Figure 4 show the long-term comparison between flat and long products. All three sheet products have experienced some improvement since mid-2020, but hot-dipped galvanized had seen a 35.4% jump since reaching bottom this past June, but dipped month on month in February by 0.8%. In Figure 4, note that these are monthly numbers (not 3MMAs), and clearly show the trend difference between longs and flat products including plate.
By David Schollaert, David@SteelMarketUpdate.com


