Prices
February 25, 2021
Hot Rolled Futures: The Long and Short of It
SMU contributor Bryan Tice is a partner at Metal Edge Partners, a firm engaged in risk management and strategic advisory. In this role, he and the firm design and execute risk management strategies for clients along with providing process and analytical support. Prior to Metal Edge Partners, Bryan held a variety of commercial leadership roles involving purchasing, sales and risk management for Feralloy Corporation, Cargill Steel Service Centers and Plateplus Inc. You can learn more about Metal Edge @ www.metaledgepartners.com. Bryan can be reached at Bryan@metaledgepartners.com for queries/comments/questions.
Steelmaking and steel processing has always been an exacting business. Customer specifications can be rigid and industry tolerances have often lagged what the market demands. For those who sell processed slit coil or cut-to-length sheets, you well know that there are specific tolerances that need to be met. Too narrow and your customer cannot make the part, too wide and there will be excessive scrap that your customer will either be unable to process or at the very least seek recompense. When it comes to cut-to-length sheets, if it is cut too short your customer runs out of steel while burning on their laser table, whereas if it is cut too long and outside your customer’s tolerance, the sheet will no longer fit inside the laser bed and result in a rejection. Trading steel derivatives is no different in that there are consequences in being too short or too long.
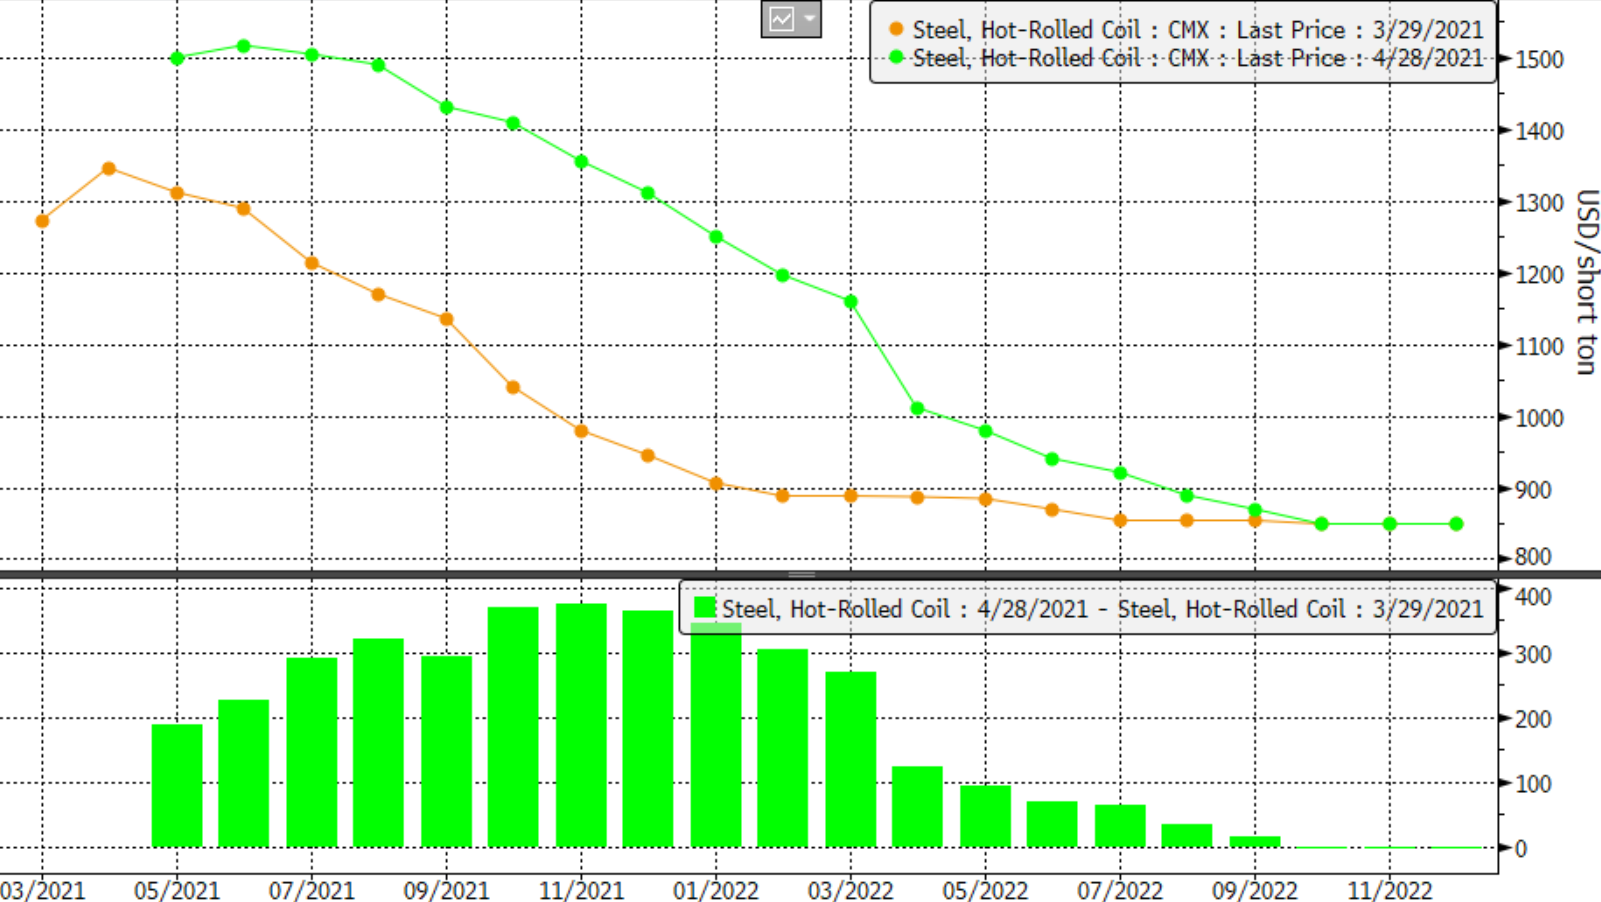
During this historic rally in steel prices, those steel companies holding long positions in steel futures are making outsized profits as they’ve either locked in advantaged steel costs months ago that are well below typical index discounted deals, or they have been outright opportunistic and enjoyed appreciating steel prices on their physical inventory while double-dipping on their long futures contracts. Meanwhile, short sellers have been facing daily margin calls and sleepless nights as they patiently await a market correction to grab the gains that have been so elusive for the short side. The chart below details the month-over-month change in HRC futures prices. Despite where we have been thus far, futures participants still have plenty of chips on the table; lady luck can be fickle, and fortunes can change quickly.
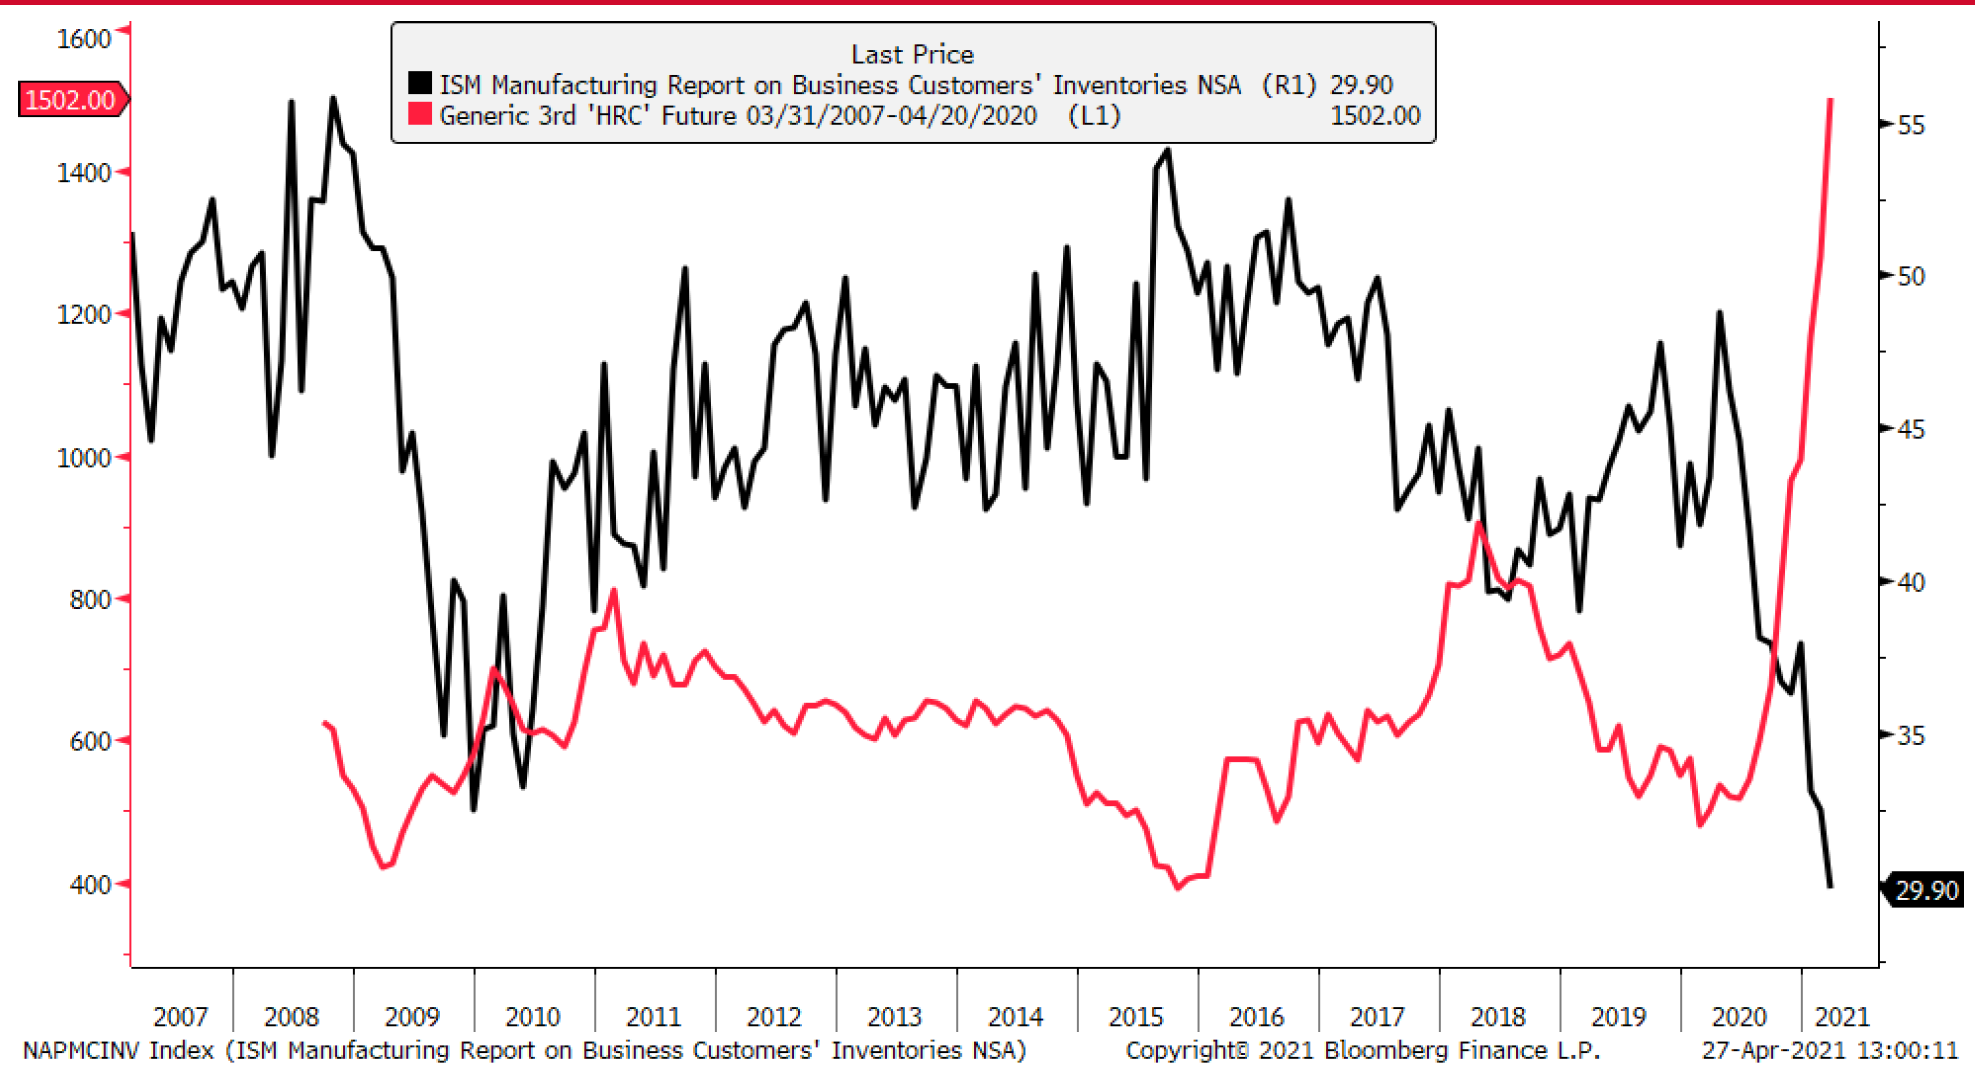
Dynamics in the steel business remain very fluid. Steel mills have recognized that taking planned maintenance outages at a time of record steel prices may be ill advised. We have seen a willingness to push some of these outages into the second half of 2021, or at least until a point that some weakness develops, so they can then execute them in the event that lead-times slip or prices start to decline. Buyers on the other hand are navigating historically low levels of steel inventories, extended lead times, and are struggling to keep pace with generally positive demand forecasts and shipment trends that will inevitably force them to re-stock in advance of a major price correction. The same dynamic holds true across most of the manufacturing sector as evidenced by the ISM customer inventory report below. While the ISM customer inventory chart is not steel exclusive, it does represent the lowest level of manufacturing inventory as measured by ISM since the data collection series began in 1997, and a strong negative correlation with the forward 3-month HRC contract persists.
Having listened to multiple quarterly earnings calls for manufacturing companies and various analyst interviews over the last few days, we continue to hear themes about commodity inflation and the headwinds that they are creating as the economy continues to recover. Looking back over the last 20-year steel price cycle and adjusting for inflation, you will see we have now surpassed the 2008 inflation-adjusted peak by nearly $84/t.
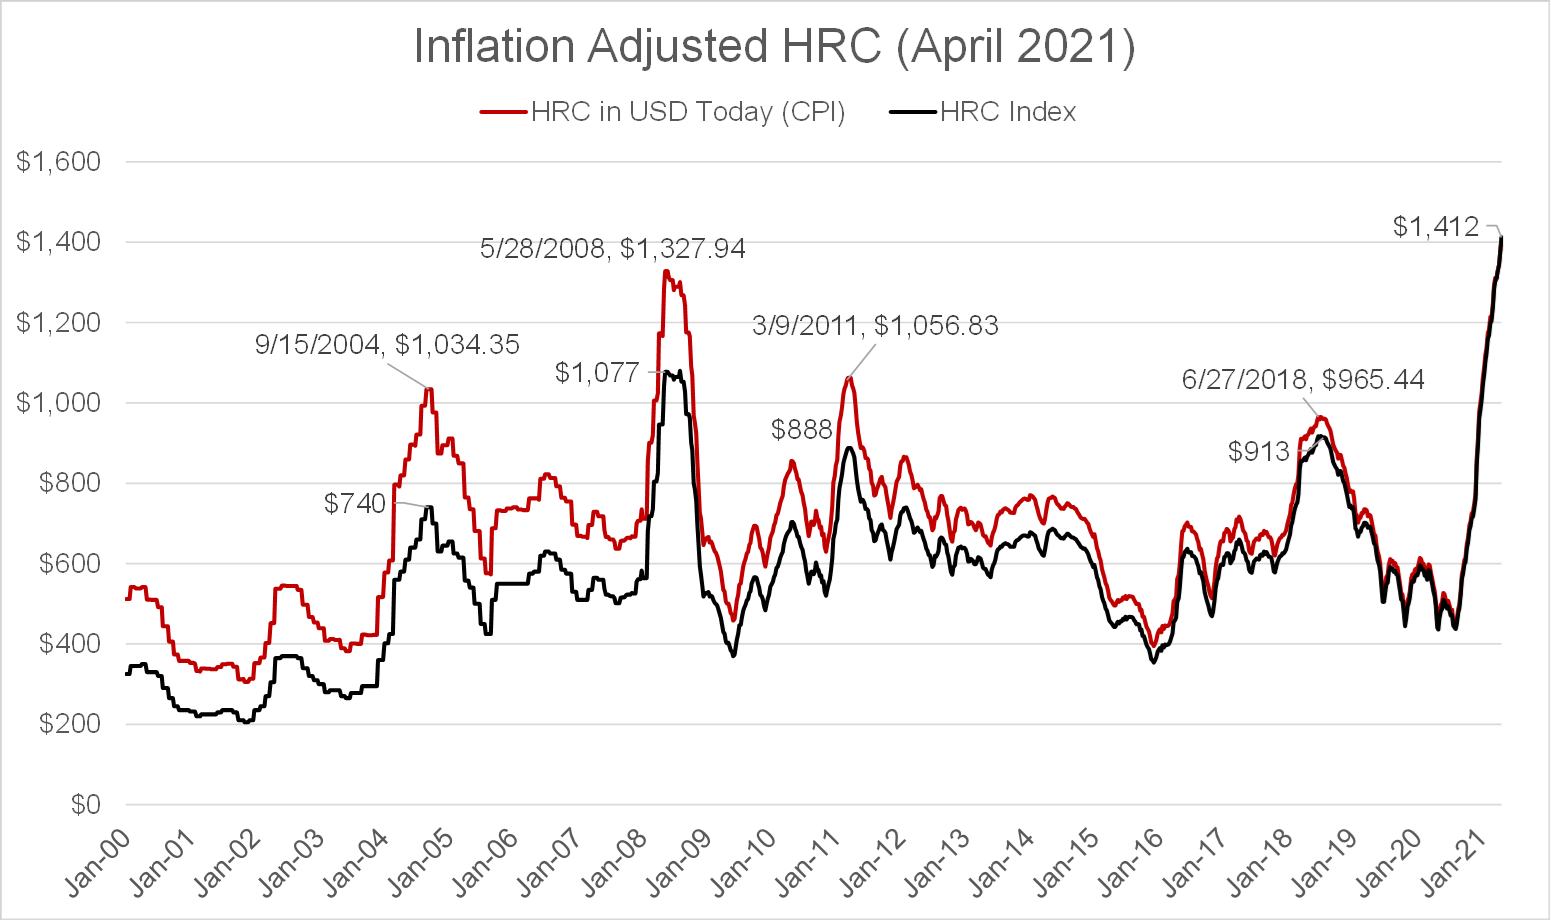
The challenge in comparing the current landscape to then is that the collapse of the steel market due to the Great Financial Crisis did not unfold naturally. We saw the entire economy go into a deep freeze that took a long time to recover from, but when we finally saw fundamental improvement in 2011, we were in a similar situation to the 2020/21 post peak pandemic period, where capacity was insufficient to meet rapidly improving demand, which drove prices much higher for a period. I like to focus on the period immediately following the 2011 recovery, where we entered a period of stability in steel prices between 2012-2014. During this period, using published index data, the average for the period was $646/t with only a handful of readings slightly below $600/t versus the period of 2004-2007 where published prices averaging $566/t and never went sub-$400/t. In the pre-2004 era, sub-$400 steel was the norm, with the 2000-2003 average at $285/t. In my mind, this demonstrates that steel has been gradually stair-stepping over the last several decades to keep pace with inflation, although at an uneven cadence. Adjusting for inflation, the period from 2012-2014 translates to a $735/t +/- price in today’s terms, which may be a decent proxy for where steel prices could settle once the chaos of the current market subsides.
While on the topic of inflation, the following chart shows a very interesting dynamic developing with steel’s primary nemesis, aluminum. While all commodities continue to experience rapid inflation, the spread between aluminum prices and steel prices has narrowed to the lowest level since dating back to 2009.
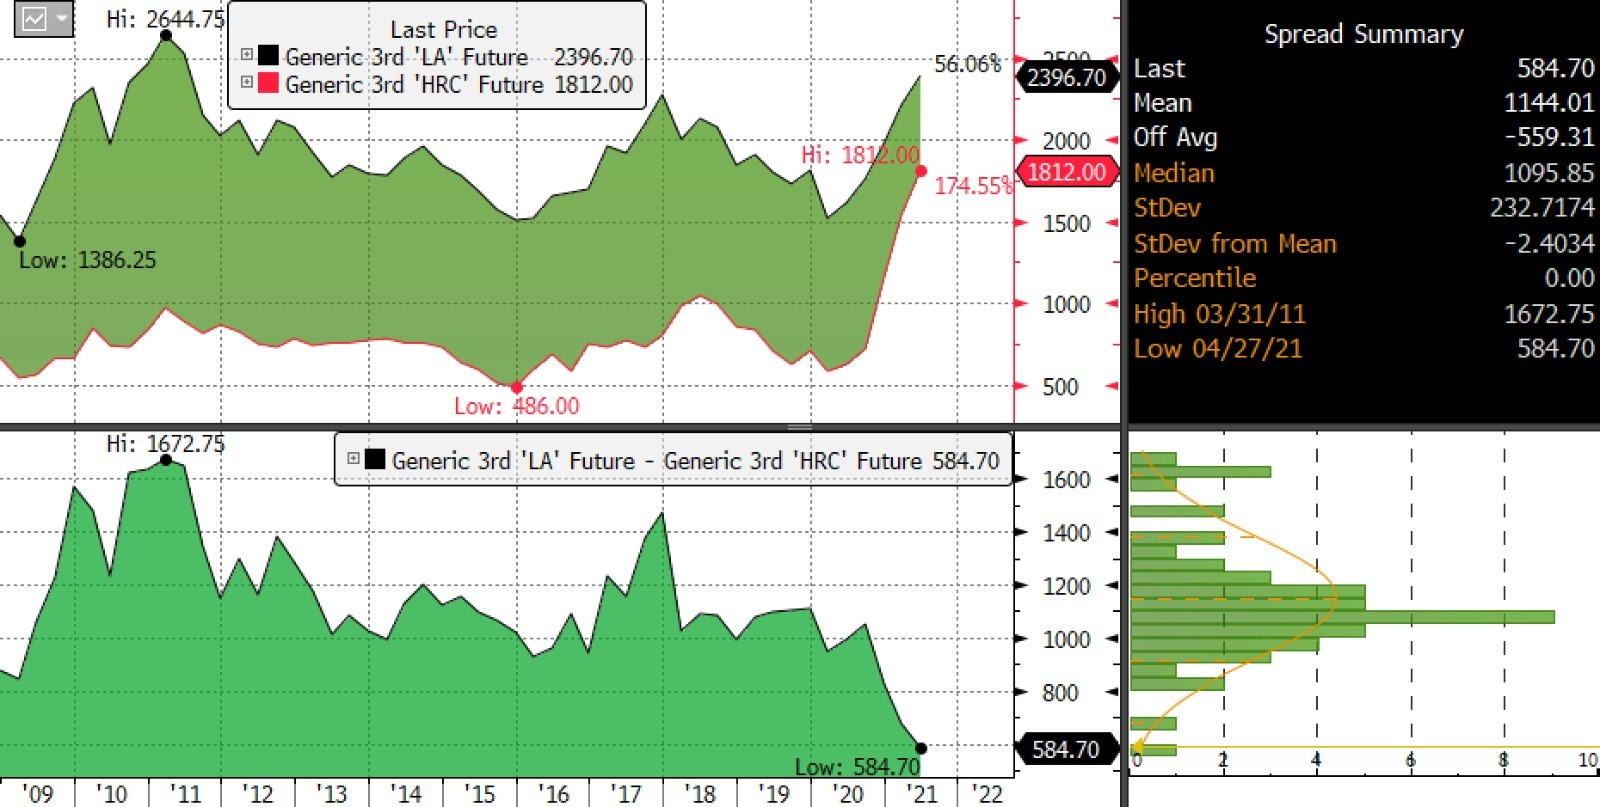
Bloomberg published an article over the weekend touting progress being made between Alcoa and Rio Tinto in developing “Green Aluminum” that emits oxygen as a byproduct instead of the environmentally harmful carbon dioxide, which could go a long way in improving the carbon impact of aluminum versus steel. Should we continue to see a narrowing of the cost difference between these two competing products? Could aluminum be poised to take another bite out of steel if steel prices continue to escalate at a more rapid pace?
We are clearly in unprecedented times, but whether you are an aluminum buyer or a steel buyer, utilizing futures as way to navigate this incredible volatility can be another valuable tool in managing your business.
Measure twice, cut once.
Disclaimer: The information in this write-up does not constitute “investment service,” “investment advice” or “financial product advice” as defined by laws and/or regulations in any jurisdiction. Neither does it constitute nor should be considered as any form of financial opinion or recommendation. The views expressed in the above article by Metal Edge Partners are subject to change based on market and other conditions. The information given above must be independently verified and Metal Edge Partners does not assume responsibility for the accuracy of the information


