

Prices

February 25, 2021
Hot Rolled Futures: Iron Ore Meltdown
Written by Tim Stevenson
SMU contributor Tim Stevenson is a partner at Metal Edge Partners, a firm engaged in Risk Management and Strategic Advisory. In this role, he and his firm design and execute risk management strategies for clients along with providing process and analytical support. In Tim’s previous role, he was a Director at Cargill Risk Management, and prior to that led the derivative trading efforts within the North American Cargill Metals business. You can learn more about Metal Edge at www.metaledgepartners.com. Tim can be reached at Tim@metaledgepartners.com for queries/comments/questions.
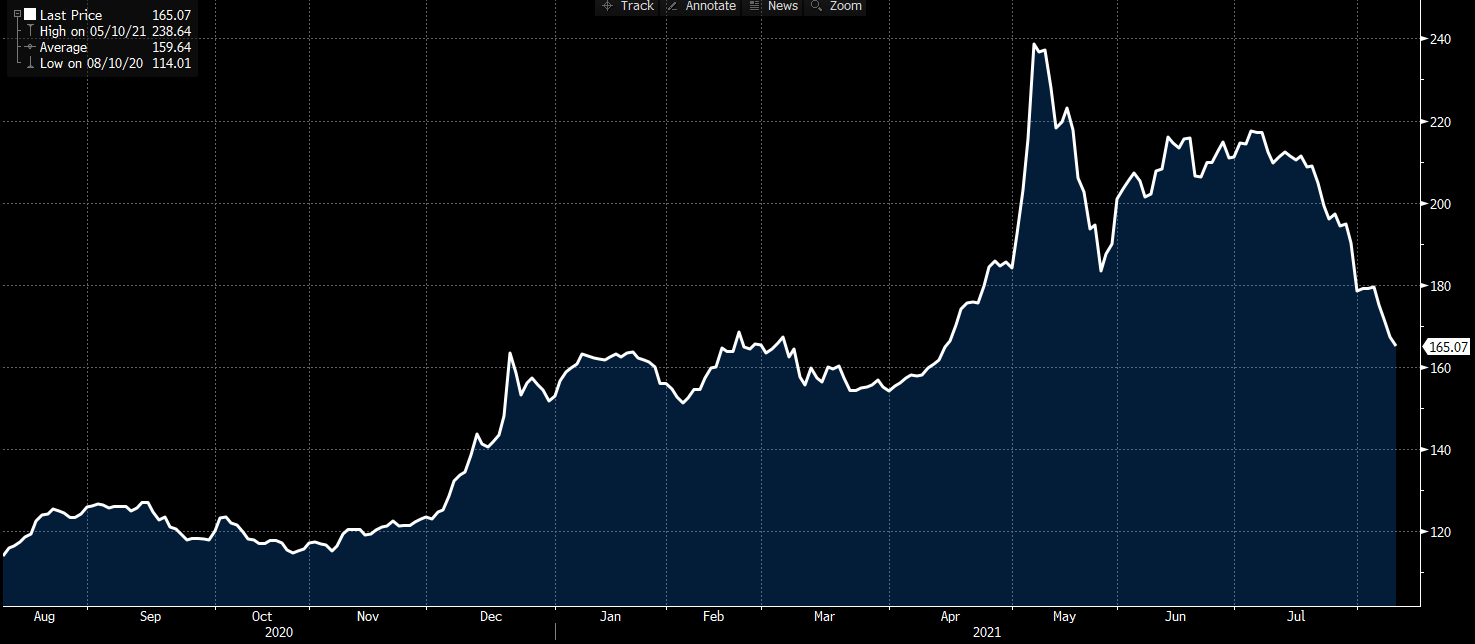
Ore prices have crumbled over the past few weeks. The following chart shows the spot ore price at China’s Qingdao port, in USD/metric ton:
Ore futures (the above chart is spot physical prices) have also plummeted. The following curves are from last night and July 6, when the current downcycle started.
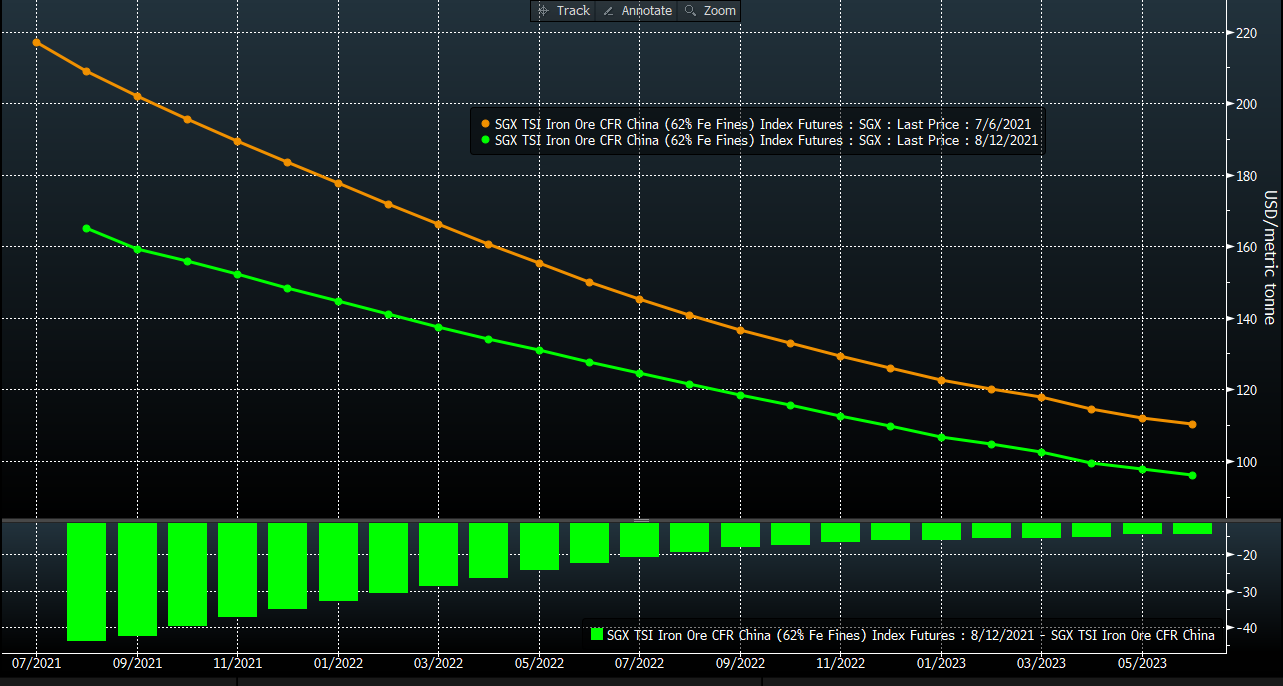
You can see that most of the pressure on the futures curve was in the nearby months, which isn’t too surprising. The ore curve has been in “backwardation” (front months higher in price than further out months) for some time, and when corrections occur in a backwardated market, it is often the front part of the curve that sells off more significantly.
There are a few reasons for the selloff. First, it sounds like the Chinese are trying to limit steel production growth for environmental reasons. Less steel produced = less ore consumed. For a while it seemed like the market took this news in stride, and actually the higher grade ores were bid up in price (if you are trying to make steel and pollute less, you’ll use higher grade versus lower grade ore), but we hit a tipping point in early July and the selloff commenced.
Second, the latest COVID flareups have caused some significant worries about Chinese GDP growth. We have seen some of the Wall Street research houses cut their GDP growth estimates for the current quarter in half. Lastly, there was some buzz about China trying to become more “self-sufficient” in iron ore. This reason seems unlikely to have caused the selloff as any major change in iron ore capacity would take years.
Has the correction in ore prices had any impact on the U.S. HRC curve? Of course not!
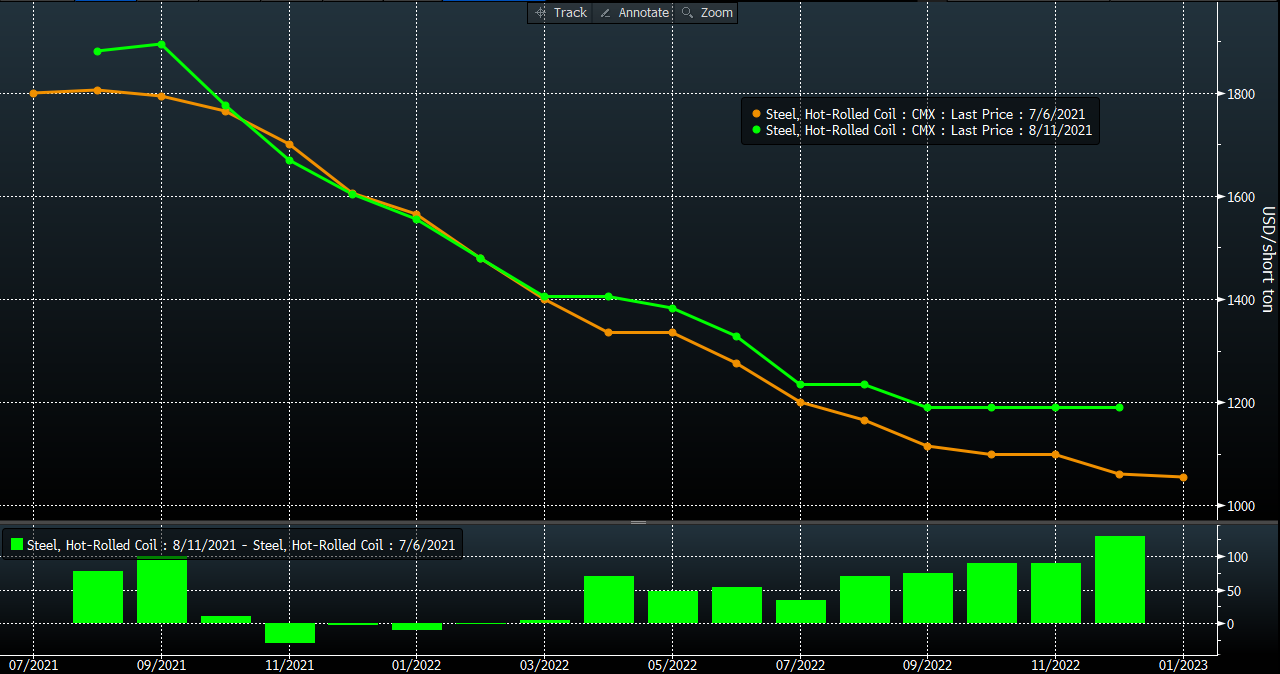
Other than the slight downtick in a few months, most of the curve is higher – indeed several months are $50-100 higher! So, for whatever reason, the weakness overseas has not yet translated into weakness here. The relationships are starting to get stretched, however. Check out this chart of U.S. HRC prices versus ore:
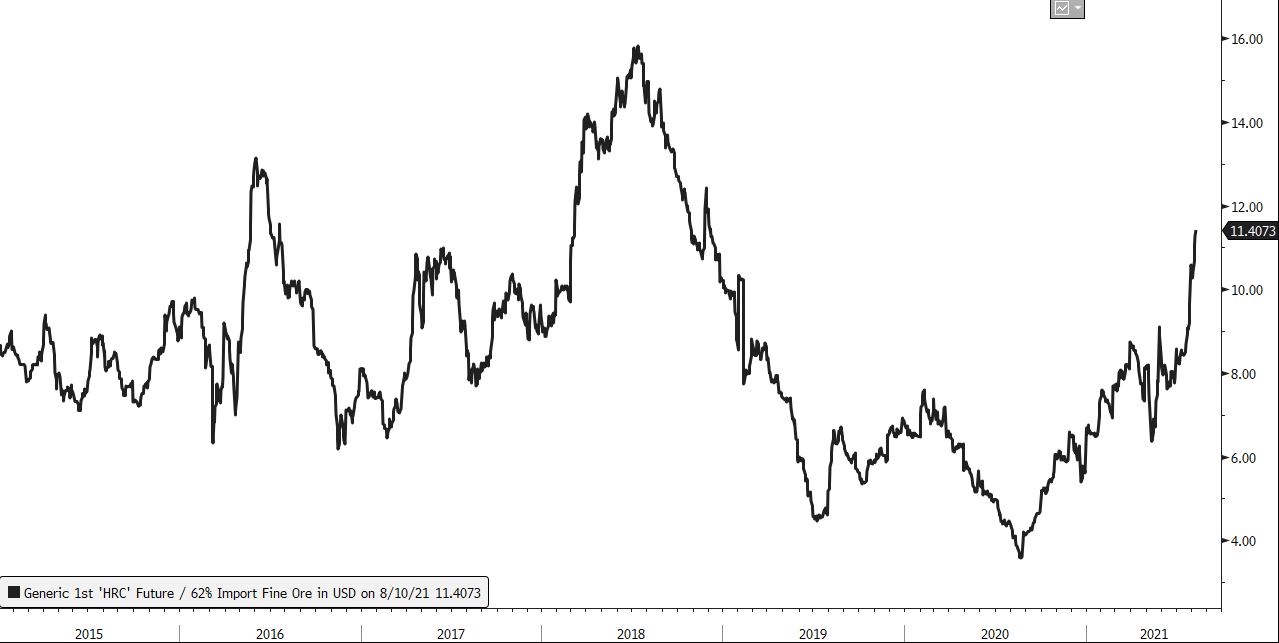
We aren’t yet to the 2018 highs, but other than that year we are getting up to the high end of the range. Keep in mind that ore in 2018 was also roughly $65-70/ton versus the current $165/ton.
Scrap prices have come down in most months since the 6th of July (we are using the same start date to be consistent with the other charts:
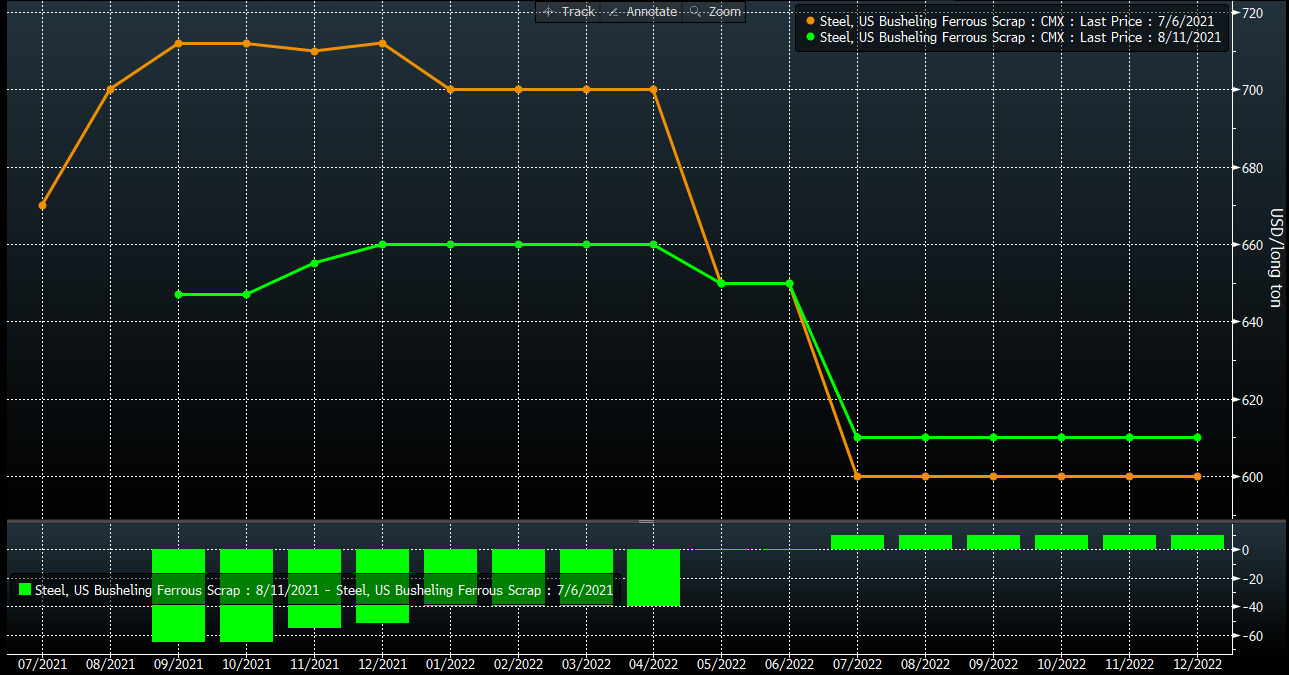
So, the steel market here in the U.S. is really quite the anomaly. Scrap prices seem to be reacting to ore and global pig iron prices, but HRC is staying tight for now.
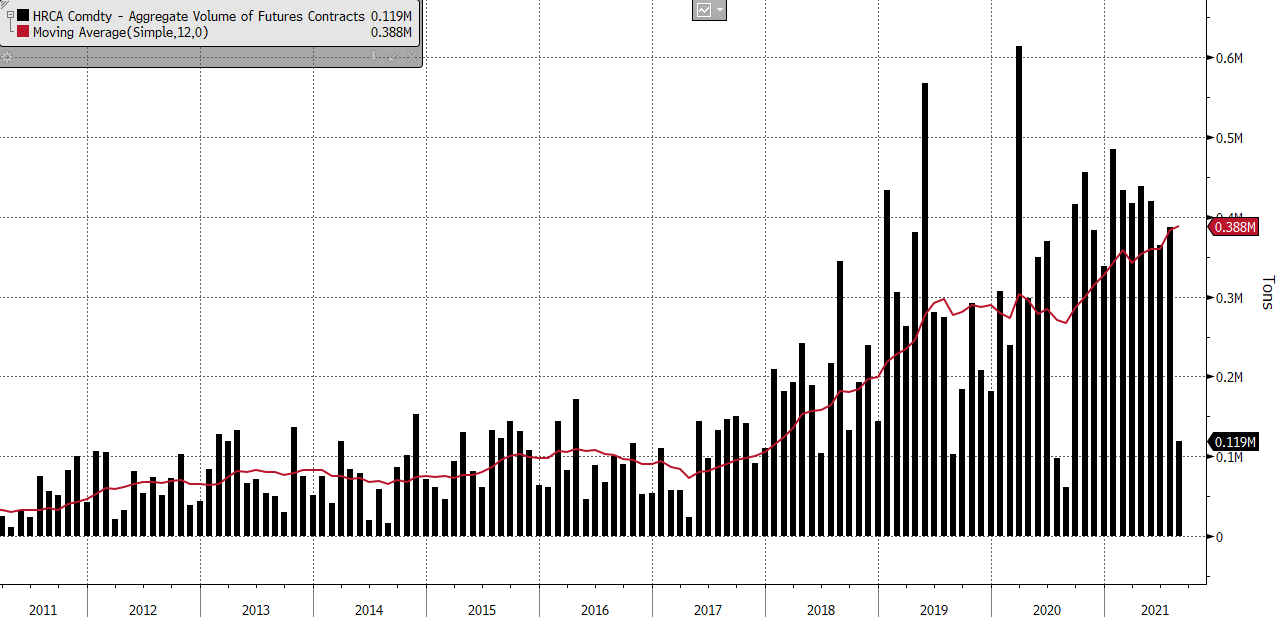
One final comment regarding volumes. You can see in the next chart that the increased adoption of the futures contract is driving increased volumes. The red line is a 12-month moving average, and it is heading in the right direction. Keep in mind that this is only cleared volumes, and does not include “OTC,” or over-the-counter trades. Many people believe that OTC trading is 1-2X the size of the cleared market. So, there is a lot of HRC paper trading hands out there!
Thanks for reading, and please stay healthy!
Disclaimer: The information in this write-up does not constitute “investment service,” “investment advice” or “financial product advice” as defined by laws and/or regulations in any jurisdiction. Neither does it constitute nor should be considered as any form of financial opinion or recommendation. The views expressed in the above article by Metal Edge Partners are subject to change based on market and other conditions. The information given above must be independently verified and Metal Edge Partners does not assume responsibility for the accuracy of the information


