Prices

January 28, 2021
Hot Rolled and Scrap Futures: Turbulent Month
Written by Jack Marshall
The following article on the hot rolled coil (HRC), scrap and financial futures markets was written by Jack Marshall of Crunch Risk LLC. Here is how Jack saw trading over the past week:
Hot Rolled
January has been a turbulent month all the way around—HR futures markets included. After a few months of high velocity price increases for HR futures prices, January has brought a new form of volatility.
In recent weeks HR futures trading has been very active, but price movements have been of a high-velocity multi-directional nature. Price moves that had been happening over a day or a week in recent months have been occurring over much smaller time periods, sometimes even just a few minutes. Price ranges inter day have widened noticeably, especially in the front of the futures curve.
Given the recent high prices in the nearby months, cautious participants are quick to act if the market prices starts falling. After some sizable price declines, prices have rebounded as hedgers who missed earlier price entry points have come into the markets. But in general, we have seen an adjustment of the forward curve as the latter periods have traded lower.
For example, HR Q2’21 and HR Q3’21 blended average prices both declined by just under $80/ST between Jan. 5 and Jan. 27 settles.
Another example of the declining prices along the curve can be seen in a comparison of the Q2’21 HR futures blended average price versus Q4’21 HR for Jan. 5 and Jan. 27. We can see that based on settlements, the spread between these two quarters narrowed by $44/ST ($187-$143). The latest Q4’21 HR futures price traded was $27/ST below the Jan. 5 closing quarterly settlement.
Below is a graph showing the history of the CME Group hot rolled futures forward curve. You will need to view the graph on our website to use its interactive features; you can do so by clicking here. If you need assistance with either logging in or navigating the website, please contact us at info@SteelMarketUpdate.com.

Scrap
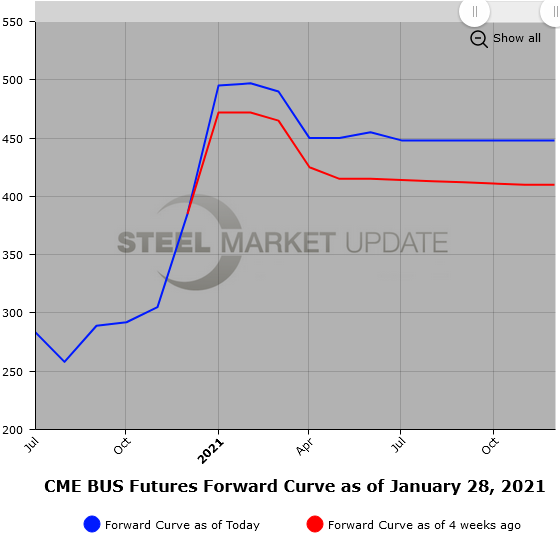
BUS futures in January have also seen a bit more volatility as the futures price curve has declined. The front six months are down an average of $45/GT between Jan. 5 and Jan. 27 settles. Today, the 2H’21 BUS traded at $400/GT, which is an average of $60/GT below where it settled on Jan. 5. Expectations for Feb’21 BUS have moved between sideways to down $20-$30/GT and back to sideways ($492/GT). As a point of comparison, the average of the 12 monthly settles in BUS came in just shy of $300/GT.
Forecasting demand will remain extremely difficult with the uncertainty surrounding new startups as well as maintenance timetables, which keep shifting due to COVID. While obsolete scrap prices are well off their recent highs and hover above $415/MT, some tightness remains in BUS flows. Global markets for metallics still remain tight. Some of the recent softness will likely be absorbed as the Chinese New Year is complete at the end of February.
Below is another graph showing the history of the CME Group busheling scrap futures forward curve. You will need to view the graph on our website to use its interactive features; you can do so by clicking here.


