

Market Data

January 18, 2021
Shipments and Supply of Steel Products Through November
Written by David Schollaert
The upward trend in mill shipments and supply of sheet products continues, although the pace fell off as the fourth quarter carried on. After reaching bottom in June, as a result of the global pandemic, mill shipments and supply maintained a slow but steady upward trajectory through November 2020.
This analysis is based on steel mill shipment data from the American Iron and Steel Institute (AISI) and import-export data from the U.S. Department of Commerce (DOC). The analysis summarizes total steel supply by product from 2008 through November 2020 and year-on-year changes. The supply data is a proxy for market demand, which does not take into consideration inventory changes in the supply chain. Our analysis compares domestic mill shipments with total supply to the market. It quantifies market direction by product and enables a side-by-side comparison of the degree to which imports have absorbed demand.
Following the freefall in shipments and supply of steel products during the second quarter of 2020, the market is still very much in a corrective mode. Although some impact is still being felt across a few pockets of the U.S. domestic market, overall sentiment and apparent supply are rather positive. HRC prices have reached historic levels, now nearing the $1,100 per ton mark and eclipsing the previously recorded high by Steel Market Update of $1,070 per ton back in 2008. Despite these historic gains, the three-month moving averages (3MMAs) for shipments and supply of steel products are still down due to the Q2 slump. Consequently, pre-pandemic levels have not been reached; however, the steady recovery is still very much a bright spot. Even though many believe the bottom was reached this past June, the market is still cautious due to a potentially new Covid-19 surge throughout the winter months.
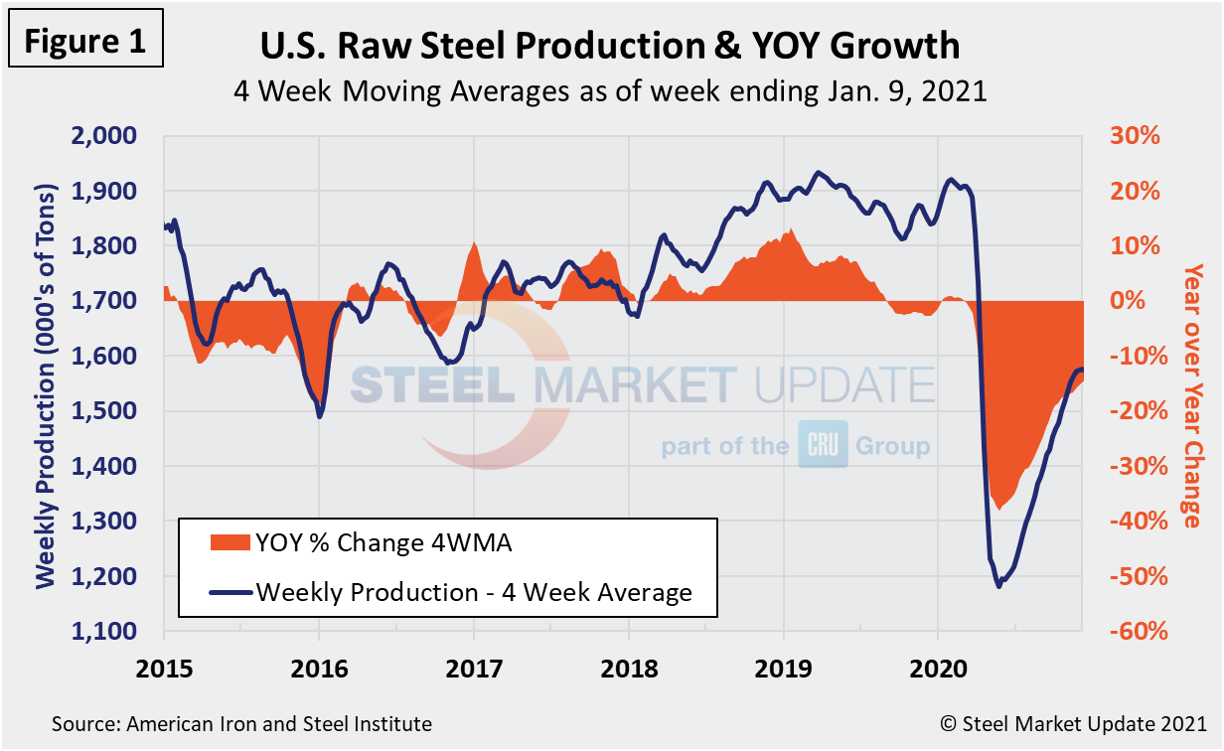
Figure 1 shows the sudden decline in raw steel production that began in February and mirrors the rate of decline experienced in late 2008. The decline this time around has not been as significant, largely since the precipitous fall in 2008 was due to a financial crisis, which called for an extended rate of recover. The year-over-year decline in 2020 maxed out at 37.3 percent in the week ending May 16 and has since improved to negative 11.0 percent in the week ending Jan. 9. Back in 2009, the maximum rate of decline year over year was 54.3 percent in the week ending Jan. 17, 2009. These are four-week moving averages and are based on weekly data from the AISI.
This shipments and supply report is based on monthly shipments by product as reported by the AISI, plus import and export data from the DOC. Figure 2 shows the monthly shipment data for all rolled steel products. In the long run the trajectories of growth in Figures 1 and 2 are comparable, both seeing a turn and slight rise since the bottom was reached this past June. Through the November three-month moving average of the monthly data, gains were marginal. November’s total was 6,900,434 tons compared to 6,892,755 tons in October, a mere 0.1 percent increase month on month, yet down 17.5 percent from year-ago totals when monthly shipments (3MMA) were 8,362,899 tons. These figures highlight that the overall, physical market is matching sentiment; however, in a more tempered fashion.
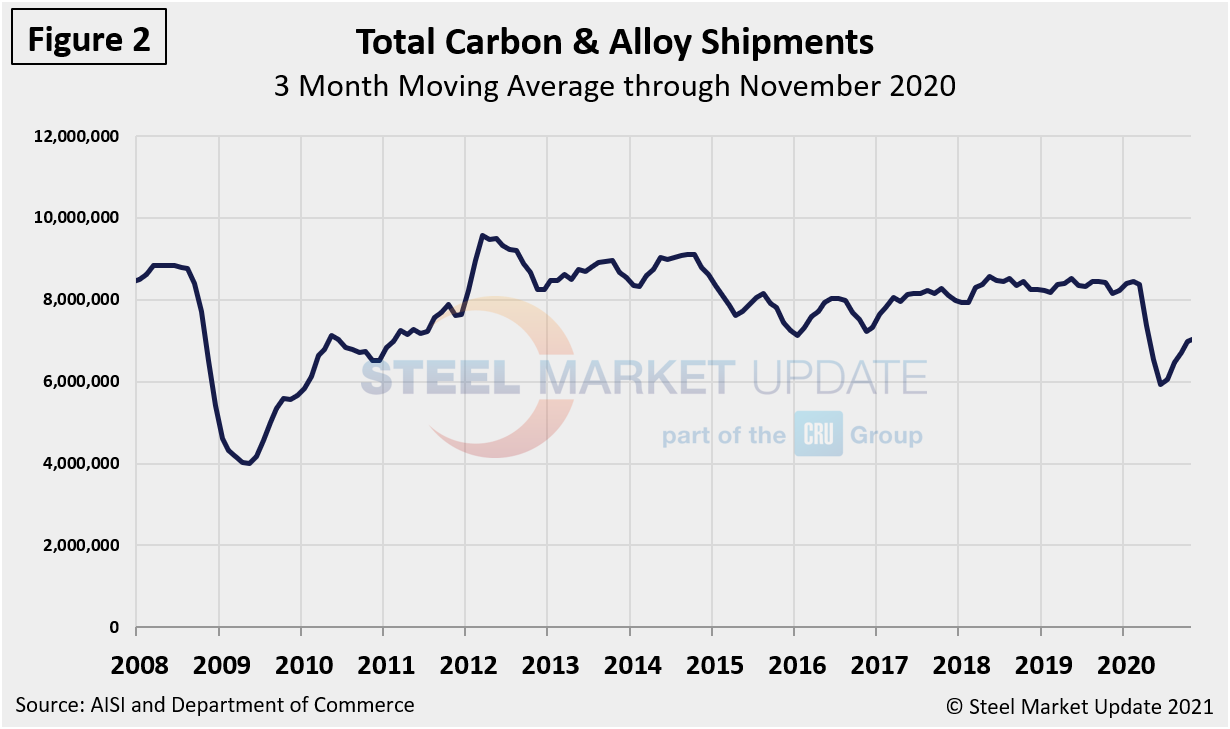
Table 1 is the shipment and supply details for all product groups. Total supply (proxy for market demand) as a 3MMA was down by 17.5 percent year over year in November 2020, yet an improvement from the negative 21.3 percent reported the month prior. Additionally, even though total supply is down, it’s a steady improvement month over month since June when it was a negative 28.1 percent. Apparent supply is defined as domestic mill shipments to domestic locations plus imports. Mill shipments improved to a negative 13.4 percent in November compared to negative 17.0 percent in October and a negative 29.1 percent in June when the market was at its lowest.
Although imports were still taking a noticeable market share in the three months through November year-over-year, they have certainly waned since late Q2. There is still a major variance between products. Even though a decline across all products was seen, tubular products continue to be by far the most impacted at a negative 55.0 percent and negative 21.8 percent for supply and shipments, respectively. The supply of sheet products was down by 8.6 percent in three months through November year-over-year, a noticeable improvement compared to the month prior when they were down by 13.6 percent. Domestic mill shipments were down by 6.0 percent, a 5.3 percent improvement month-on month, and a vast improvement from negative 26.7 percent seen this past June. The total of long products supply was down by 22.7 percent while shipments were down by 21.8 percent. Although the table continues to highlight a negative trend, improvements have been consistently seen month over month across all products since the bottom was reached in June.
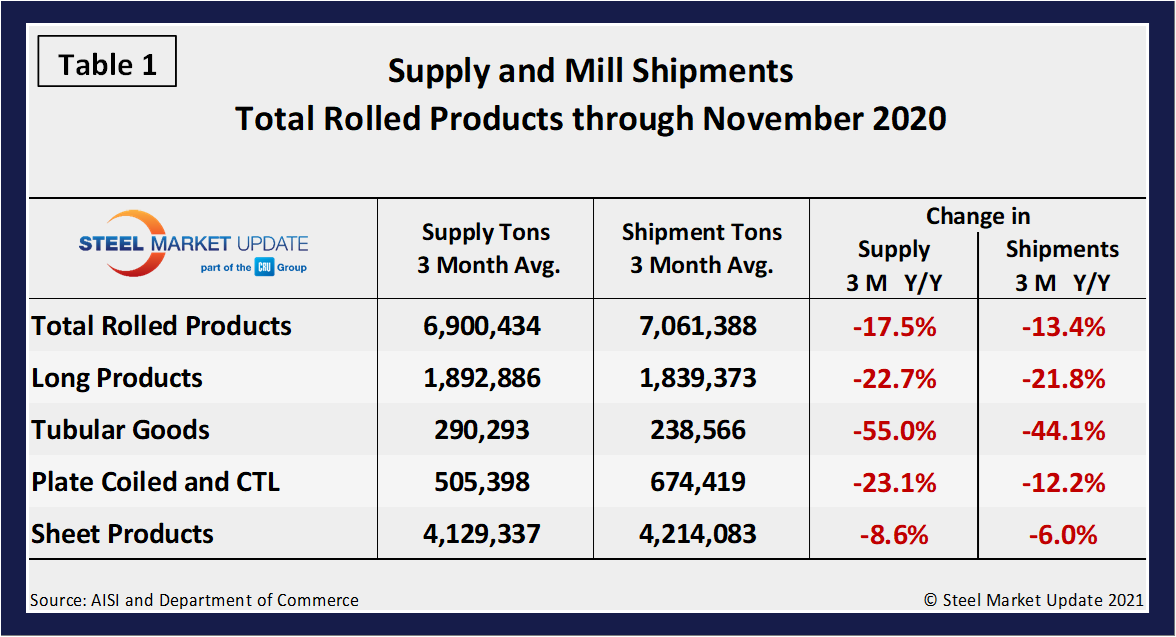
Table 2 describes both apparent supply and mill shipments of individual sheet products (shipments includes exports) side-by-side as three-month averages through November with year-over-year growth rates for each. Overall sheet products are down, however, there are a few bright spots. Both electrolytic galvanized and other metallic coated are seeing significant gains on a three-month moving average. Cold rolled was down the most for supply at a negative 14.4 percent, while hot rolled was most impacted by shipments at negative 10.9 percent. In the three months through November 2020, the average monthly supply of sheet and strip was 4.129 million tons, down from 4.515 million tons the year prior. There is no seasonal manipulation of any of these numbers. Year-over-year comparisons have seasonality removed.
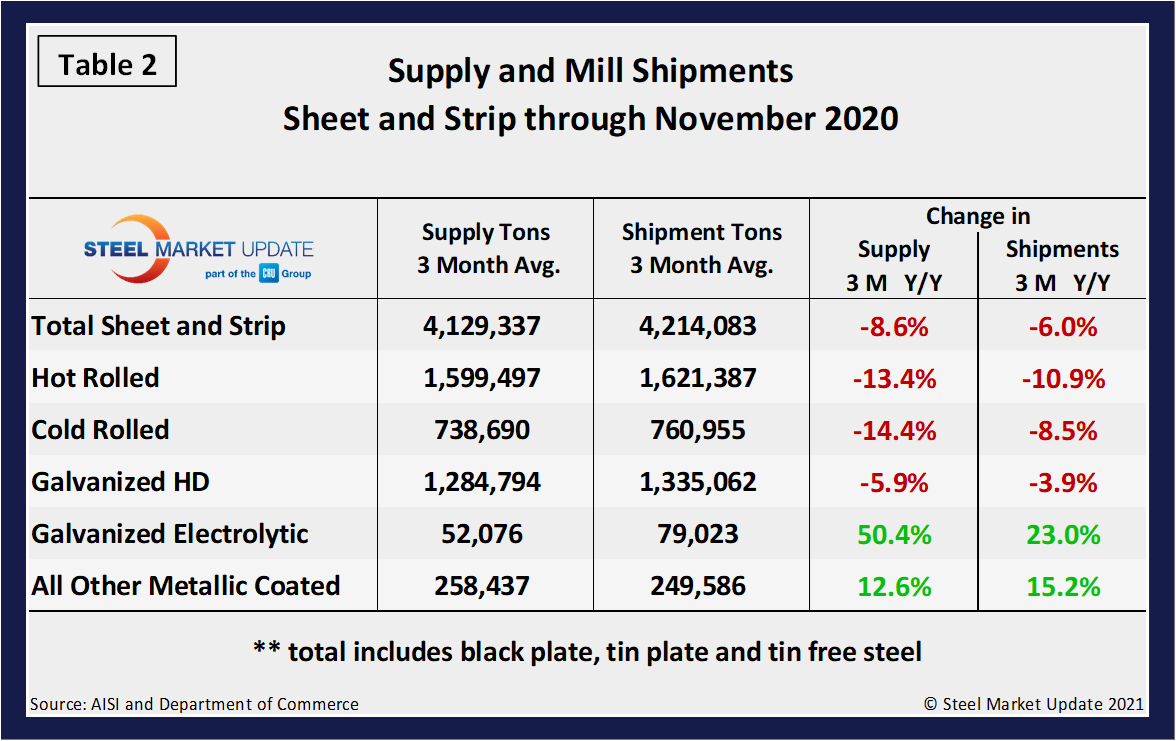
Table 3 shows that total sheet and strip products were down by 10.3 percent year to date compared to 2019, yet saw a slight 0.7 percent improvement month on month. Overall, all sheet products were down noticeably year to date except for other metallic coated, which was up 3.4 percent compare to November 2019. As a 3MMA, however, it’s important to note that all products have continued to turn, in some cases, markedly. Electrolytic galvanized experience the most accentuated gain despite still being down 15.7 percent year to date compared to 2019; however, up 68.1 percent on a 3MMA basis from 30,980 tons in August to 50,078 in November. Despite the severity of the second quarter of 2020, data continues to support the improving market sentiment. The two far right columns compare the second quarter with the first and the second quarter with Q2 2019, respectively.
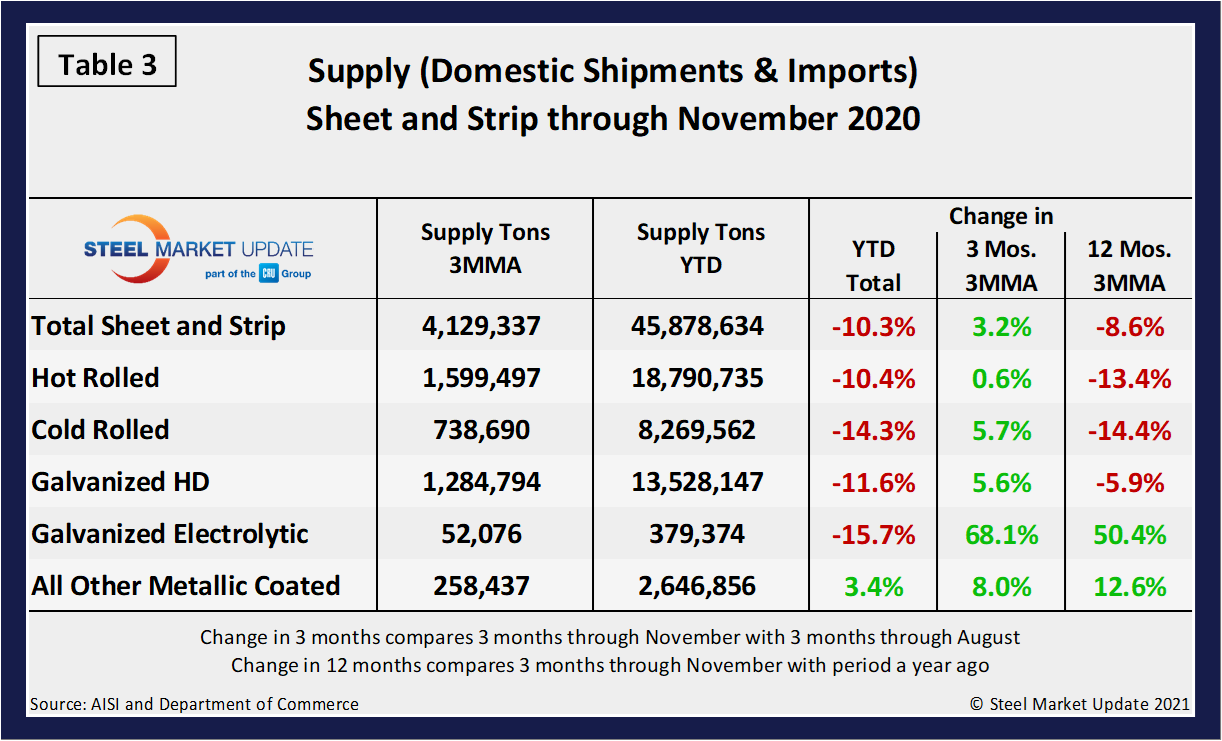
Figure 3 shows the long-term supply picture for the three major sheet and strip products—HRC, CRC and HDG—since August 2008 as three-month moving averages. All three have experienced consistent improvement since reaching bottom back in June 2020. Both hot rolled and cold rolled have increased by 6.8 percent and 9.5 percent, respectively. However, hot-dipped galvanized has seen a 24.9 percent jump since the doldrums of 2020 this past June.
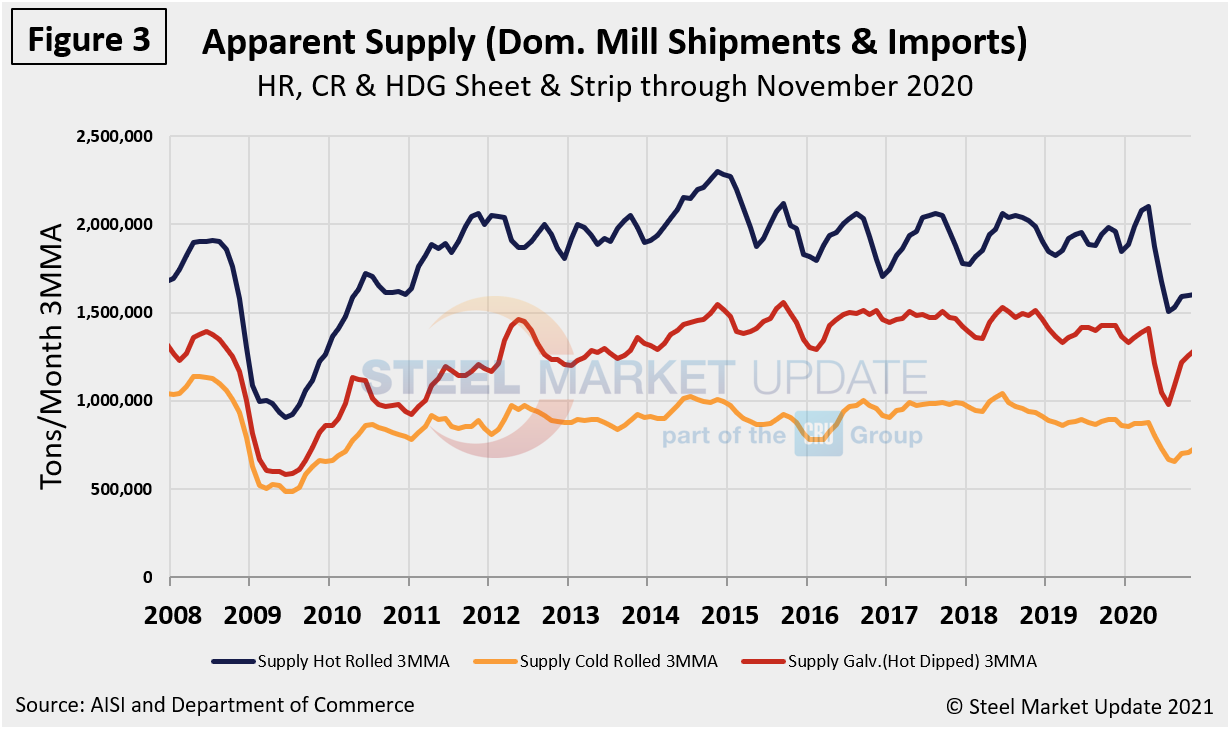
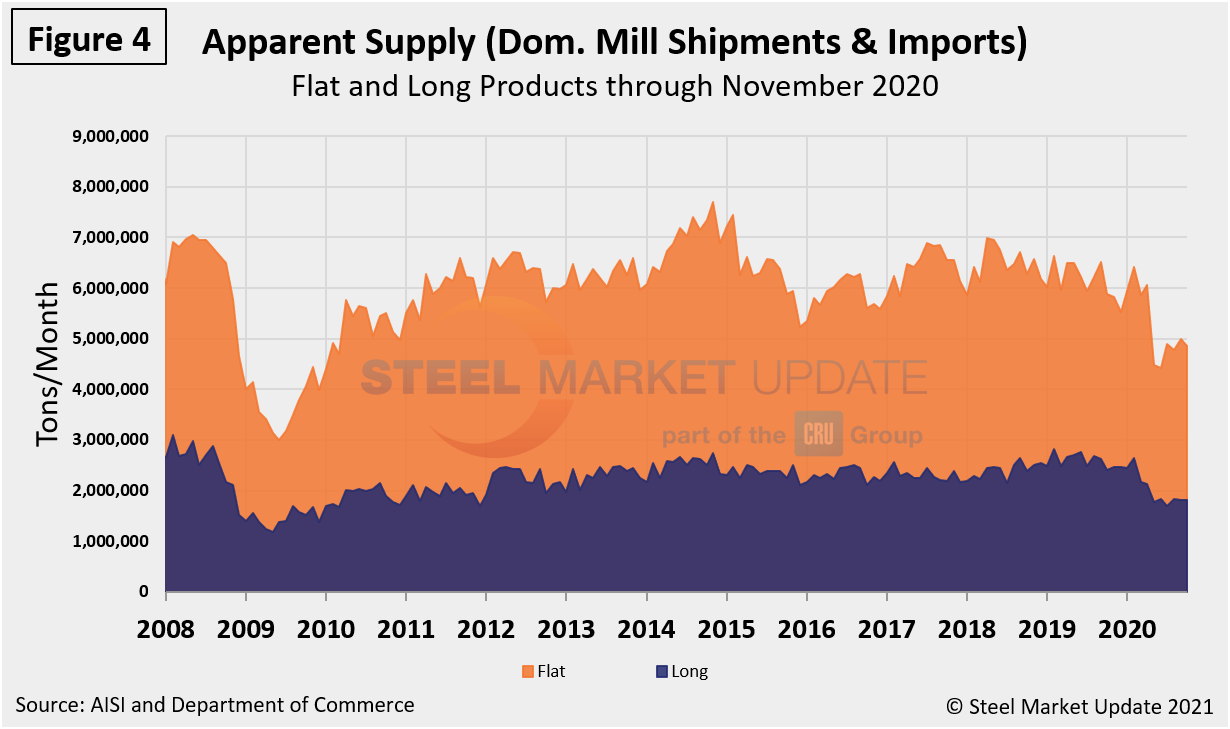
Figure 4 shows the long-term comparison between flat and long products. These are monthly numbers (not 3MMAs), and clearly show the trend difference between longs and flat products including plate.
By David Schollaert, david@steelmarketupdate.com


