CRU

December 23, 2020
CRU: Covid-19 Shaped a Greener Future
Written by Ross Cunningham
By CRU Senior Cost Economist Ross Cunningham, from CRU’s Steelmaking Raw Materials Monitor
Global CO2 emissions have been rising since the start of the industrial revolution. This has caused rising global temperatures and severe weather events such as wildfires, flooding and drought. In 2015 the United Nations framework convention on climate change put together the Paris agreement. This was to serve as a long-term temperature goal to keep the increase in global average temperatures to well below 2 degrees C (3.6 degrees F) above pre-industrial levels. Some nations have had better success than others, and some have pulled out altogether. According to data from the Climate Action Tracker, however, no major industrialized nation is on track to meet its emissions pledge.
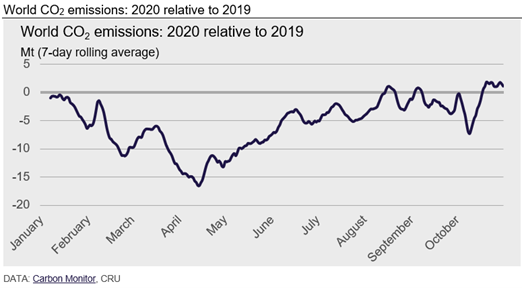
The Covid-19 pandemic has been a social and economic catastrophe. It does however offer the possibility to put the world back on track to meeting the targets set out by the Paris agreement. We saw global CO2 emissions plummet in 2020 coinciding with lockdowns across the world. While emissions are returning to 2019 levels, many governments have committed to a green recovery—investment in cleaner technologies to kick start the economy after a year to forget.
Pre-Covid-19 Emissions
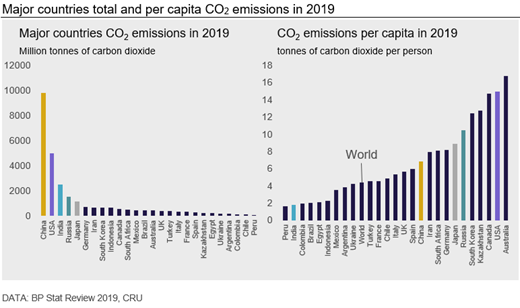
China has been the world largest emitter of CO2 since 2006 when it overtook the U.S. In 2019 China emitted 9825 Mt CO2. This is roughly 29% of total CO2 emissions and more than the next three largest emitters—USA (4964 Mt), India (2480 Mt) and Russia (1532 Mt)—combined.

When we consider emissions on a per capita basis we see a significantly different story. World emissions per capita are 4.4t per person. Chinese per capita CO2 emissions are higher than the global average at 6.8t per person, but they are nowhere near as high as one might expect given it is the largest polluting country overall. The U.S. CO2 emissions are 14.9t per person. Australia with its heavy reliance on coal and iron ore mining and relatively small population has a hefty 16.8t of emissions per person.
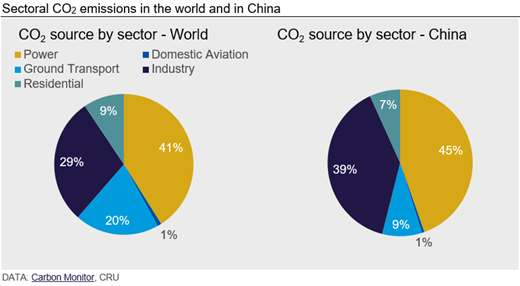
There are many ways you can break down CO2 emissions by sector. According to Carbon Monitor using activity data and emissions factors from the IPCC 2006 guidelines, 41% of global CO2 emissions come from power generation with industrial processes producing 29% of total CO2 emissions. Comparably, in China, their reliance on industrial process for economic growth means 39% of CO2 emissions are from industry, and 45% (compared to 41% for world) from power generation due to the high proportion of coal in their fuel mix. Reducing emissions from power generation—by switching to renewable fuel sources—is a critical part for the energy transition. The same is true for industrial emissions where shifts need to take place to environmentally considerate technology and processes.

Covid-19 and Its Impact on Emissions in 2020
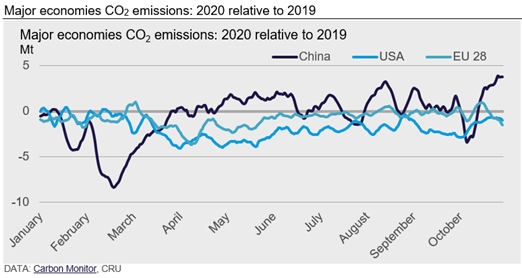
With over three-fourths of the world’s population in lockdown in April of this year, transport was drastically reduced, and consumption patterns changed significantly. As a result, CO2 emissions plummeted. On a country-by-country basis, lower CO2 emissions were a result of when major cities went into lockdown. In China, total CO2 emissions in the months of February and March 2020 combined were ~250Mt less than the equivalent months in 2019. China was first to respond to the virus, with national lockdown in the aforementioned months. By April, CO2 emissions in China had effectively returned to 2019 levels.

It was not until March and April that we saw lockdowns enforced in the U.S. and major European economies. While the daily difference was less than that of China, both the U.S. and the EU-28 had lower emissions in 2020 compared to 2019 for as long as eight months.

The scale of the task ahead for the nations that have agreed to net carbon neutrality became apparent due to the impact of Covid-19. As a result of the virus, we have seen a massive fall in manufacturing activity, consumption, and domestic and international travel, and yet according to the EIA and Carbon Monitor we only observed a 6-7% drop in total CO2 emissions in 2020 compared to 2019. Green policy measures must drive a post Covid-19 recovery and become a mainstay in major global economies. Was Covid-19 the catalyst needed to save the Paris agreement and thus stop global temperatures from rising above the 2 degree C threshold?
A Post Covid-19 World: “Build Back Better”
The U.S. will have a new president on Jan. 20 when Joe Biden is inaugurated. In campaigning for election, one of Mr. Biden’s main policies was the “Build Back Better” plan. Its aim is to tackle both the health and economic crises from the virus as well as the persistent climate crisis. While this is a very ambitious plan and will undo President Trump’s controversial decision to leave the Paris agreement altogether, is it enough to tackle emissions from the world second largest CO2 emitter?
The “Build Back Better” plan will unravel a lot of the work done by his predecessor, by reinstating many of the environmental standards that were rolled back under the Trump administration. Beyond this, the main body of the plan is $2 trillion of fiscal spending to create jobs and innovate in an environmentally considerate way. The main investment avenues will be infrastructure, the auto industry, transit, the power sector and buildings and housing. For this ambitious plan to be achievable, President-elect Biden will need full backing from the Senate. Currently the race for the Senate is incredibly tight. There are still two seats in Georgia that are undecided; according to polls one is likely to go the Republicans. If that were the case, Democrats will not have a majority in the Senate. This would make pushing through a massive green stimulus package almost impossible. Both seats will be settled on Jan. 6; we will have a clearer picture of the tools Joe Biden will have to work with then.
European Frontier
Even before Covid-19, Europe had been the front runner in battling climate change. The EU emissions trading system (EU ETS) has been the foundation of their policy to tackle it. The infamous cap and trade system has seen multiple phases. Each one has lowered the allowance of credits available to produce CO2. As the total credits available has fallen, the cost of emitting CO2 has increased, and thus total CO2 emissions have fallen in conjunction. Phase IV of the EU ETS is due to start in 2021; the two headline parts of phase IV are the decline in allowances at an annual rate of 2.2% compared to 1.74% previously. And the market stability reserve (MSR), the mechanism to reduce surplus allowances, will also be significantly enforced. As we indicated previously, CO2 emissions are highest from the generation of power than any other sector. As the power industry receives little to no free allowances in the EU ETS, the industry has had to adapt significantly. In 2006, 21% of power in the EU-28 was produced by coal fired power stations; in 2020 that proportion is merely 6%. What is more astounding is that just over 30% of EU-28 power was produced from renewable sources in 2020. If we add nuclear power to that, the proportion of power generation produced from zero carbon sources reaches 54%.

Earlier this year European governments approved a very ambitious climate deal built into their post-Covid-19 economic rescue plan and seven-year budget. In essence, within their total budget of €1.8 trillion, one-third (€600 billion) of this is reserved for climate action. This will allow European nations to develop further clean energy sources and promote energy efficiency. This is another landmark step towards a greener future, much like the United States’ “Building Back Better” plan and China’s commitments to be carbon neutral by 2060.
China’s Net Carbon Neutrality by 2060
In September 2020, China’s President Xi Jinping made the ambitious pledge to reach peak carbon emissions by 2030 and become carbon neutral by 2060. This will be no mean feat. To put this into context, the EU’s total emissions reached a peak 1990 and have since fallen by only 21%, with a target of 55% by 2030. If they were to achieve this, that would mean the EU would have removed more than half of their emissions in 40 years. China aims to remove all their carbon emissions in 30 years. China has not laid out the plans on how they will achieve this, more details are expected during their five-year plan early in 2021. Energy transition will be key for China to achieve carbon neutrality by 2060, in particular within the Chinese power industry. Currently ~60% of Chinese power is generated from coal; increasing the share of renewables (such as solar and wind energy) in power generation will be one of the many solutions. With more than 200 coal fired power stations under construction and many industries and jobs reliant on the fuel, switching will be difficult. As well as the energy transition, China will need to lean on energy conservation, afforestation, and new technologies such as carbon capture and storage (CCS) capacity to succeed in carbon neutrality by 2060.
Request more information about this topic.
Learn more about CRU’s services at www.crugroup.com


