Prices

December 3, 2020
HRC Futures: With S232 Tariff Resolution Put on Ice, HR Futures Rip Higher
Written by David Feldstein
Editor’s note: SMU Contributor David Feldstein is president of Rock Trading Advisors. David has over 20 years of trading experience in financial markets and has been active in the ferrous futures space for over eight years. You can learn more at www.thefeldstein.com or add him on twitter @TheFeldstein and on Instragram at #thefeldstein.
So far in 2021, there have been two corrections in CME hot rolled futures and both were related to comments regarding ending the Section 232 tariffs on steel and aluminum.
Rolling 2nd Month CME Hot Rolled Coil Future $/st
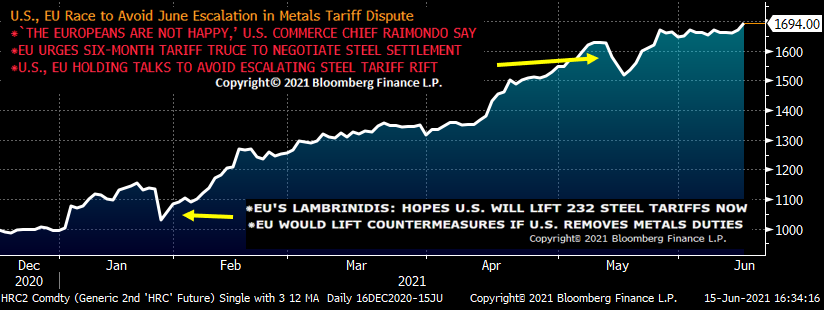
Heading into this week’s meetings with the G7 and EU, the threat that the Biden administration could agree to amend, suspend or remove the S232 tariffs got real.
On Sunday morning, President Biden made comments and then answered a few questions from the press. He thanked everyone and was walking away when a reporter asked him something about “European allies,” and Biden turned back to answer the question.
Reporter: “At the same time, you’ve kept in play some Trump-era steel and aluminum sanctions. And I wanted to ask you: When you’re having these conversations with European allies who are very concerned about these sanctions, how do you justify that? And what are your plans?”
Joe Biden: “It’s been 120 days. Give me a break. Need time.” Then he left.
On Tuesday, this headline crossed:
![]()
Trading got off to a slow start this week, but then buyers got aggressive today in the CME Midwest HRC futures. Perhaps it took some time for this news to sink in.
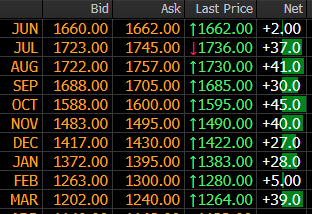
Since my last article two weeks ago, the market has continued to charge higher across the board with July trading to a new all-time high of $1,750 today.
CME Midwest HRC Futures Curve $/st
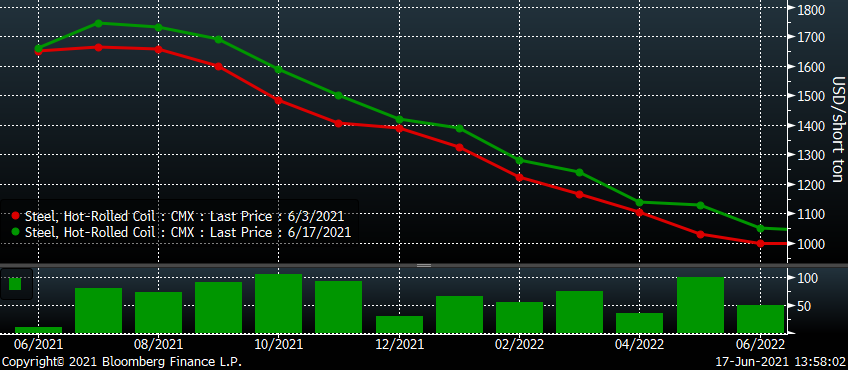
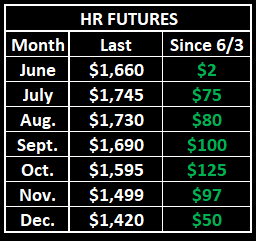
During that two-week period, the October future outgained all other months trading from $1,470 to $1,595, a gain of $125. September and November were in second and third place each gaining roughly $100. As discussed in the previous article, much of these gains is coming from forward buyers looking to lock in tons at a steep discount to spot. However, December has lagged noticeably, likely because of its extra month of duration. But as the discounts to spot seen in September, October and November shrink, buyers will be forced to choose between value and duration versus letting the buy float.
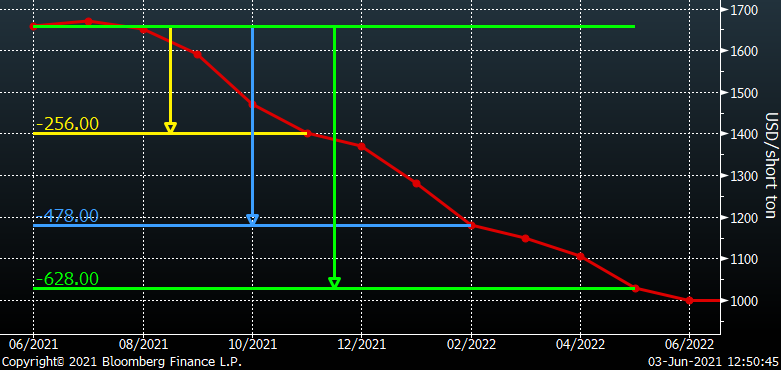
This first graph of the HRC curve was from my June 3 article and compares the June future to the November, February and May futures. That is 5, 8 and 11 months out.
CME Midwest HRC Futures Curve $/st
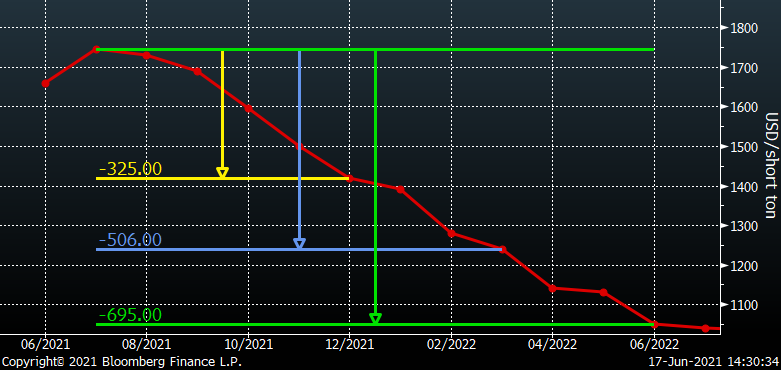
This graph shows the curve as of today and compares July, not June, to the December, March and June futures. Also 5, 8 and 11 months out. While October and November have gained relatively more than the front months, each of these spreads have expanded (because July is $100 above June) offering an even greater discount than they did two weeks ago. The curve has yet to flatten because the front end keeps marching higher!
CME Midwest HRC Futures Curve $/st
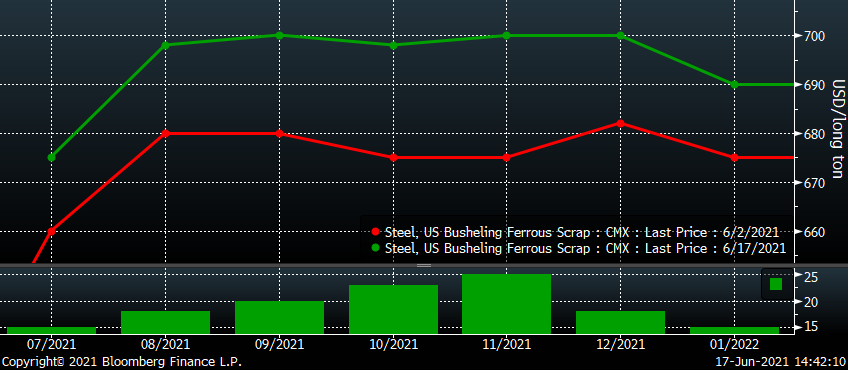
The June CME busheling future contract’s final settlement of $629 was up $65 MoM. The July future is already pricing in a further increase of $45 trading at $675, while the August future at $695 is pricing in another $20 increase. If August in fact settles at $695, it would be a $130 increase over the past three months.
July (white) & August (red) CME Busheling Futures $/gt
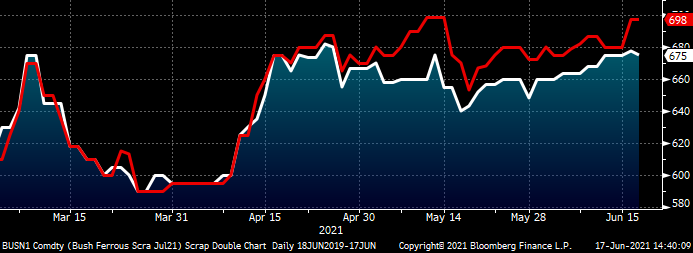
Over the past two weeks, busheling has gained $15-25/gt depending on where you are on this very flat curve.
CME Midwest HRC Futures Curve $/st
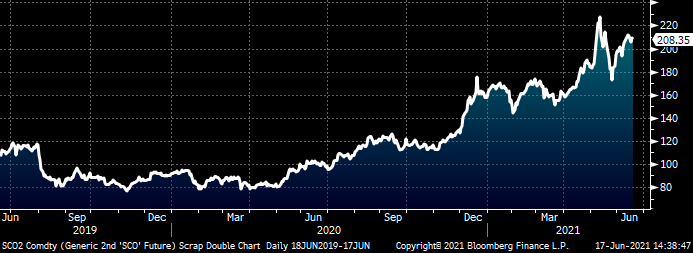
The July iron ore future closed today at $208.35/t and has shown tremendous resilience in the face of the Chinese government’s efforts to crush the rally in ore.
Rolling 2nd Month SGX Iron Ore Future $/mt
Disclaimer: The content of this article is for informational purposes only. The views in this article do not represent financial services or advice. Any opinion expressed by Feldstein should not be treated as a specific inducement to make a particular investment or follow a particular strategy, but only as an expression of his opinion. Views and forecasts expressed are as of date indicated, are subject to change without notice, may not come to be and do not represent a recommendation or offer of any particular security, strategy or investment. Strategies mentioned may not be suitable for you. You must make an independent decision regarding investments or strategies mentioned in this article. It is recommended you consider your own particular circumstances and seek the advice from a financial professional before taking action in financial markets.


