Prices

December 3, 2020
HRC Futures: March HR Trades Above $1,200; S232 Drumbeat Gets Louder
Written by David Feldstein
Editor’s note: SMU Contributor David Feldstein is president of Rock Trading Advisors. David has over 20 years of trading experience in financial markets and has been active in the ferrous futures space for over eight years. You can learn more at www.thefeldstein.com or add him on twitter @TheFeldstein and on Instragram at #thefeldstein.
The CME March Midwest HRC future traded as high as $1,208, a gain of $87 versus just last Friday’s close.
March CME Hot Rolled Coil Future $/st

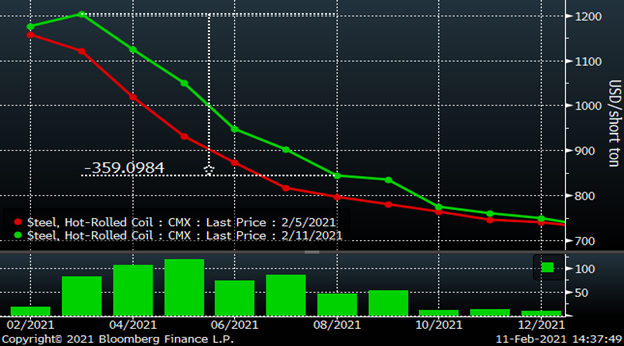
The HRC futures curve continues to steepen with gains in April ($107) and May ($119) exceeding those in March. As of Tuesday afternoon, the August future is trading at a $360 discount to the March future.
CME Hot Rolled Coil Futures Curve $/st

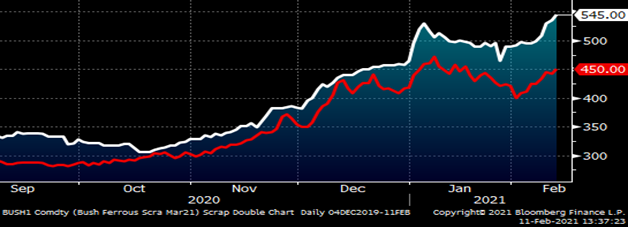
After peaking in early January, Turkish scrap and obsolete grades had been trading sharply lower. The red line in the chart below is of the March LME Turkish scrap future, which traded to an intraday low of $393 on Feb. 1 and has since rallied back, settling today at $450. On Wednesday, the February CME busheling future contract settled at $492.29, essentially flat m/m. Over the past four trading days, the March busheling future has rallied sharply, trading as high as $545 not only for March, but also April and May. With the coming addition of multiple, brand new EAFs coming online throughout 2021, some folks believe busheling will remain relatively strong due to the increased demand. Further fueling the bullish story in busheling has been the chip shortage faced by the auto industry as well as other manufacturers, which is expected to result in less busheling production. This could further tighten the market for busheling.
March CME Busheling Future $/lt (white) & LME Turkish Scrap Future $/mt (red)

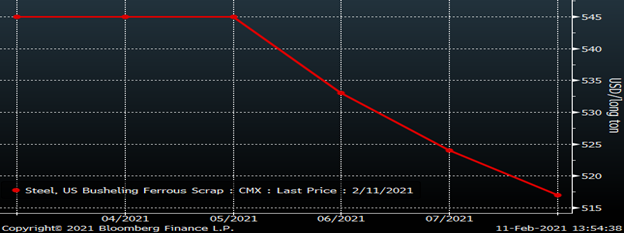
This chart shows the sharply backwardated CME busheling futures curve.
CME Busheling Futures Curve $/lt

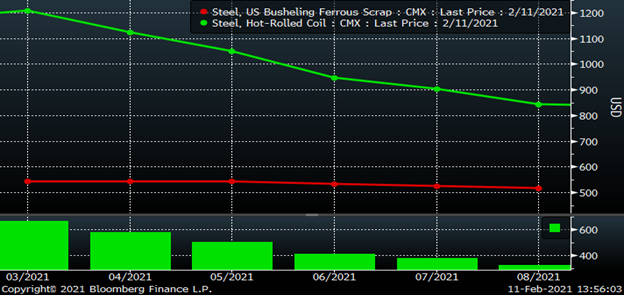
This chart shows both the CME HRC and busheling futures curves with the difference or “metal spread” shown in the panel below. Typically, this spread fluctuates in the $200 to $300 range, but has blown through the previous 2018 high of $520, currently at $650 and remaining above $400 through May. This is also a proxy for profits earned by the domestic steel mills, which has implications on a number of fronts.
CME HRC & Busheling Metal Spread

According to the January U.S. employment report, manufacturing payrolls declined m/m for the first time since last April. On Wednesday, Feb. 10, the Coalition of American Metal Manufacturers and Users sent President Biden a letter asking that he end the Section 232 steel and aluminum tariffs immediately.
“Thousands of manufacturers cannot procure the necessary raw materials in the U.S. in sufficient and reasonably available commercial quantities…leading American companies to rely on imports. By taking action to terminate the Trump tariffs, your administration can prevent U.S. manufacturers from shutting down production lines, laying off workers and potentially even closing their doors.” The coalition said it represents more than 30,000 companies and more than 1 million workers.
U.S. Employees Nonfarm Payroll NSA – Manufacturing

It can be assumed that domestic flat rolled mills are and have been running their furnaces hard for months and with a massive backlog will continue to do so in the months ahead. This increases the risk of a breakdown or accident. If that were to happen, then the already tight market would be thrown into further shortage and flat rolled prices would explode to who knows what levels. There is a saying that “commodities crash up” and that is usually the result of a shortage of some kind. In the steel business, the shortage is typically caused by an unplanned supply disruption(s).
However, the supply disruption is an asymmetric risk in that there isn’t a similar event inherent to the industry that would lead to an immediate excess of supply that would cause the price to crash down. Of course, there are highly improbable exceptions and one-off events as we learned last year when manufacturing plants were abruptly shut down in response to the COVID outbreak.
Nevertheless, right now there is a potential event lurking that could create a flood of supply and cause an immediate and sharp price correction—the reversal of the Section 232 tariffs by the Biden administration.
On Jan. 27, the European Union Ambassador to the United States Stavros Lambrinidis told an online event hosted by the U.S. Chamber of Commerce that he hopes the U.S. will lift the Section 232 tariffs immediately and in return the EU would lift its retaliatory tariffs on U.S. imports. I watched the headline about Lambrinidis’ comment cross the tape and then watched the hot rolled futures plummet $80-90/st in a couple of hours.
March CME Hot Rolled Coil Future $/st

While the liquidity in the CME HR futures market has improved incredibly over the last few years, it remains like any other financial market in that an unexpected event can trigger a dramatic imbalance between buyers and sellers causing an extreme price move. What happened in the HRC futures market on Jan. 27 was buyers stepped away, cancelling their bids while the sellers scrambled to sell whatever they could. This gave us a preview of what could happen. While I have my thoughts and opinions about what the Biden administration will do with the Section 232 tariffs, these thoughts and opinions are simply that. However, I can say unequivocally that if the Biden administration removes the tariffs, whether globally or just for members of NATO, the HRC futures market will see a crash that makes the late morning of Jan. 27 look like a walk in the park.
Disclaimer: The content of this article is for informational purposes only. The views in this article do not represent financial services or advice. Any opinion expressed by Mr. Feldstein should not be treated as a specific inducement to make a particular investment or follow a particular strategy, but only as an expression of his opinion. Views and forecasts expressed are as of date indicated, are subject to change without notice, may not come to be and do not represent a recommendation or offer of any particular security, strategy or investment. Strategies mentioned may not be suitable for you. You must make an independent decision regarding investments or strategies mentioned in this article. It is recommended you consider your own particular circumstances and seek the advice from a financial professional before taking action in financial markets.


