Prices

December 3, 2020
HRC Futures: $1,334—Another New All-Time High
Written by David Feldstein
Editor’s note: SMU Contributor David Feldstein is president of Rock Trading Advisors. David has over 20 years of trading experience in financial markets and has been active in the ferrous futures space for over eight years. You can learn more at www.thefeldstein.com or add him on twitter @TheFeldstein and on Instragram at #thefeldstein.
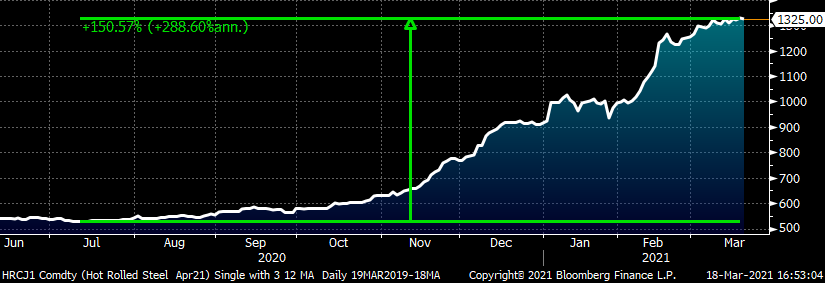
February’s service center data showing a decline in daily shipments and mill receipts helps to explain how last month’s winter storm that blanketed most of the country dealt yet another blow to the steel supply chain’s seven-month odyssey to overcome the steel shortage. February’s data also showed a resurgence in new orders to the mills for flat rolled in response to outages at a number of different steel mills. This latest surge sent the domestic mills’ backlog to a new all-time high. With daily hot rolled indices clearing $1,300, the April CME HRC future also traded to a new all-time intraday high of $1,334. Since last July, the April HRC future has increased by over 150%.
April CME Hot Rolled Coil Future $/st
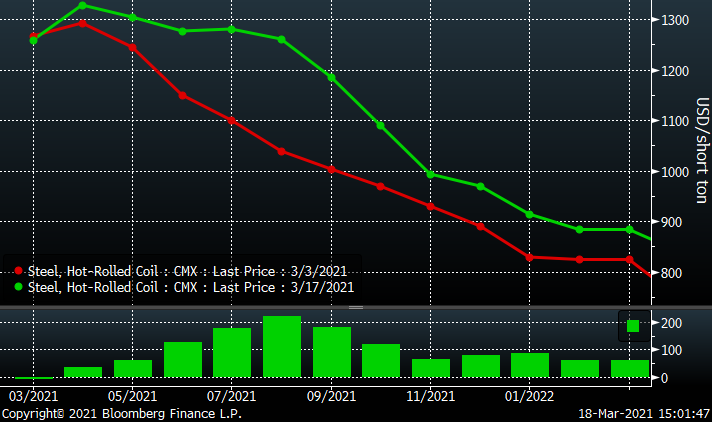
This chart shows the CME Midwest HR futures curve through Q1 2022 as of Wednesday, March 3, and Wednesday, March 17. As you can see, the months with the greatest gains since March 3 are in the third quarter with August gaining over $200/st. The interest in these months could be in response to expectations that prices will stay elevated for longer due to the winter storm disruptions. However, it could also be a response to the lack of sell-side liquidity and buyers looking to lock in tons wherever they can find a discount to the spot market.
Regardless of the reasons why, the curve has “flattened” relative to the steep backwardation of just two weeks ago. If the primary reasons for the moves in July, August and September over the past two weeks are forward buyers looking for value, then September, October and November look to be the next up with July and August quickly closing in on $1,300. In fact, there has been a pick-up in volume in these months over the past few days.
CME Midwest HRC Futures Curve $/st
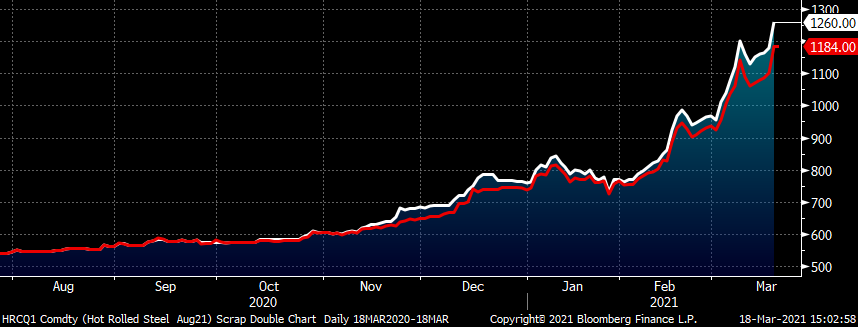
August (white) and September (red) CME Hot Rolled Coil Futures $/st
After peaking early last week, the April CME busheling future has quickly fallen back to $590, indicating about a $40 gain over March.
April CME Busheling Future $/gt

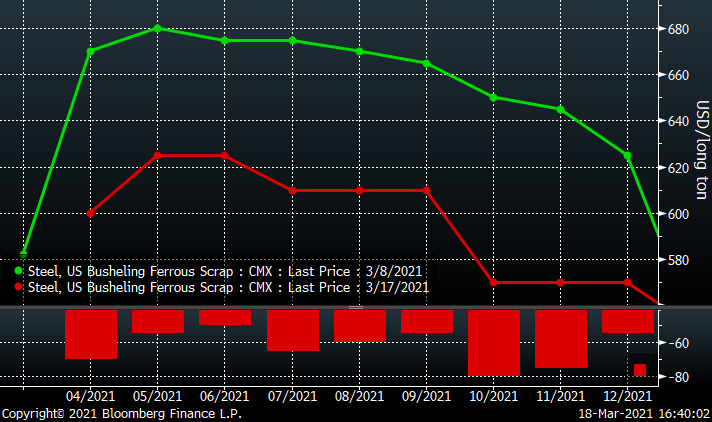
In my last SMU article on March 4, I discussed the heightened illiquidity in both the hot rolled and busheling futures markets, but that it was much more acute in busheling. The busheling future’s curve looked to be consistently bid up on light volume in what appeared to be a consistent attempt to influence the curves’ daily settlement prices higher. Initially it was in the front of the curve, then over the last two weeks of February and the first week of March the buyer pushed the back months of the curve up to and above $650/lt. This was very curious and had many in the scrap world baffled.
CME Busheling Futures Curve $/lt
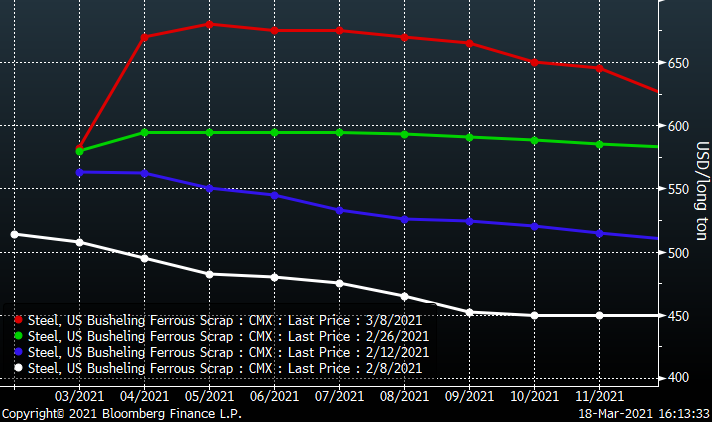
It was even more curious to watch the flattened busheling curve jump from $590-$600 on Feb. 26 to the $650-$670 range in that first week of March. And even more curious considering Turkish scrap was falling ($20-$30) while busheling was rocketing higher.
LME Turkish Scrap Future $/mt

What is the motive for doing this? It could be that this particular market participant was simply putting on the metal spread, which is where one buys busheling futures and sells hot rolled futures. Considering how quickly hot rolled was moving higher during this time, perhaps the price of busheling was irrelevant. However, that doesn’t explain the price action at the market’s close where a buyer would pay $5 to $15 higher for a minimum number of tons across a number of months on the curve.
That type of behavior is most likely with the objective to get a higher mark-to-market P&L on his long busheling position. The higher mark-to-market could offset unrealized losses on a worsening short position in hot rolled or iron ore futures perhaps. All I can tell you is that on the night of Tuesday, March 8, in Asia, the April SGX iron future had closed the trading session down $10. If our friend was in fact seeing mounting losses being short iron ore futures, he would have seen a sharp reversal of fortunes from the $10 collapse, perhaps realizing gains or lightening up the position during the session.
April SGX Iron Ore Future $/mt

On the morning of March 8 in the CME busheling futures market, 500 t/m of Q2 traded at $660, 1,000 t/m of Q2 at $650, 500 July at $640 and 1k Oct. at 640.
“And like that, poof he’s gone. Underground, he becomes a myth. A spooky story criminals tell their kids at night. Rat on your pop and Keyser Soze will get you.”
So, why go to so much trouble hypothesizing on all of this? Simply to make the point that the futures market is the tail wagging the dog (physical market). And busheling is the tail wagging the hot rolled futures. If you saw the busheling futures curve trade above $650 out through October in early March and thought it meant something, and if you’ve watched the busheling futures curve drop $60 to $80 per ton since, know that it meant nothing fundamentally, but rather was a function of the busheling market’s illiquidity and current market conditions leaving this illiquidity exposed to be easily manipulated for a short period of time.
CME Busheling Futures Curve $/lt
Disclaimer: The content of this article is for informational purposes only. The views in this article do not represent financial services or advice. Any opinion expressed by Mr. Feldstein should not be treated as a specific inducement to make a particular investment or follow a particular strategy, but only as an expression of his opinion. Views and forecasts expressed are as of date indicated, are subject to change without notice, may not come to be and do not represent a recommendation or offer of any particular security, strategy or investment. Strategies mentioned may not be suitable for you. You must make an independent decision regarding investments or strategies mentioned in this article. It is recommended you consider your own particular circumstances and seek the advice from a financial professional before taking action in financial markets.


