Government/Policy

October 25, 2020
Leibowitz: Measuring the Economic Performance of Presidents Over the Last 100 Years
Written by Lewis Leibowitz
Trade attorney and Steel Market Update contributor Lewis Leibowitz offers the following update on events in Washington:
This campaign, like all others, is about many issues. The economy, though, is clearly the most powerful message of the Trump campaign. Over the last century or so, where does the Trump economy rank? There are many different measures one could use to compare the economic record of past presidents. I’ll use trade, the stock market, GDP growth and unemployment. I invite readers to suggest their own measurements.
This being an international trade column, let’s start by measuring the growth in international trade and comparing it to other metrics.
International Trade
The two metrics I would use to compare administrations are import growth and export growth. The trade balance (surplus from the 1920s to the early 1970s, deficits since then) shows global trends evolving from positive trade balances during and after World War II, to negative balances dating from the early 1970s due initially to oil price increases resulting from to the Arab Oil Embargo and its aftermath, and evolving to the growth of imports from China and other emerging markets since the 1990s. That evolution has more to do with global historical trends than to the policies of different U.S. administrations.
International Trade by Administration (Clinton to Trump)
Export growth: Here is the picture based on Census statistics going back to 1994, the earliest date where numbers are conveniently available. The figures are the annual average value of exports and imports of goods (not services) by each administration (measured in constant 2012 dollars). Here are the annual averages of U.S. exports for each administration:

Import growth: On the same basis, the annual average figures for imports of goods are:

The import and export figures strongly indicate that all four recent presidents operated in a world where the value of U.S. exports was increasing more slowly than the value of imports. The policies of each administration differed, but did not significantly alter the trends. Whoever wins in November, those trends are likely to continue, with perhaps some interruption due to the pandemic.
Economic Performance
There are, of course, other important measures of economic health that are relevant to voters. Let’s look at three: the stock market, changes in the output of the American economy (measured most comprehensively by gross domestic product or GDP), and the unemployment rate.
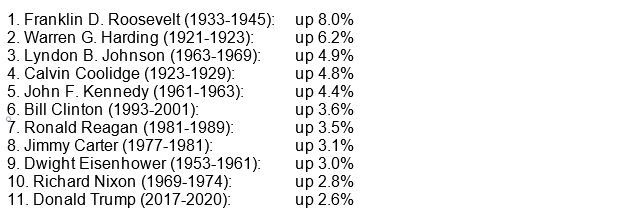
Stock Market: President Trump has consistently pointed to the stock market as a gauge that works in his favor. As a surrogate for the stock market, the most popular barometer of the market is the Dow Jones Industrial Average (DJIA). David von Drehle, a syndicated columnist for the Washington Post, reported on the administrations of the last 100 years and ranked them by the changes in the DJIA during each presidential term. By this measure, over the first 45 months of each administration since the 1920s, here is the ranking (according to von Drehle):

The performance of the stock market during the Trump administration is not the best in history. Of 17 presidents since 1921, the Trump presidency ranked sixth.
GDP growth: A popular measure of a president’s economic performance is the change in the U.S. gross output of goods and services (GDP). Measuring average annual positive growth in “real” GDP (measured in constant dollars) by presidential administration since 1920, we get this picture (courtesy of fortune.com):

The Trump presidency ranks 11th of 17 presidents in GDP growth over the last 100 years. Four administrations recorded a lower growth rate than the Trump administration over that period: (George H.W. Bush (1989-1993), 2.4%; and Harry S Truman (1945-1953), George W. Bush (2001-2009) and Barack Obama (2009-2017), 1.7% each).
Only one administration recorded an annual average decline in GDP over the last 100 years—that of Herbert Hoover (1929-1933), a 4.5% average annual decline.
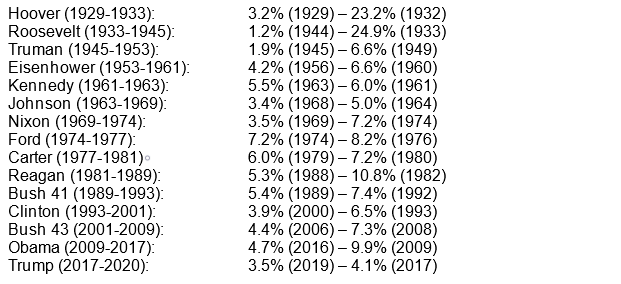
Unemployment Rate: While the average unemployment rate over the course of an administration is not reported very often, we have statistics about unemployment going back to the 1920s. Going back to 1929, the administrations had the following ranges of unemployment, based on the economic conditions faced. The unemployment rates are yearly averages, with the lowest rate on the left and the highest on the right for each administration. The high and low rates are identified by year.

As a general rule, presidents who ran for re-election in a year with the highest unemployment rate lost: Hoover in 1932, Ford in 1976, Carter in 1980 and Bush 41 in 1992. For the 15 administrations since 1929, the Trump administration ranks fifth for the low annual unemployment rate, behind Hoover, Roosevelt, Truman and Johnson.
This year, the September 2020 national unemployment rate was 7.9% (down from a monthly high of 14.7% in April), but the annual figure for 2020 is not yet known. We don’t know yet how the current unemployment rate will factor into this year’s election; but based on past performance, it is likely to hurt the president’s chances for reelection.
Conclusion
History can be a good guide, but of course it’s not perfect. Each election had its unique issues and its unique electorate. I’m not in the business of predicting election outcomes, although it’s fun to do so.
The economy is an important issue in every presidential election. In our system, at least up to now, the economy rises or falls on the behavior of millions of businesses, not government action. When emergencies arise, the government can make a big difference, as happened earlier this year when trillions of dollars in relief were handed out to struggling individuals and businesses. Even now, the Federal Reserve is pumping more money into the economy by keeping interest rates at historic lows. But government intervention in the economy can have its costs, both in money and in signals to private industry.
Based on history, the Trump administration ranks fifth, sixth and eleventh on stock market performance, GDP growth and unemployment, respectively. That is not a bad record, but it is not the greatest of all time.
On trade, promises to reduce the trade deficits and bring manufacturing back to the United States have not yet been kept.
Everyone vote safely.
The Law Office of Lewis E. Leibowitz
1400 16th Street, N.W.
Suite 350
Washington, D.C. 20036
Phone: (202) 776-1142
Fax: (202) 861-2924
Cell: (202) 250-1551


