Product

October 15, 2020
HRC & Busheling Futures Power Higher, But Something's Gotta Give
Written by David Feldstein
Editor’s note: SMU Contributor David Feldstein is president of Rock Trading Advisors. David has over 20 years of trading experience in financial markets and has been active in the ferrous futures space for over eight years. You can learn more at www.thefeldstein.com or add him on twitter @TheFeldstein and on Instragram at #thefeldstein.
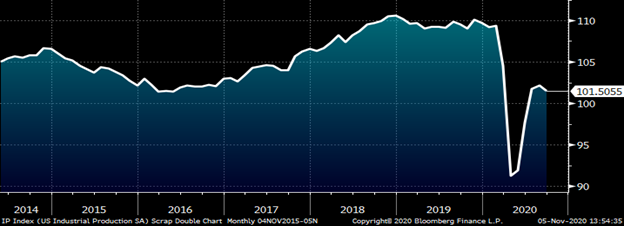
Q3 U.S. GDP grew at an annualized quarter-over-quarter rate of 33.1% and was a combination of 1) pent-up Q2 production, 2) government stimulus and 3) Q3 production times some coefficient less than one due to the pandemic-induced recession. The industrial production index below illustrates the sharp Q2 drop followed by this Q3 recovery, which brings us around halfway back. Most of the pent-up Q2 production has dissipated and there is no additional government stimulus for now. Without these boosters, expect flattish trend growth moving forward.
U.S. Industrial Production Index
Earlier today, Federal Reserve Chairman generated this headline: POWELL: PACE OF IMPROVEMENT IN ECONOMY HAS MODERATED.
Steel and manufacturing in aggregate also experienced a sharp drop in demand in Q2 followed by a breakneck snap-back that started in August and has carried us into November. Back in August, demand shot ahead of the temporarily decreased domestic steel supply/capacity. This resulted in two straight months of almost $100/t sequential increases in the hot rolled index with further increases already priced in for November.
Rolling 2nd Month CME Hot Rolled Coil Future $/st
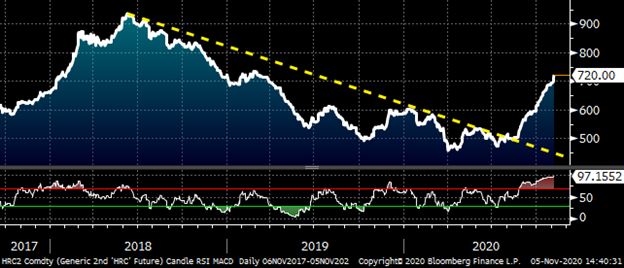
An influx of new orders to service centers and domestic mills in September and October created an explosion in apparent demand. Can this rate of new order entry be sustained moving forward despite the slowing economic pace, building domestic supply and increasing attractiveness of tariff adjusted imports?
Based on the shape of the CME Midwest HRC futures’ curve, market participants are expecting the price to fall dramatically in early 2021. However, since mid-October, the downward sloping curve has seen a healthy increase with the December future trading as high as $720 today for a $60 gain, while the January 2021 future gained $70/t.
CME Hot Rolled Coil Futures’ Curve $/st
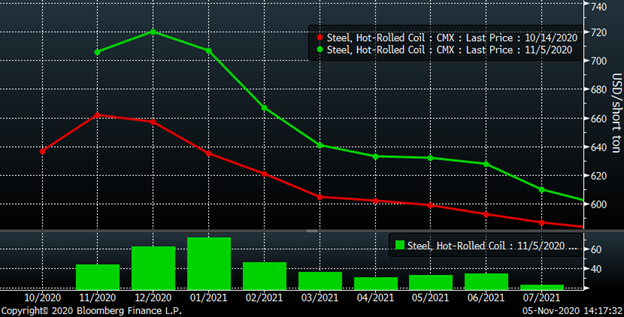
Again, can mills sustain new orders at a rate to maintain current lead times? If not, then the fall in both lead time and price could be sharp and fast. Three interesting components contributed to the recent spike in apparent demand: restocking, OEM inventory adjustment and speculation. While recent flat rolled inventory data points to the lowest levels in a decade, the arrival of the tons ordered from the mills over these past two months will produce a very different inventory picture in the seasonally weak months ahead. The upward inventory adjustment made by manufacturers in response to the extended lead times means a readjustment lower if lead times fall, i.e. halting new orders. Lastly, expectations for further price increases and extended lead times fueled speculative buying by both distributors and end-users. At $700+, any speculative demand is all but over.
If apparent demand falters and lead times slide, mills will have to compete with the restocked service centers in addition to Big River 2 and other suppliers. In conclusion, the outcome of the burst seen in the past few months is a heightened competitive landscape for domestic mills moving forward.
In addition to these fundamentals, there are a number of important statistics that do not bode well for the continuation of a hot rolled rally that has seen a $98/t MoM increase in September followed by a $96/t MoM increase in October.
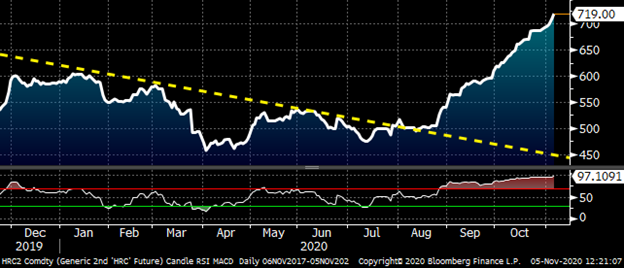
In the lower panel of the chart of the rolling 2nd month CME HRC future below is the technical indicator, the “relative strength indicator,” or RSI. This measures the velocity of the move in a security. If the RSI is above 75, it indicates the product is overbought. If it is below 25, it is oversold. Notice HRC2 has been in overbought territory since late August without slowing. In fact, the RSI continues to make higher highs and is at 97 today. The RSI only goes to 100 folks. Even the rally in 2018 (see above) had a period where prices relented and the RSI retreated from overbought territory. Something has to give.
Rolling 2nd Month CME Hot Rolled Coil Future $/st
The current “metal spread” or difference between the CME Midwest HRC and No. 1 busheling futures continues to be at extremely elevated levels with the November spread at $400, December at $390 and January at $375. EAFs have a fantastic opportunity to produce flat out.
Rolling 2nd & 3rd Month CME Midwest HRC Minus Busheling Spread
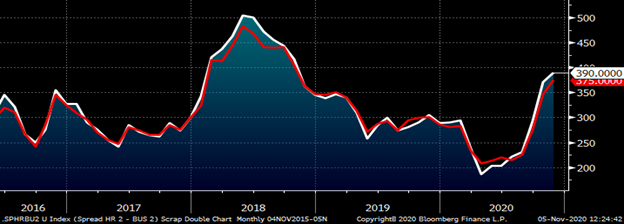
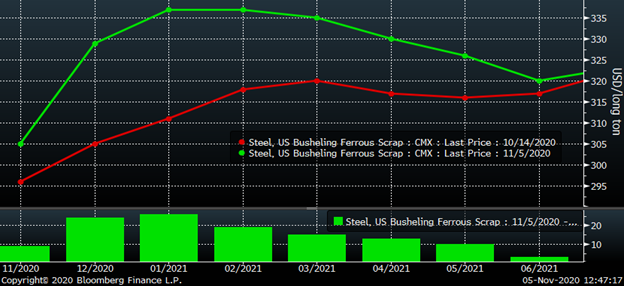
Again, something has to give. Either HR has to come down or busheling has to rally in order to bring this relationship back in line. After weeks with little buy side interest, the busheling futures finally got busy last week gaining $20-25 in the months of December, January and February, with the last two trading smalls above $340/lt yesterday.
CME Busheling Futures Curve $/st
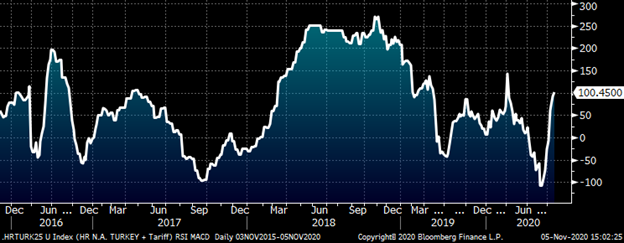
Assuming that the pace of economic growth is losing some momentum and domestic steel supply is increasing, then all that is left of these three issues is imports. The tariff adjusted spread between Midwest and Turkish hot rolled has climbed above $100/st. There are some other places with tariff adjusted spreads around the $100 mark while Europe’s tariff adjusted spread is approximately $50 vs. $700 HR. How many tons will go the import route? Further, how many tons will domestics not be exporting? How much pressure does the import alternative put on hot rolled going much above $700/st?
North American – Turkish HRC Spread $/st 30% Tariff Included
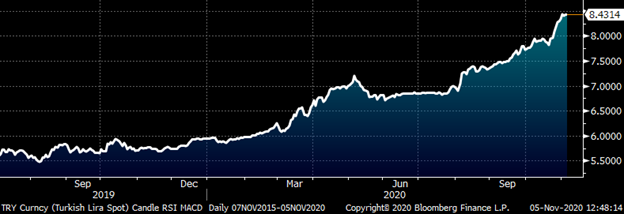
What’s more, not only is Turkey the only country other than China to increase their YTD steel production, but their currency has devalued significantly over the past month. This chart shows how many lira per U.S. dollar.
Turkish Lira
This table shows that the currency devaluation of the lira in just the last month translates into an additional $47/t when converting $600 from dollars into lira further widening the differential? Further, it increases the price of U.S. export scrap by approximately $23.

Point being, as this rally gets extended both in price and time, alternative supply solutions will provide serious frictions in the coming months.
Then there is the COVID pandemic, which has shifted into a very different phase. There have been significantly more infections in this new phase resulting in new daily case totals doubling, tripling or more relative to the initial wave or, in the case of the U.S., the second wave. One troubling difference this time is this wave looks poised to blanket the country simultaneously, as opposed to the first two more regionalized waves.
New Daily CoVID Cases USA & Canada
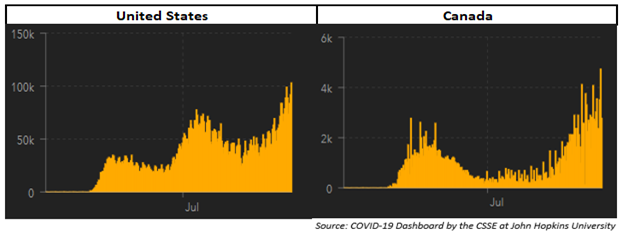
According to the CDC COVID Data Tracker, there were 106,537 new cases on Wednesday. I have been sounding the alarm this was coming for almost two months and now it is here. The pattern has been extremely reliable across Europe into Russia, Canada and even now it is starting to take hold in Turkey. These Midwest states are seeing exponential growth, growth that will continue unabated until restrictions are put in place. Further, California, Texas and Florida have yet to experience this growth. When they do, new daily cases will explode into the 150k-200k/day. Regardless of the intensity of restrictions put in place, this will dramatically weigh on the U.S. economy.
New Daily CoVID Cases
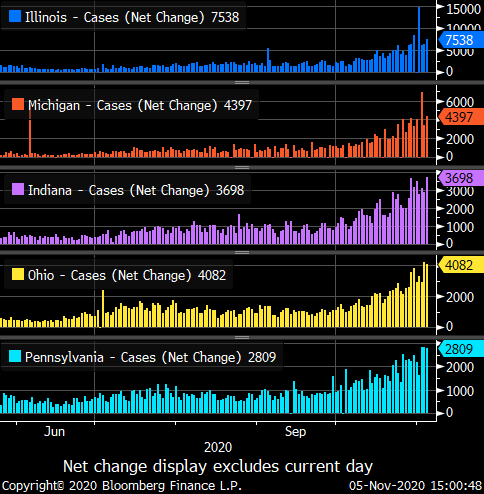
Europe’s outbreak over September and October has provided a vision into the future of the United States’ current outbreak. Last week, Goldman Sachs cut their economic forecasts for the Eurozone Q4 GDP to -2.3% from +2.2% and United Kingdom to -2.4% from +3.6%. Expect at least a similar outcome in the U.S.
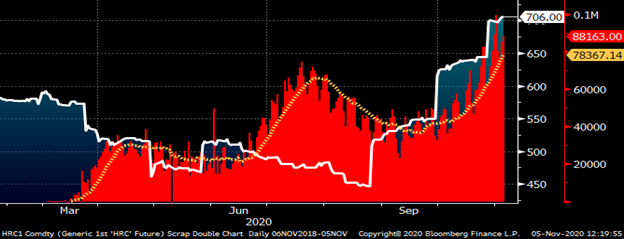
Considering everything discussed above, now add the COVID outbreak as another grim statistic. This chart overlays new daily cases on top of the front month Midwest CME HRC future. Will Midwest hot rolled follow the same pattern it did during the first two waves of COVID that started in March and June? Or is this time different?
Front Month CME Midwest HRC Future & New Daily CoVID Cases
Revisiting the (service center P.O.V.) hedging performance table discussed in previous articles, the hedging gains from these super-basic strategies have been wiped out, turning negative for the year. So, what happened? The strategy provided much needed cashflows during the worst months from April to August. Since then, inventory values have increased dramatically, sales and shipments have exploded higher. Hedging is simply a trade-off that stabilized your business and the strategy was a reliable and predictable one.
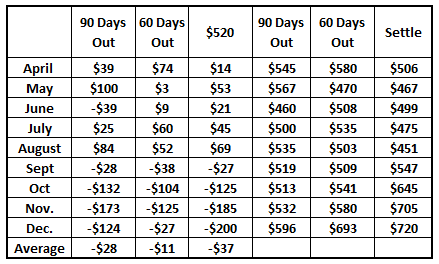
Looking into 2021, the steeply backwardated forward curve is a treacherous one to hedge with. The downward sloping curve presents many challenges for hedging downside risk as opposed to an upward sloping curve. You wouldn’t climb Mount Everest without a Sherpa, so if you are interested in implementing a hedging strategy, seek professional help. This is not one of those do-it-yourself projects like so many others have been embracing during the pandemic.
Disclaimer: The content of this article is for informational purposes only. The views in this article do not represent financial services or advice. Any opinion expressed by Mr. Feldstein should not be treated as a specific inducement to make a particular investment or follow a particular strategy, but only as an expression of his opinion. Views and forecasts expressed are as of date indicated, are subject to change without notice, may not come to be and do not represent a recommendation or offer of any particular security, strategy or investment. Strategies mentioned may not be suitable for you. You must make an independent decision regarding investments or strategies mentioned in this article. It is recommended you consider your own particular circumstances and seek the advice from a financial professional before taking action in financial markets.


