Prices

October 11, 2020
HRC Prices: Is It Really Boom Or Bust?
Written by David Schollaert
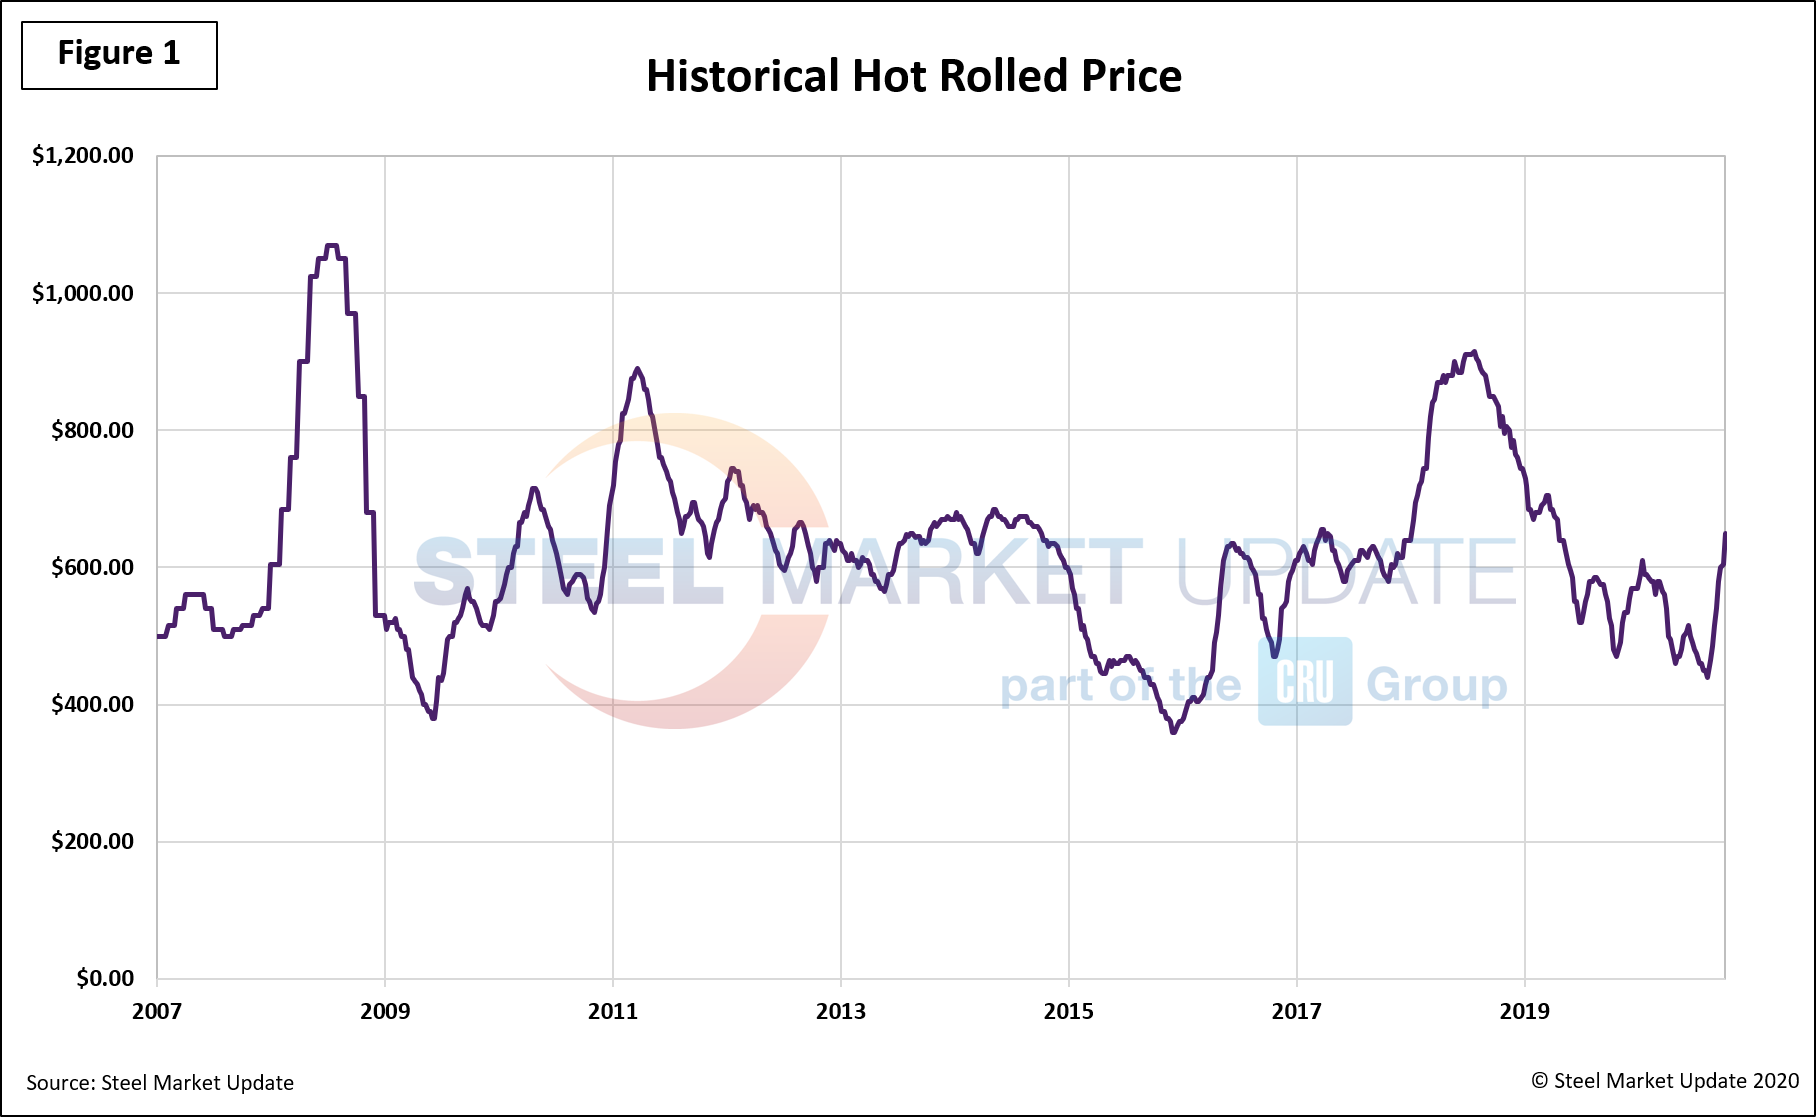
The following report was done by David Schollaert, the new analyst at Steel Market Update. He was asked to take a look at past market trends and to lay out scenarios for future trends. Obviously, there are black swan events (such as the Section 232 tariffs) which can push a market in one direction much more dramatically than anticipated. We are seeing supply side issues that are pushing the markets higher, but supply is expected to balance out in the months ahead. The question for steel buyers right now is how much higher prices can go, and will the peak lead to stability (with minor gyrations), a gradual decline in prices or a bust (Steelmageddon) where prices drop sharply like they did in 2008/2009 (see Figure 1 below)? Here is David’s analysis:
The current price rally has brought about much conversation of boom and bust cycles in HRC prices. Overall market sentiment seems to agree that the run-up in price will soon come to an end, but the question is whether the turn will be sharp or will there be a steady correction? Others caution there will likely be a plateau before prices edge back down. With varying degrees of sentiment and opinion, SMU has taken a closer look at historical HRC pricing data (Figure 1) to see if there are any patterns or tell-tale signs to the prices’ ebb-and-flow.

Despite a few notable peaks and valleys, the market also has shown noticeable periods of stability. Major price variations are attributable to external forces and not strictly driven by supply and demand fundamentals. Contributing to foremost shifts were the market collapse during the 2008 recession; crude oil price downfall in 2014-2015; antidumping and countervailing duties, as well as tariffs. Prices were pushed higher in 2018 in anticipation of the Section 232 tariffs taking effect. And most recently, of course, the COVID pandemic caused a sharp downturn, followed by a surprisingly strong recovery, in steel demand and prices.
The crude oil price slumped in 2014-2015 due largely to an oversupplied market. OPEC members consistently exceeded their production and China experienced a marked slowdown in economic growth. This resulted in slumping HRC prices, with prices hitting a 17-year low of $360 per ton. A 23-week price correction ensued to close out 2015, followed by an 86-week plateau, before prices rallied in response to antidumping and countervailing duty cases.
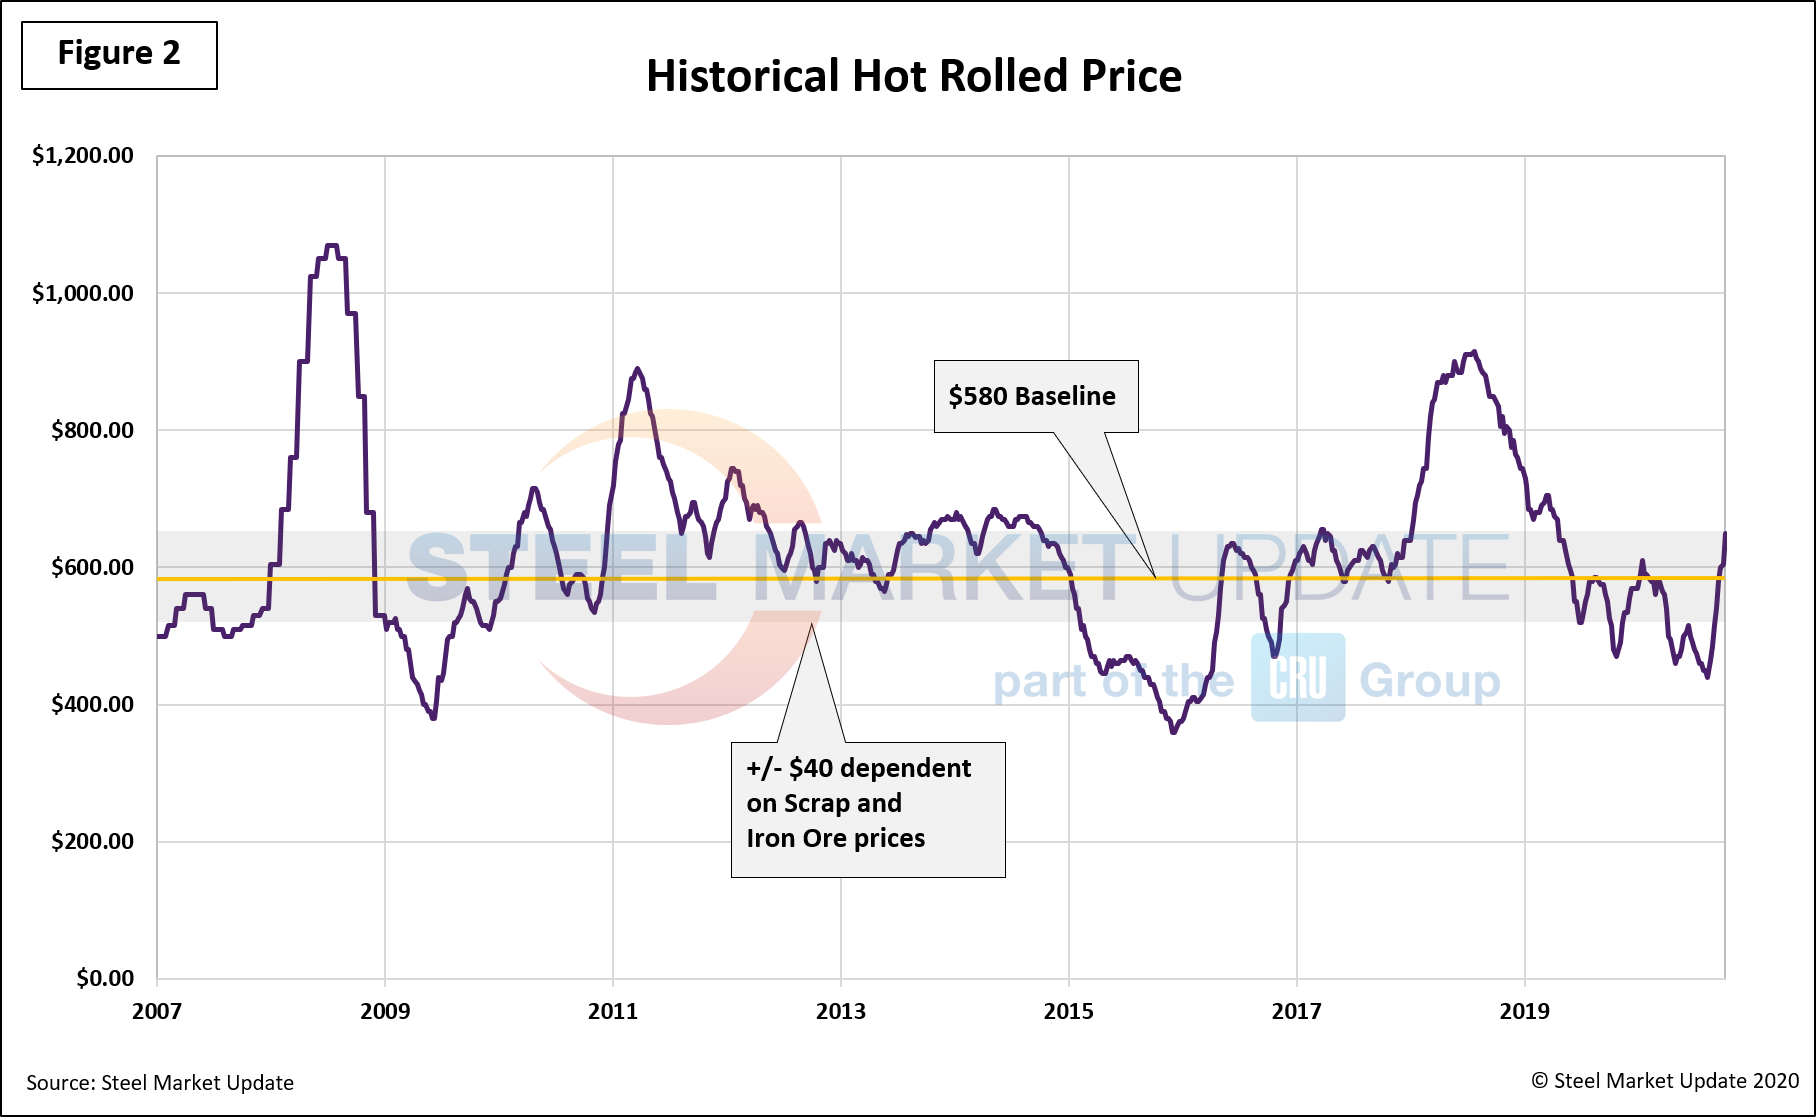
Figure 2 highlights another noteworthy case study. The average baseline of $580 per ton typically indicates a stable yet profitable overall market range. A sway from $540-620 per ton can still yield profits across steel sectors; however, largely dependent on scrap and iron ore margins. When prices dip below said range, steel mills lose profitability, and when prices surpass the top end, service centers and manufacturing companies are squeezed.

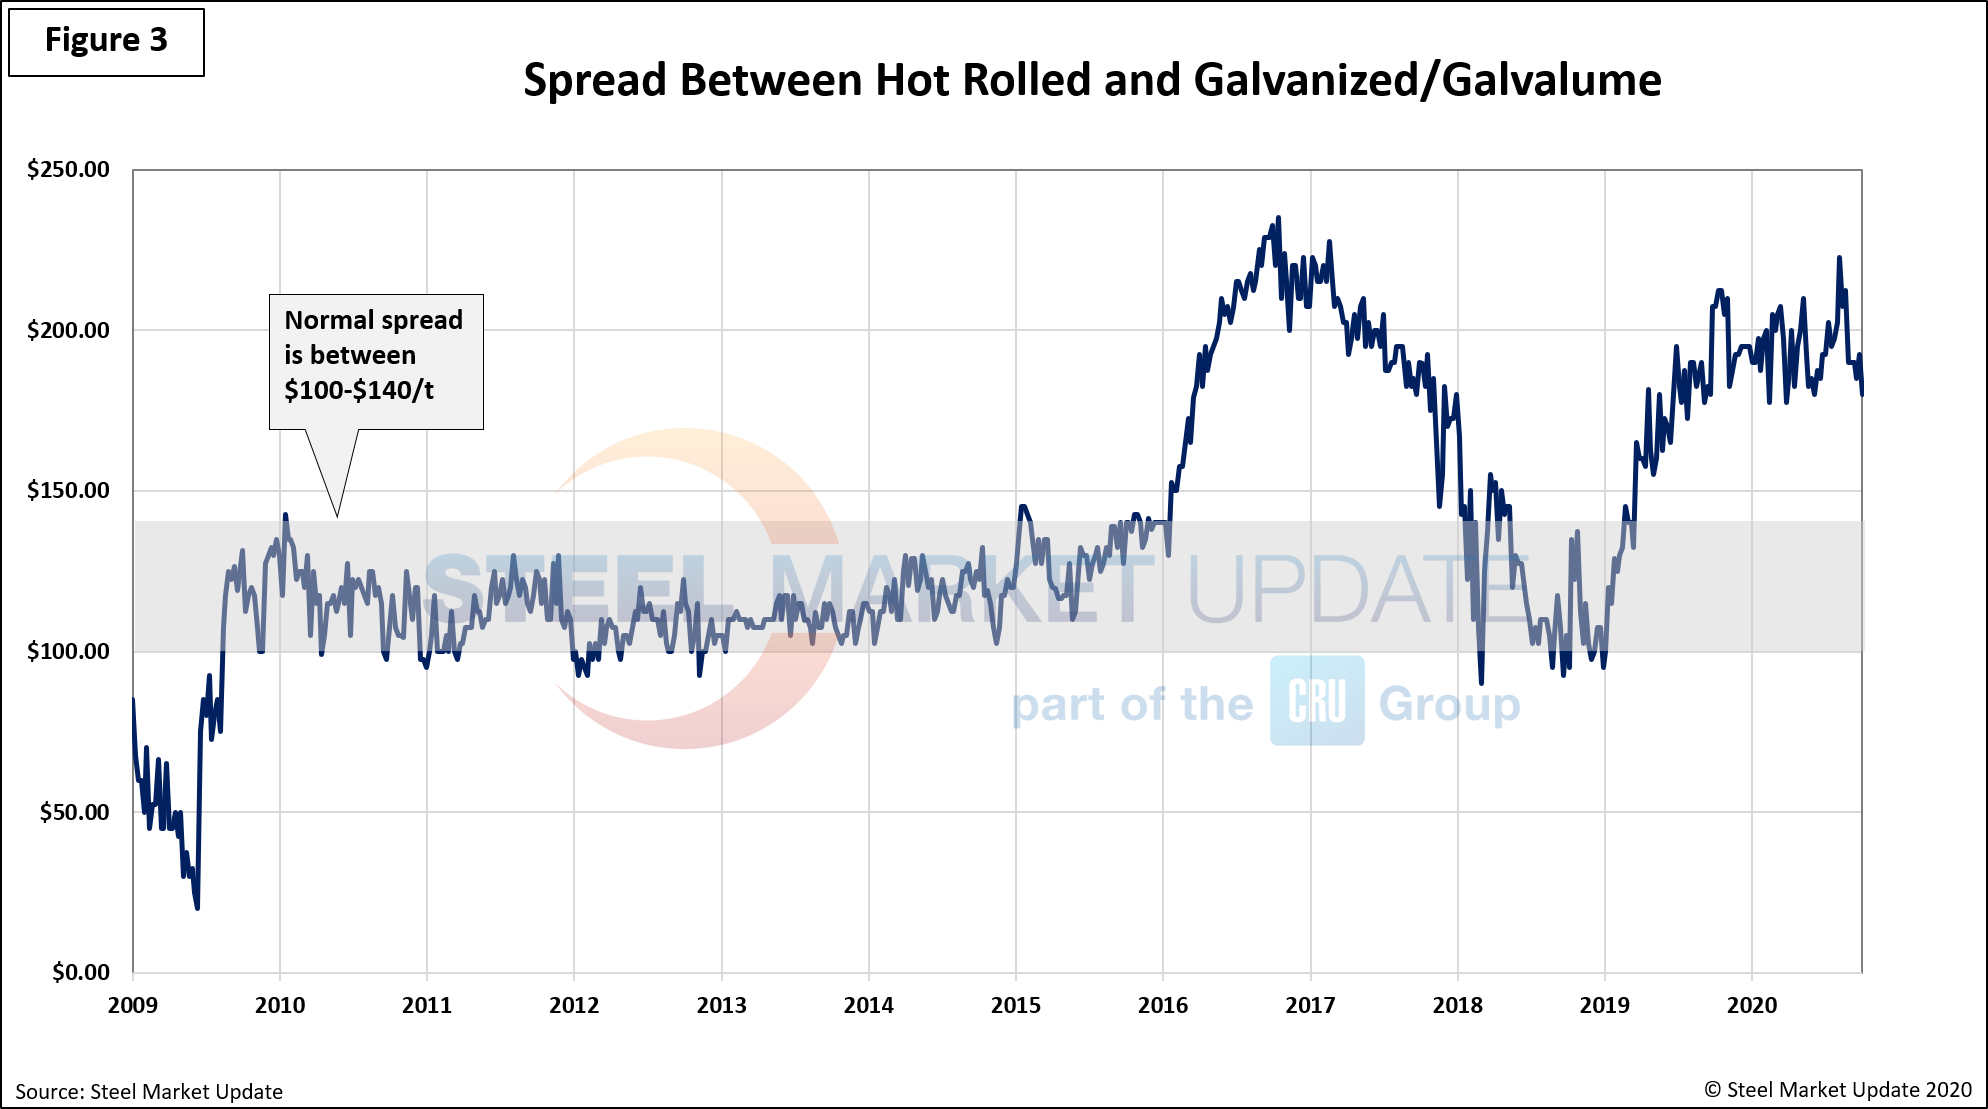
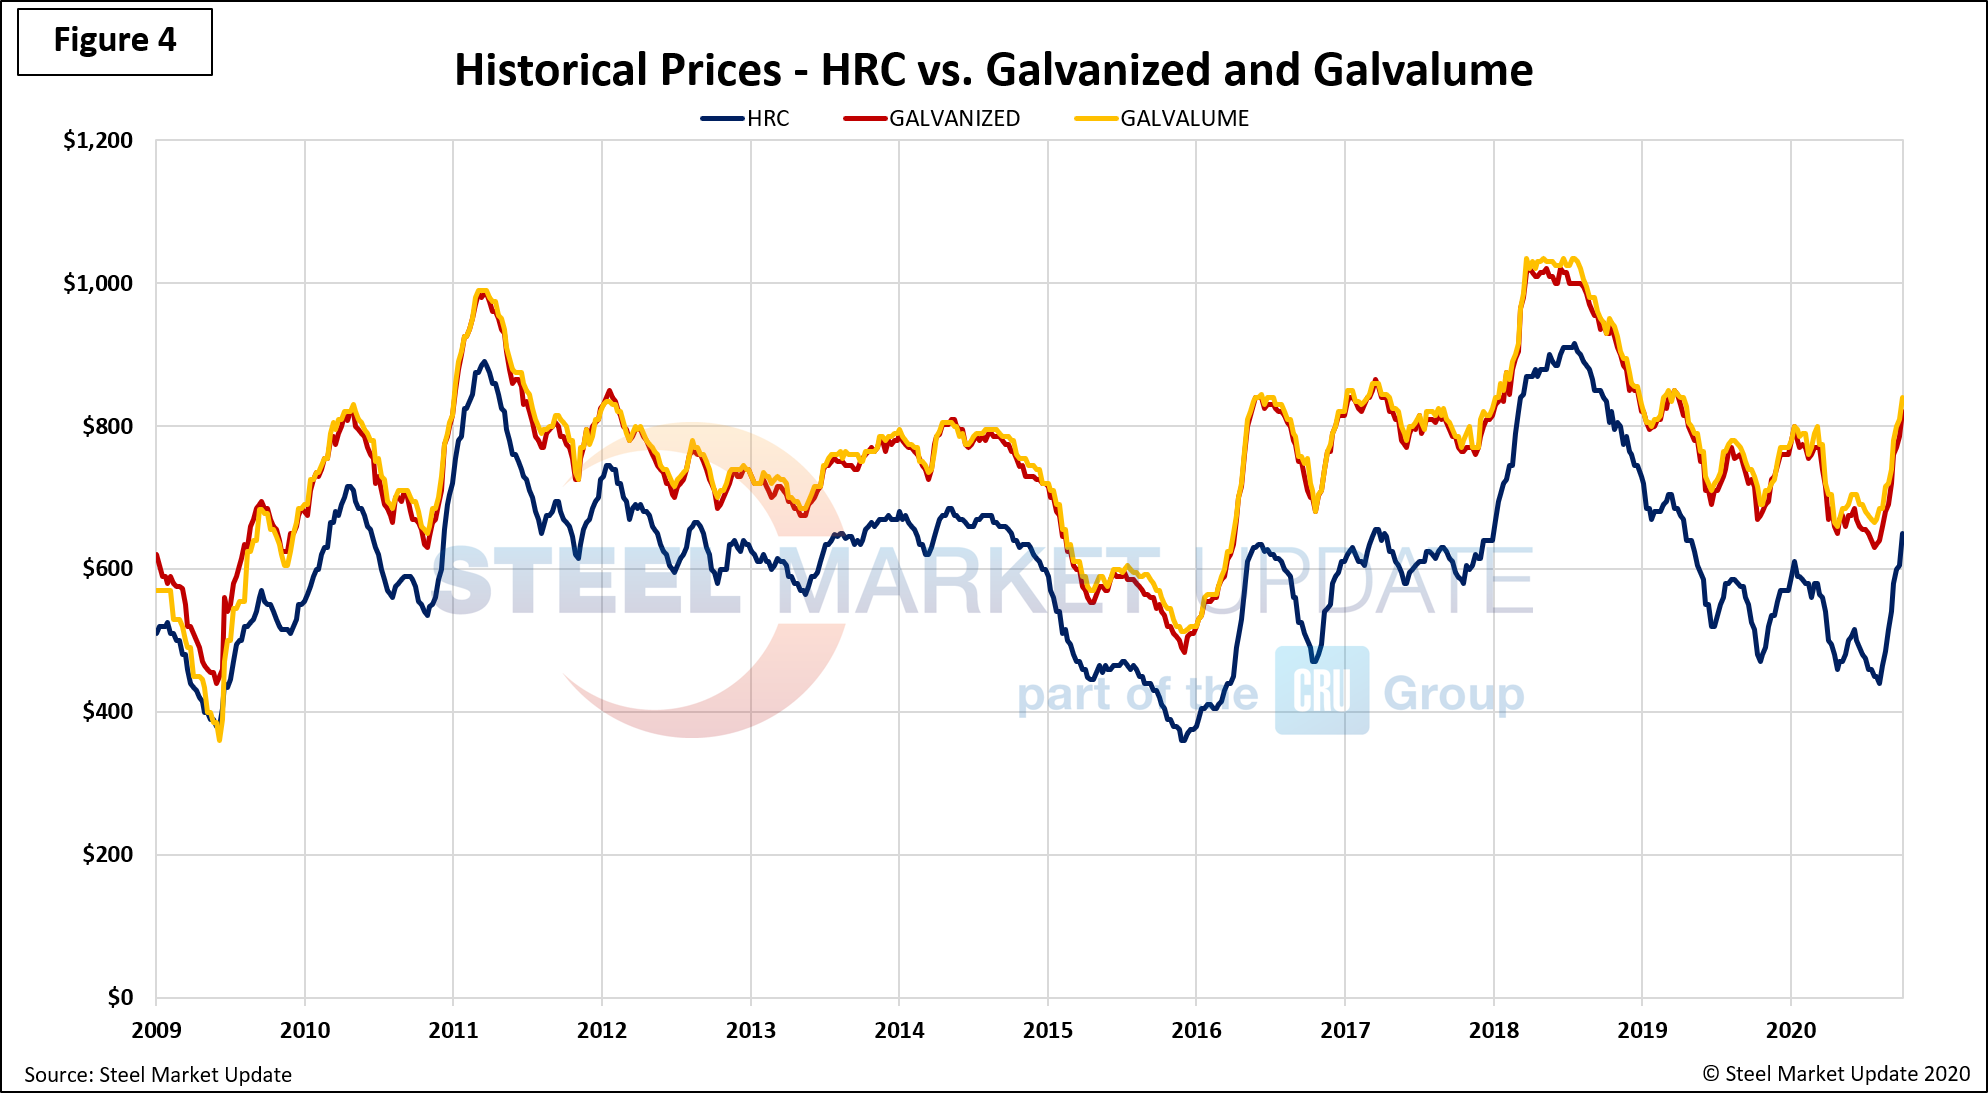
Historically, the spread between HRC and galvanized products ranges from $100-140 per ton (Figure 3). However, as HRC prices have been rallying post COVID-19, the spread has been exacerbated with levels reaching over $222 per ton. Levels reminiscent of the price rally seen in 2016. Figure 4 shows a side-by-side comparison on HRC, galvanized and Galvalume prices since 2009 for further detail, highlighting the spread over time.


While prices have been on the rise and further increases are expected in the near-term, some stability is likely to follow, based on past history. Although many see the HRC market as a series of boom and bust cycles, the historical data shows extended periods of relative stability, most recently 52 weeks from July 2019 to July 2020; 86 weeks from May 2016 to January 2018; 160 weeks from August 2011 to August 2014; and 72 weeks from August 2009 through December 2010. So, although the highs and lows tend to stand out, over the long term steel prices trend within a fairly narrow range. For this analysis, stability was defined by a swing of no more than $100 per ton over no less than a period of eight-consecutive weeks. Price variations that rose or fell at a faster pace were counted as a correction or positive/negative move.


