Prices

September 10, 2020
Hot Rolled Futures: Who's on the Other Side of the Trade?
Written by Tim Stevenson
SMU contributor Tim Stevenson is a partner at Metal Edge Partners, a firm engaged in Risk Management and Strategic Advisory. In this role, he and his firm design and execute risk management strategies for clients along with providing process and analytical support. In Tim’s previous role, he was a Director at Cargill Risk Management, and prior to that led the derivative trading efforts within the North American Cargill Metals business. You can learn more about Metal Edge at www.metaledgepartners.com. Tim can be reached at Tim@metaledgepartners.com for queries/comments/questions.
We often hear this question when it comes to futures. If you are buying futures because you think the prices will rise, who is selling it? If the opposite situation is true and you think prices will fall, you want to sell futures. Who is the buyer?
The easiest way to address this is to think of different entities hedging the opposite risk. If you are an auto parts supplier and have promised a fixed price to your customer, you get hurt when prices will rise, so you want to buy futures. The seller could be a service center that is long on a significant amount of physical inventory. With all that physical inventory sitting around, they would get hurt if prices fell. So, both entities are hedging the opposite risk—and a transaction can take place. If prices rise, the auto parts supplier can honor their fixed price deal. They’ll pay more for the physical steel they buy and process for their customer, but gains on their hedges will offset this. The service center will lose money on their hedges, but they’ll happily be making more on the physical tons they purchased, offsetting the losses on the futures contract. Net net, both parties have hedged risk and stabilized their margins.
We have also seen more fund activity in the futures market. It’s impossible to know why they would be buying or selling, but they may be trading spreads between different commodities. For example, U.S. HRC prices have been quite low relative to iron ore when compared to history. A fund may come in and buy HRC and sell iron ore, betting that the spread will narrow. There are many possible reasons for someone to take the other side of a trade.
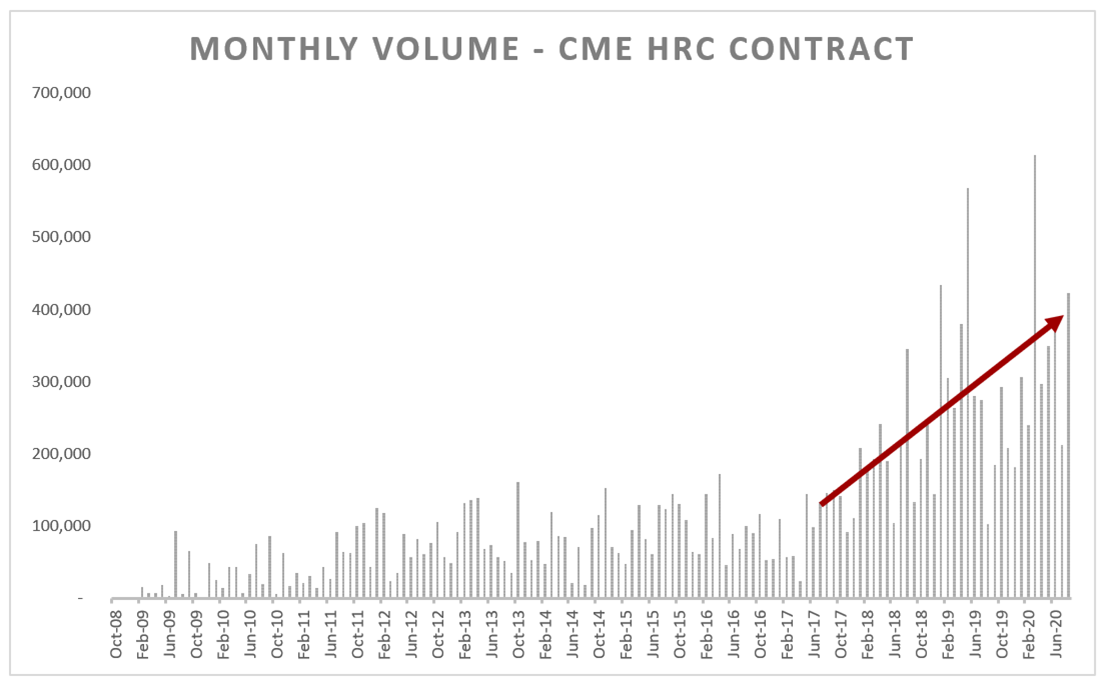
Now on to the markets. Volumes for the CME HRC contract were strong in August, coming in at over 400,000 tons. Increases have come both from existing players trading more as well as new companies getting set up to trade futures and manage risk. The chart below lends some perspective to the volume trends over the history of the contract. Keep in mind that this is just exchange cleared volumes, and a significant amount also trades “over the counter” or OTC, without going through the exchange.
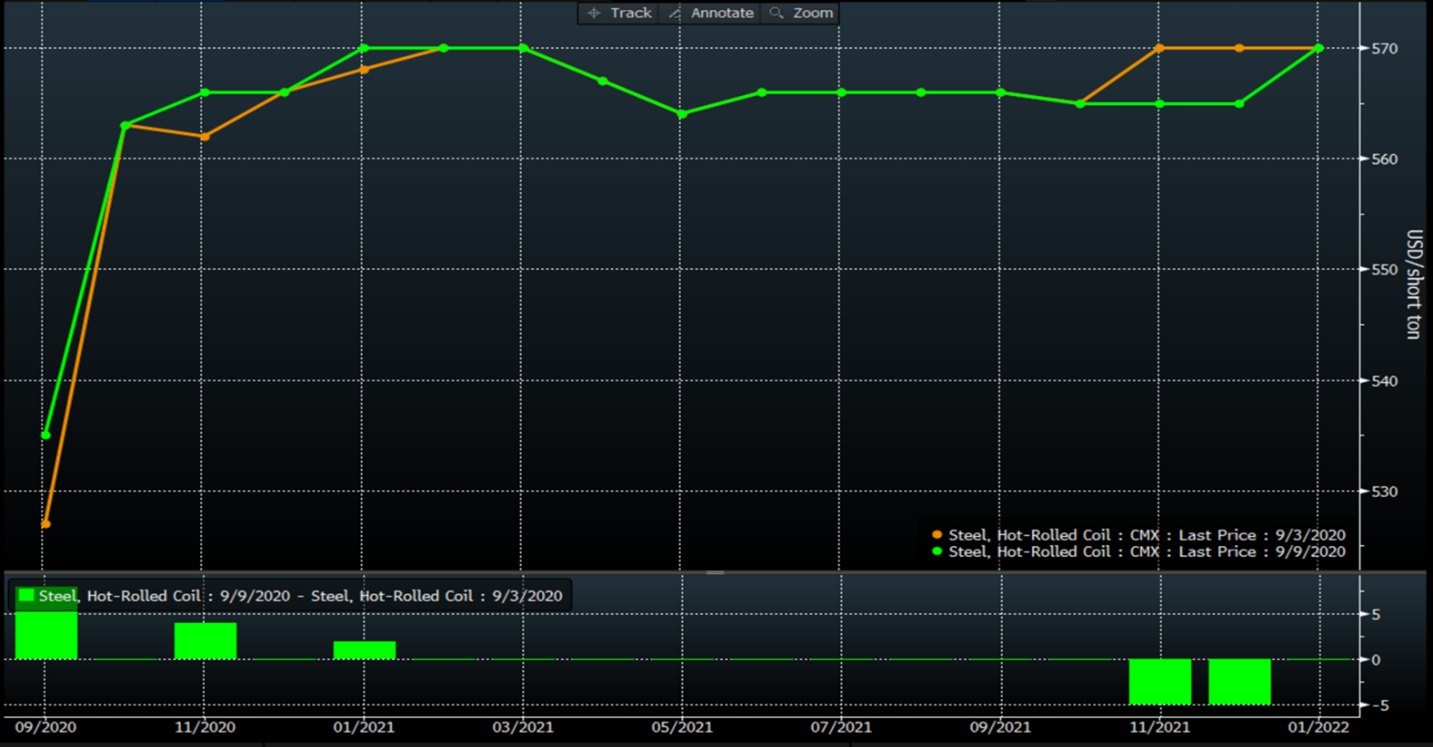
We’ve seen some very heavy trading so far in September, and volatility has been on the rise in a number of markets, including equities. That said, there wasn’t a major move either direction week/week on HRC:
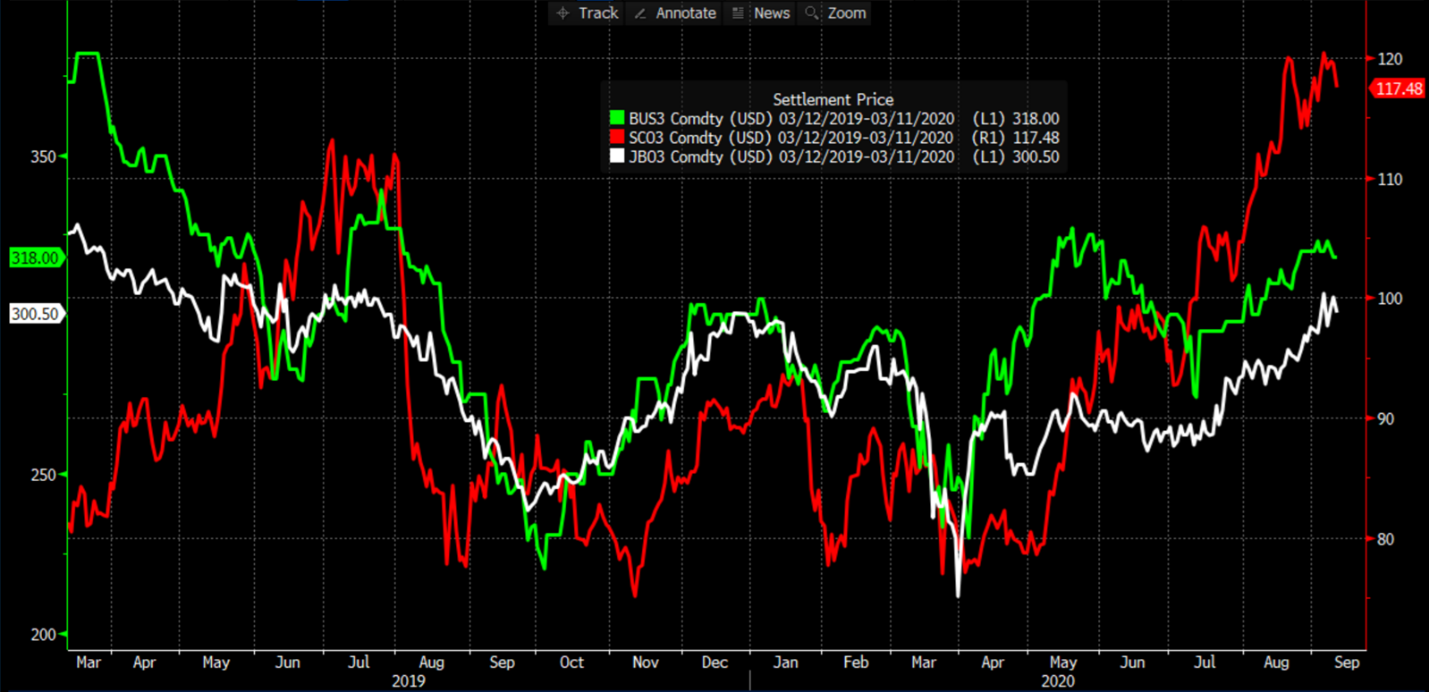
Looking at the steelmaking raw materials, you can see that ore prices continue to lead the pack. While there has been a slight pullback in the 3-month forward ore contract, you can see that with the strength in activity in China, ore prices remain high (red line). This tends to put upward pressure on the other raw materials, such as Turkish scrap (white) and the U.S. Busheling scrap contract (green).
China is producing steel at a run rate of around 1 billion tons per year, driven in part by a surge in infrastructure spending. The chart below shows the 3-month moving average of infrastructure investment there, on a y/y basis:
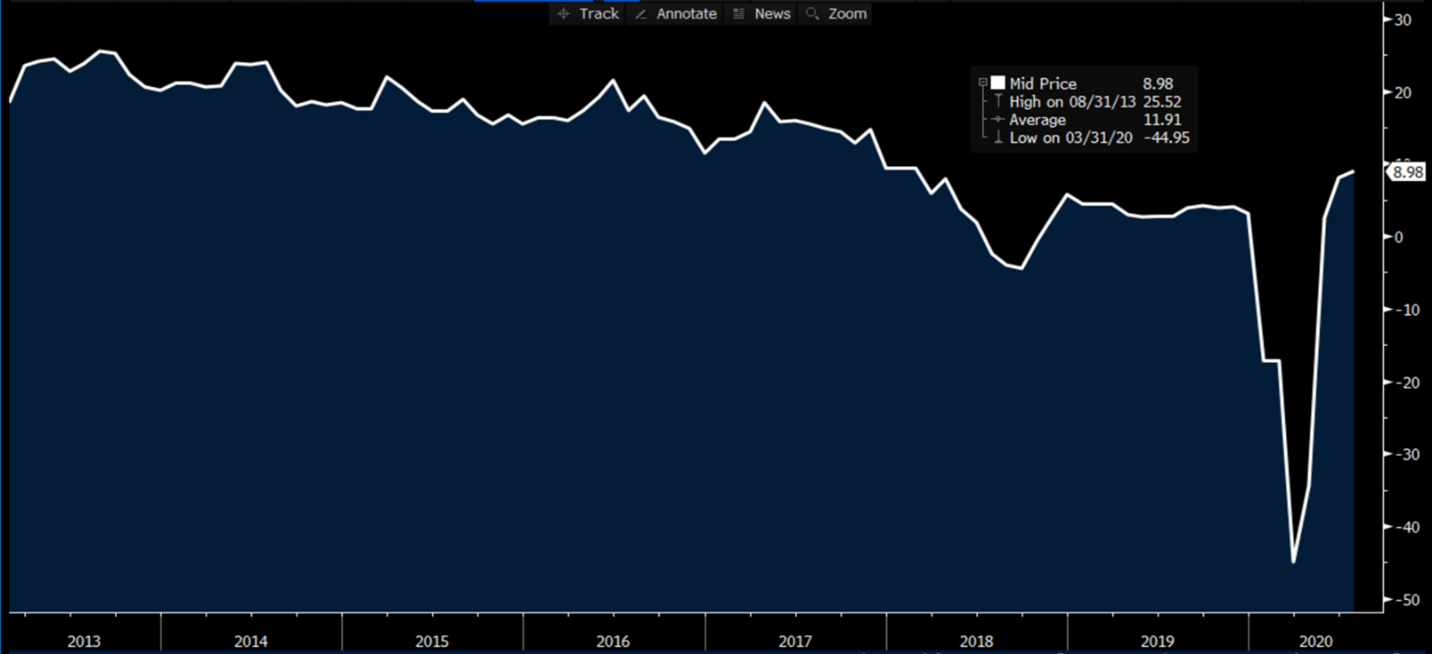
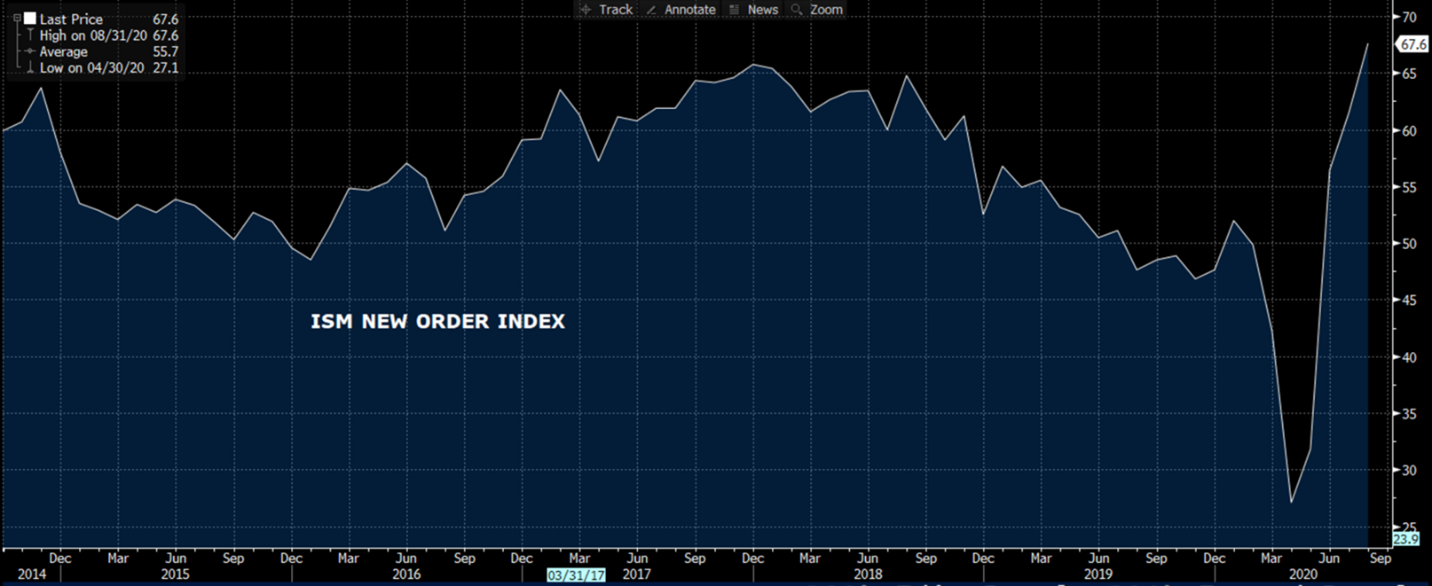
Back in the U.S., we’ve also seen economic data continue to come in above expectations in most cases. The ISM Manufacturing Index was strong early in September, but we thought the New Orders component was worth sharing, as it continues on an upward trajectory after being crushed early in the year:
Frankly, as we reviewed most of the U.S. economic data over the past month, there were simply not many that disappointed estimates. There were a few, however, as the Philly Fed and Chicago Fed indices took a step back after recovering, and we will also keep a watchful eye on the inflation data. The CPI and PPI have both been running a bit hot lately, and with the Federal Reserve’s recent change in inflation targeting, it sounds like they may be willing to live with a bit higher inflation over some time period in order to get to their long-term target of 2 percent. While 2 percent inflation doesn’t seem like much, it does cut the purchasing power of a dollar in half every 36 years—so keep that in mind in your retirement plan! In addition, if we do see inflation move higher, it is hard to believe that long-term interest rates wouldn’t rise. This would not be good for the economy.
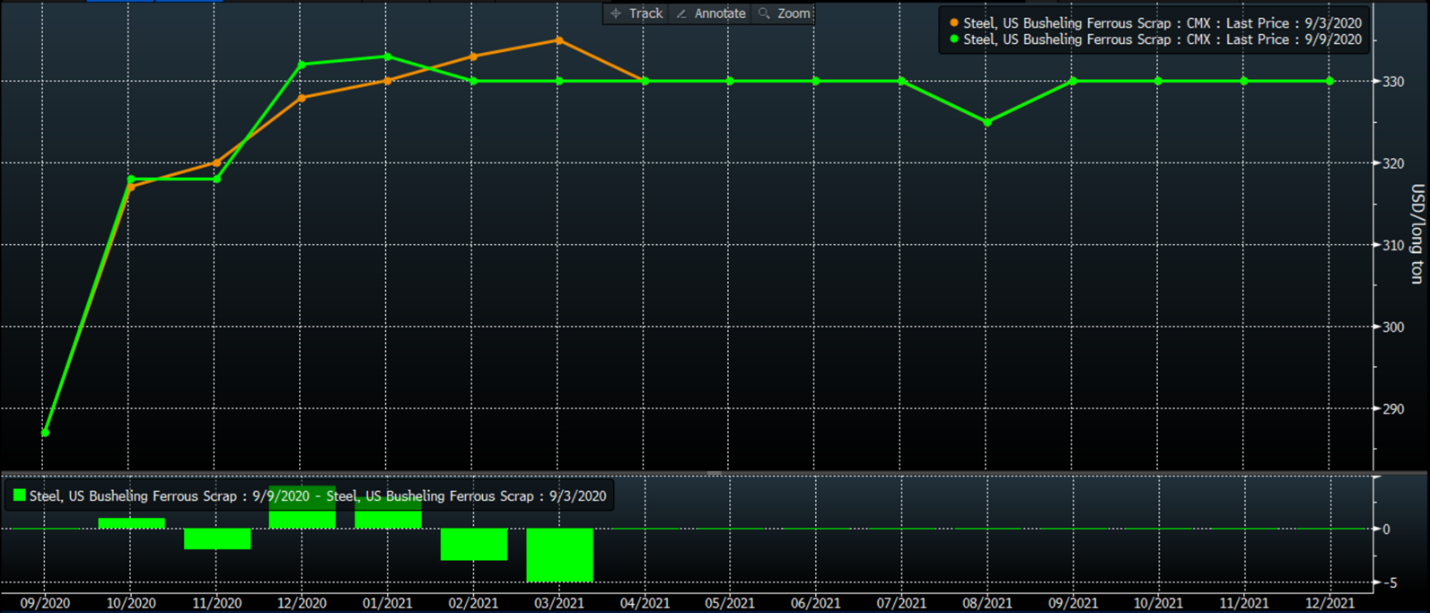
In scrap land, the curves there also didn’t change much week/week. It is worth noting the steep contango (future months higher than spot months) here, and the October contract settled at $317 yesterday, which would be another big move higher from the September settles. Certainly, with all the minimill capacity being added in the U.S., these mills will need to increase their scrap buys to feed the mill, and perhaps that is why the next few months show a steep ramp. In addition, we are moving closer to winter, which normally tightens scrap supplies and leads to higher pricing.
In closing, we’d note that while the HRC chart towards the top of the article doesn’t show much change week/week, yesterday (Thursday) has seen some significant increases across most of the HRC curve as mills apparently are moving offer prices higher. The unanswered question in all this is have people re-stocked enough to stay out of the market when mills increase prices? If so, service centers and end users can step away from spot buys and wait for prices to fall again. If, on the other hand, inventory levels are still too low, people may have no choice but to keep buying higher priced steel, providing more longevity to this upward price cycle. Stay safe everyone!
Disclaimer: The information in this write-up does not constitute “investment service,” “investment advice” or “financial product advice” as defined by laws and/or regulations in any jurisdiction. Neither does it constitute nor should be considered as any form of financial opinion or recommendation. The views expressed in the above article by Metal Edge Partners are subject to change based on market and other conditions. The information given above must be independently verified and Metal Edge Partners does not assume responsibility for the accuracy of the information


