Market Data

August 31, 2020
SMU Energy Analysis: Fuel Consumption Down 20 Percent in Q2
Written by Brett Linton
The latest Energy Information Administration estimates show U.S. liquid fuels consumption averaged 16.2 million barrels per day (b/d) in Q2 2020, down 20 percent from Q2 2019 due to COVID-related travel restrictions and reduced economic activity. EIA forecasts U.S. liquid fuels consumption will average 18.9 million b/d in Q3 (down 1.8 million b/d YOY), rising to an average of 20.0 million b/d in 2021. EIA expects crude oil production to average 11.3 million b/d in 2020 and 11.1 million b/d in 2021, both down from 12.2 million b/d in 2019.
Spot Prices
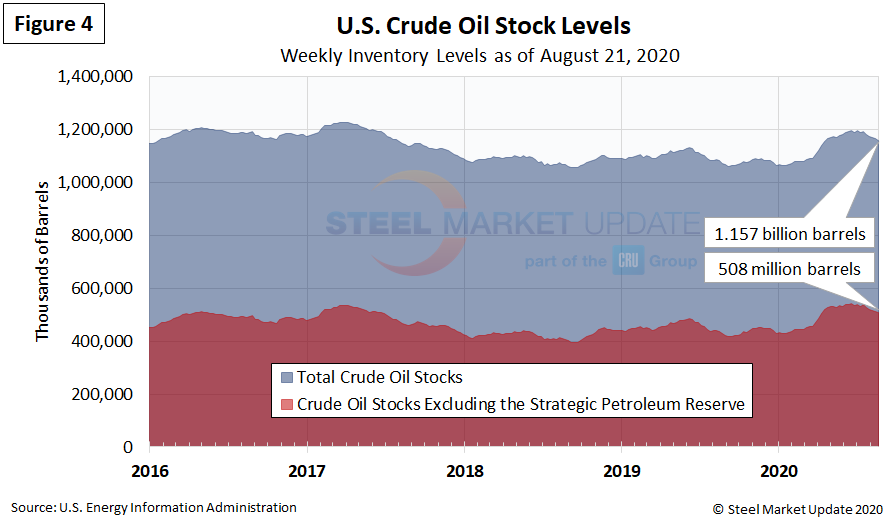
The spot market price for West Texas Intermediate (WTI) has rebounded somewhat from the plunge after the cornonavirus shutdowns, increasing to $42.73 per barrel as of Aug. 21. Natural gas at the Henry Hub in Oklahoma was priced at $2.39 per MMBTU (million British Thermal Units) as of Aug. 21, up significantly from one month ago ($1.72) and up from the beginning of the year ($2.05).
Rig Counts
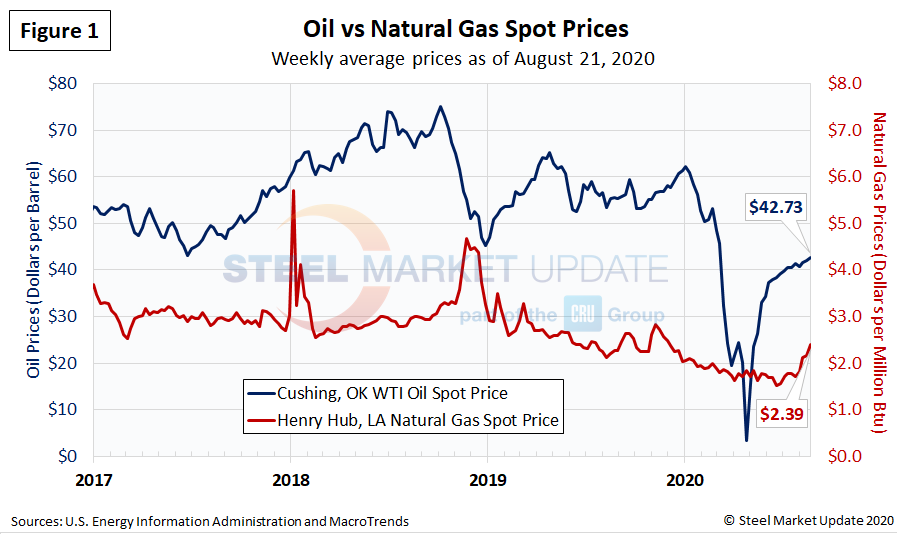
The decline in active U.S. rigs drilling for oil and gas remains flat as of last week to 254 rigs, including 180 oil rigs, 72 gas rigs and 2 miscellaneous rigs, according to the latest data from Baker Hughes (Figure 2). That’s a decline of 68 percent from the 793 rigs in production in March prior to the coronavirus shutdowns. The table below compares the current U.S., Canada and International rig counts to historical levels.
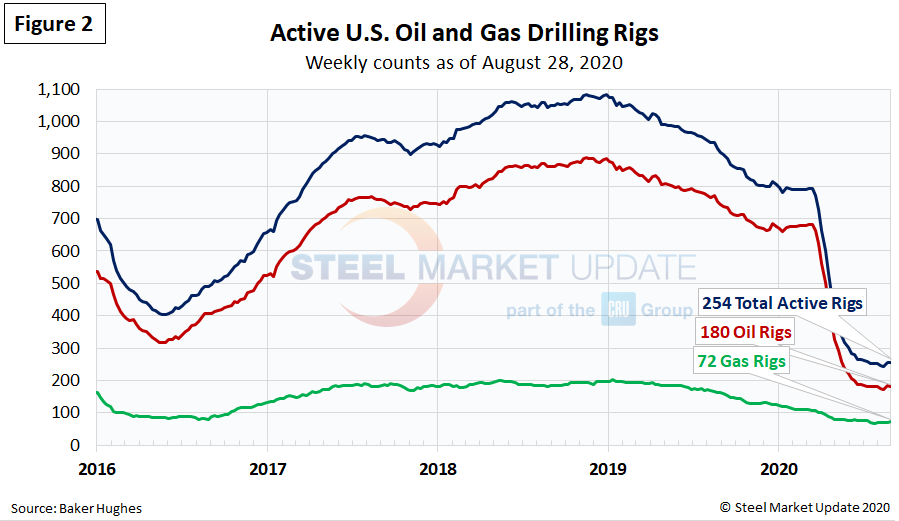

U.S. oil and gas production are heavily concentrated in Texas, Oklahoma, North Dakota and New Mexico, which have all seen declines of more than 70 percent in active drill rigs since mid-March. The rig count in Texas plummeted from 407 in mid-March to 104 as of last week (Figure 3).
Stock Levels
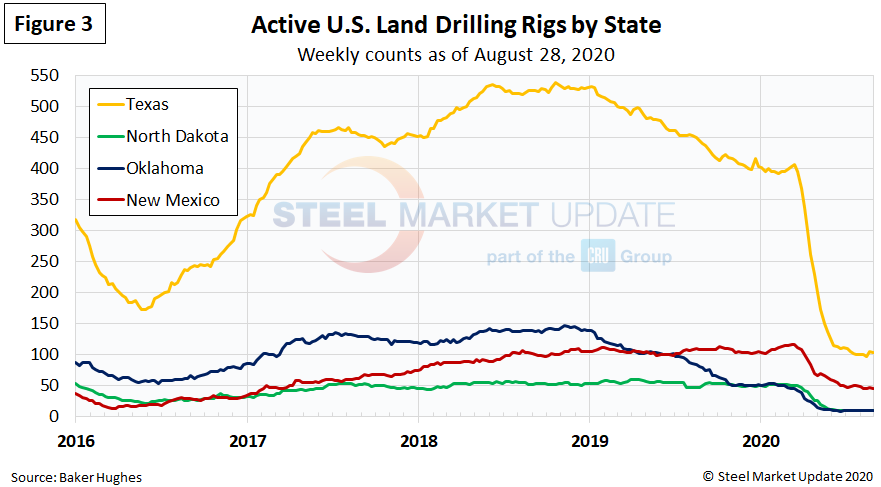
Total crude oil stocks in the U.S. had been on the rise since mid-March, but started to decline in July, falling to 1.157 billion barrels as of Aug. 21, up from just over 1 billion barrels at the beginning of the year (Figure 4).