Prices

July 30, 2020
Commodities—Are We Sowing the Seeds of Inflation?
Written by Tim Stevenson
SMU contributor Tim Stevenson is a partner at Metal Edge Partners, a firm engaged in Risk Management and Strategic Advisory. In this role, he and his firm design and execute risk management strategies for clients along with providing process and analytical support. In Tim’s previous role, he was a Director at Cargill Risk Management, and prior to that led the derivative trading efforts within the North American Cargill Metals business. You can learn more about Metal Edge at www.metaledgepartners.com. Tim can be reached at Tim@metaledgepartners.com for queries/comments/questions.
We will narrow our focus to the ferrous complex later on in the article, but it is valuable to look at some big-picture trends that tend to influence commodity prices. Let’s start with a look at the U.S. dollar. The dollar has been weakening versus major foreign currencies since the peak of “fear” that we saw when the COVID crisis was first unfolding. When investors are fearful about the future, they normally flock to the dollar as a safe haven, likely causing the big spike in the dollar in March. However, since then it has been nothing but a downhill slide for the Greenback. Here is a chart of the DXY, which is an index of the U.S. dollar versus other major currencies:
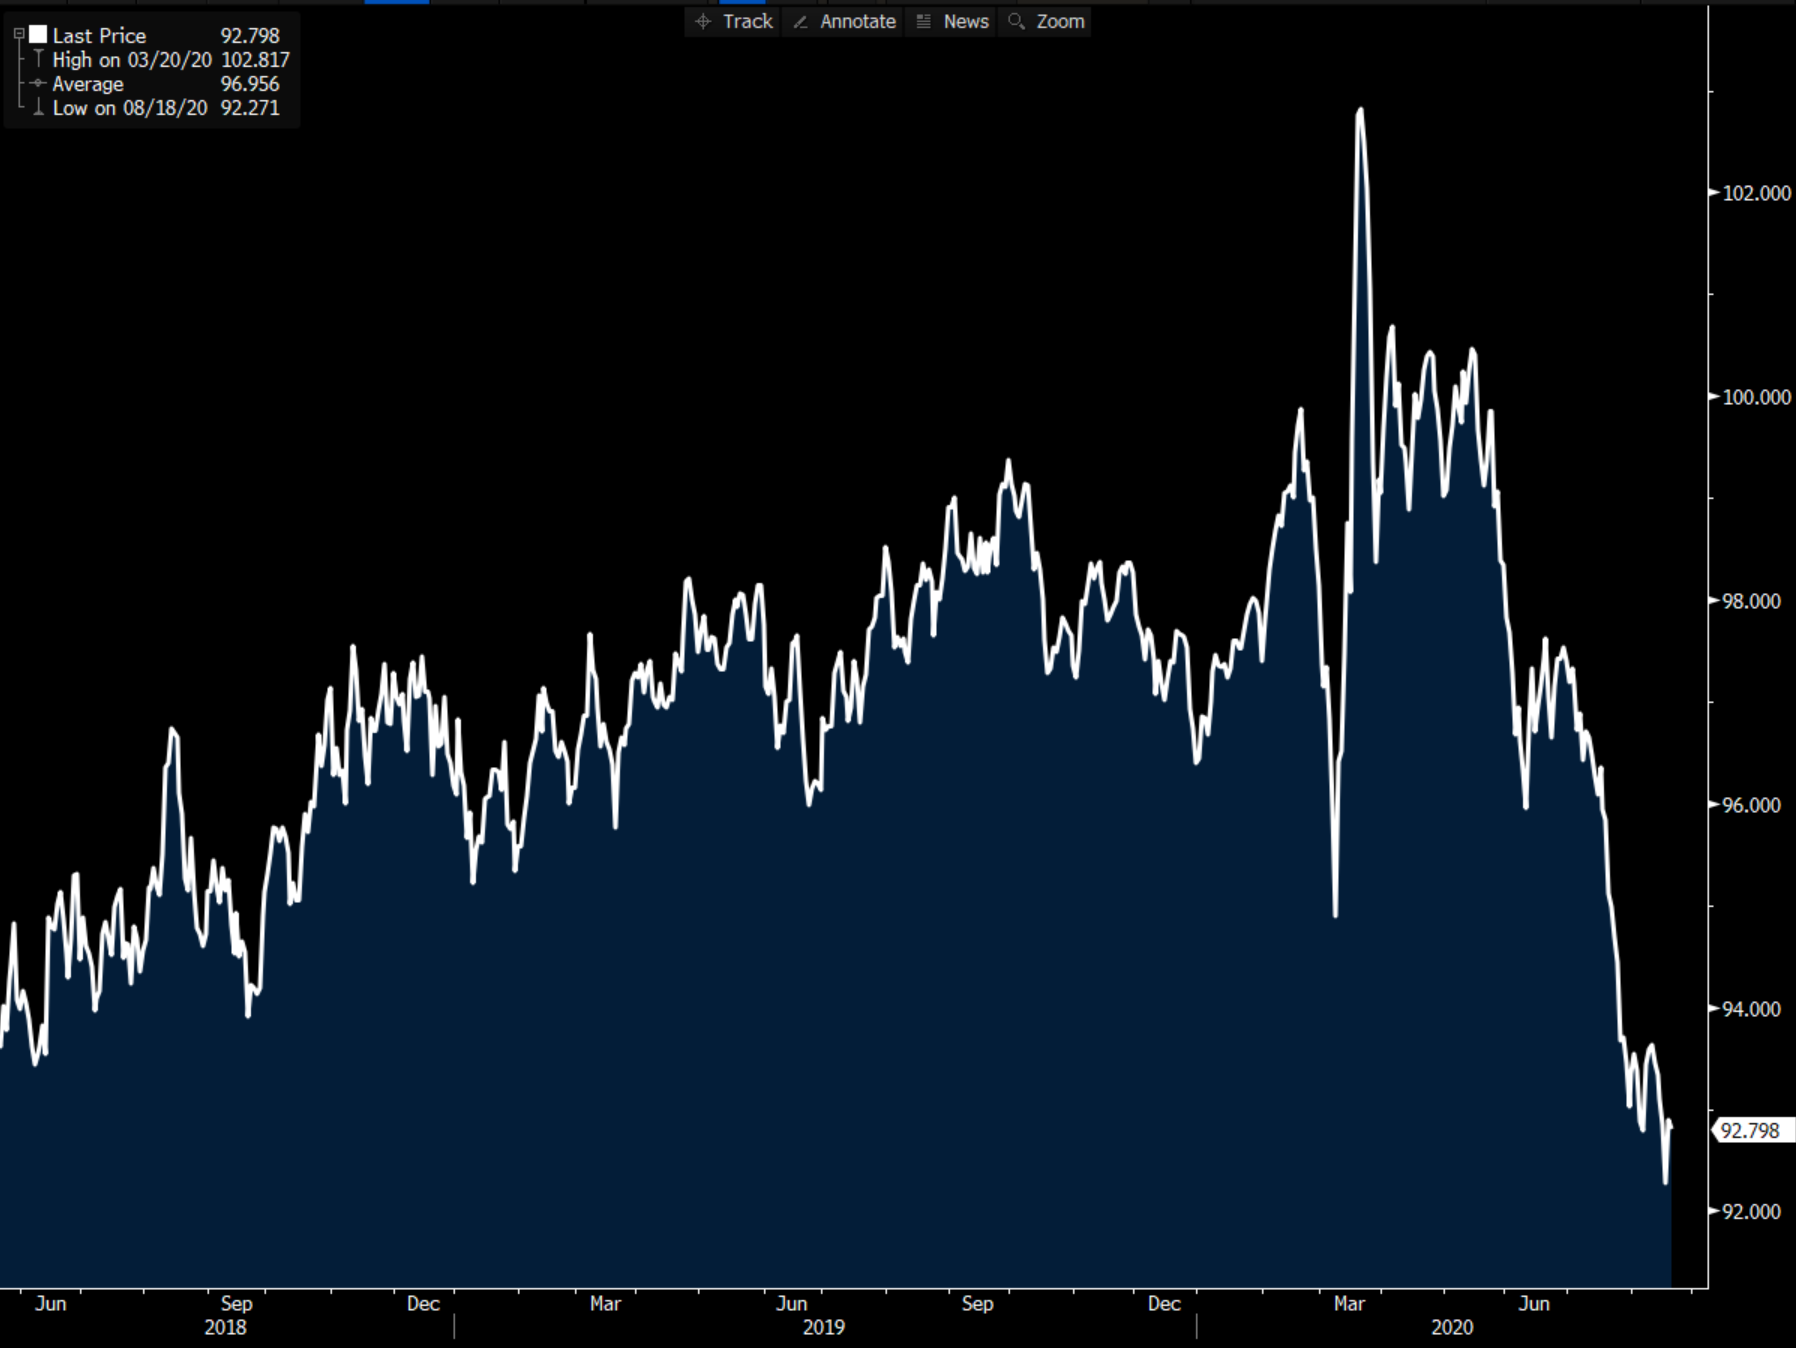
Dollar weakness is usually thought to be bullish for commodities because many global commodities are traded in U.S. dollars (oil, gold, iron ore, soybeans, etc.). When the dollar “weakens,” it means that it takes less of a foreign currency to buy a dollar. So, if you are a foreign commodity buyer purchasing your oil in dollars, and it takes less of your currency to buy a dollar, oil gets “cheaper” in terms of your local currency. When the price of something goes down, demand for it tends to go up, so this is part of the reason why a lower dollar can be an inflationary force for commodities. We don’t know exactly why the dollar is declining in value relative to other currencies, but some have speculated that the spectacular deficits we are racking up may be to blame, as well as the extremely strong growth we are seeing in money creation here in the U.S. For example, take a look at this chart of Federal Reserve Money Supply Growth (M2 growth – in y/y percentage terms):
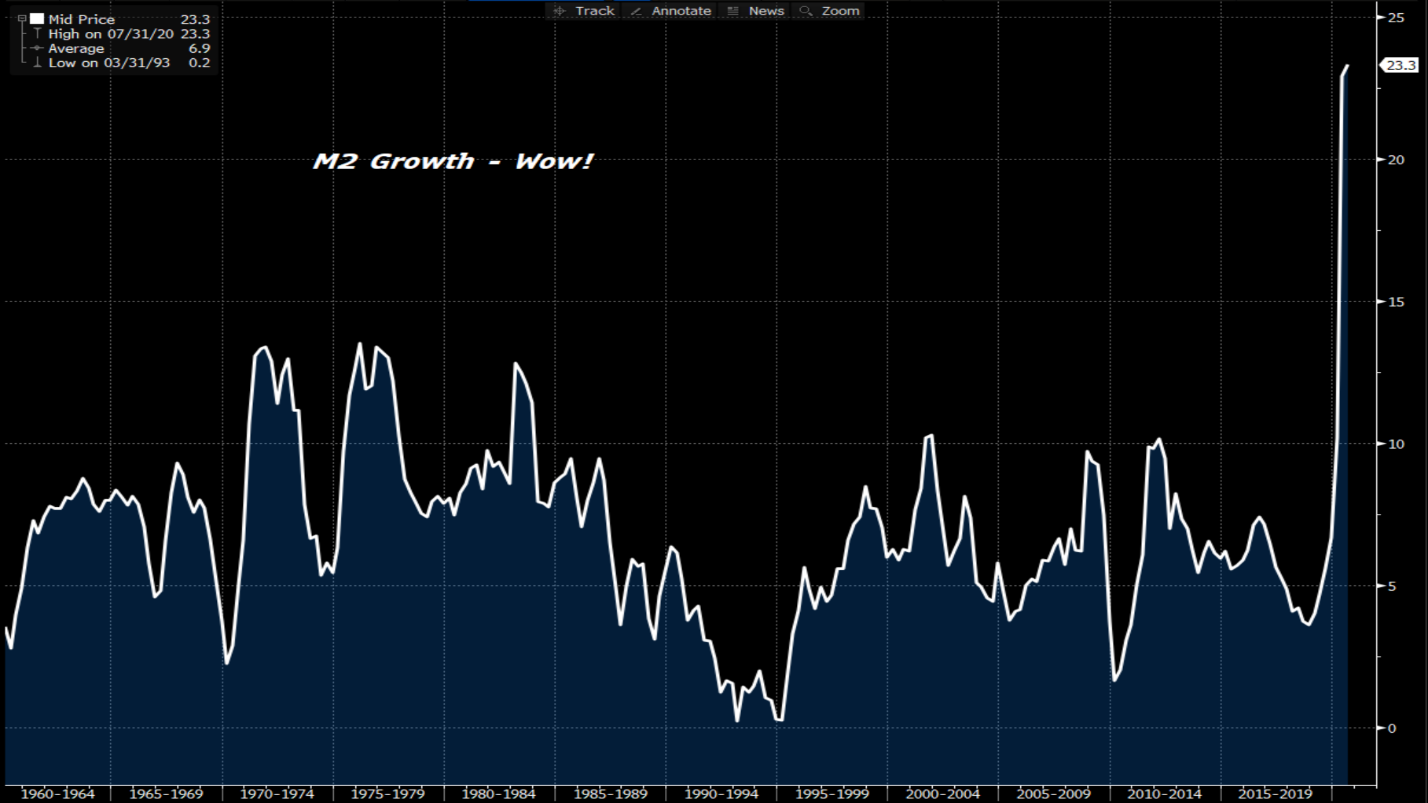
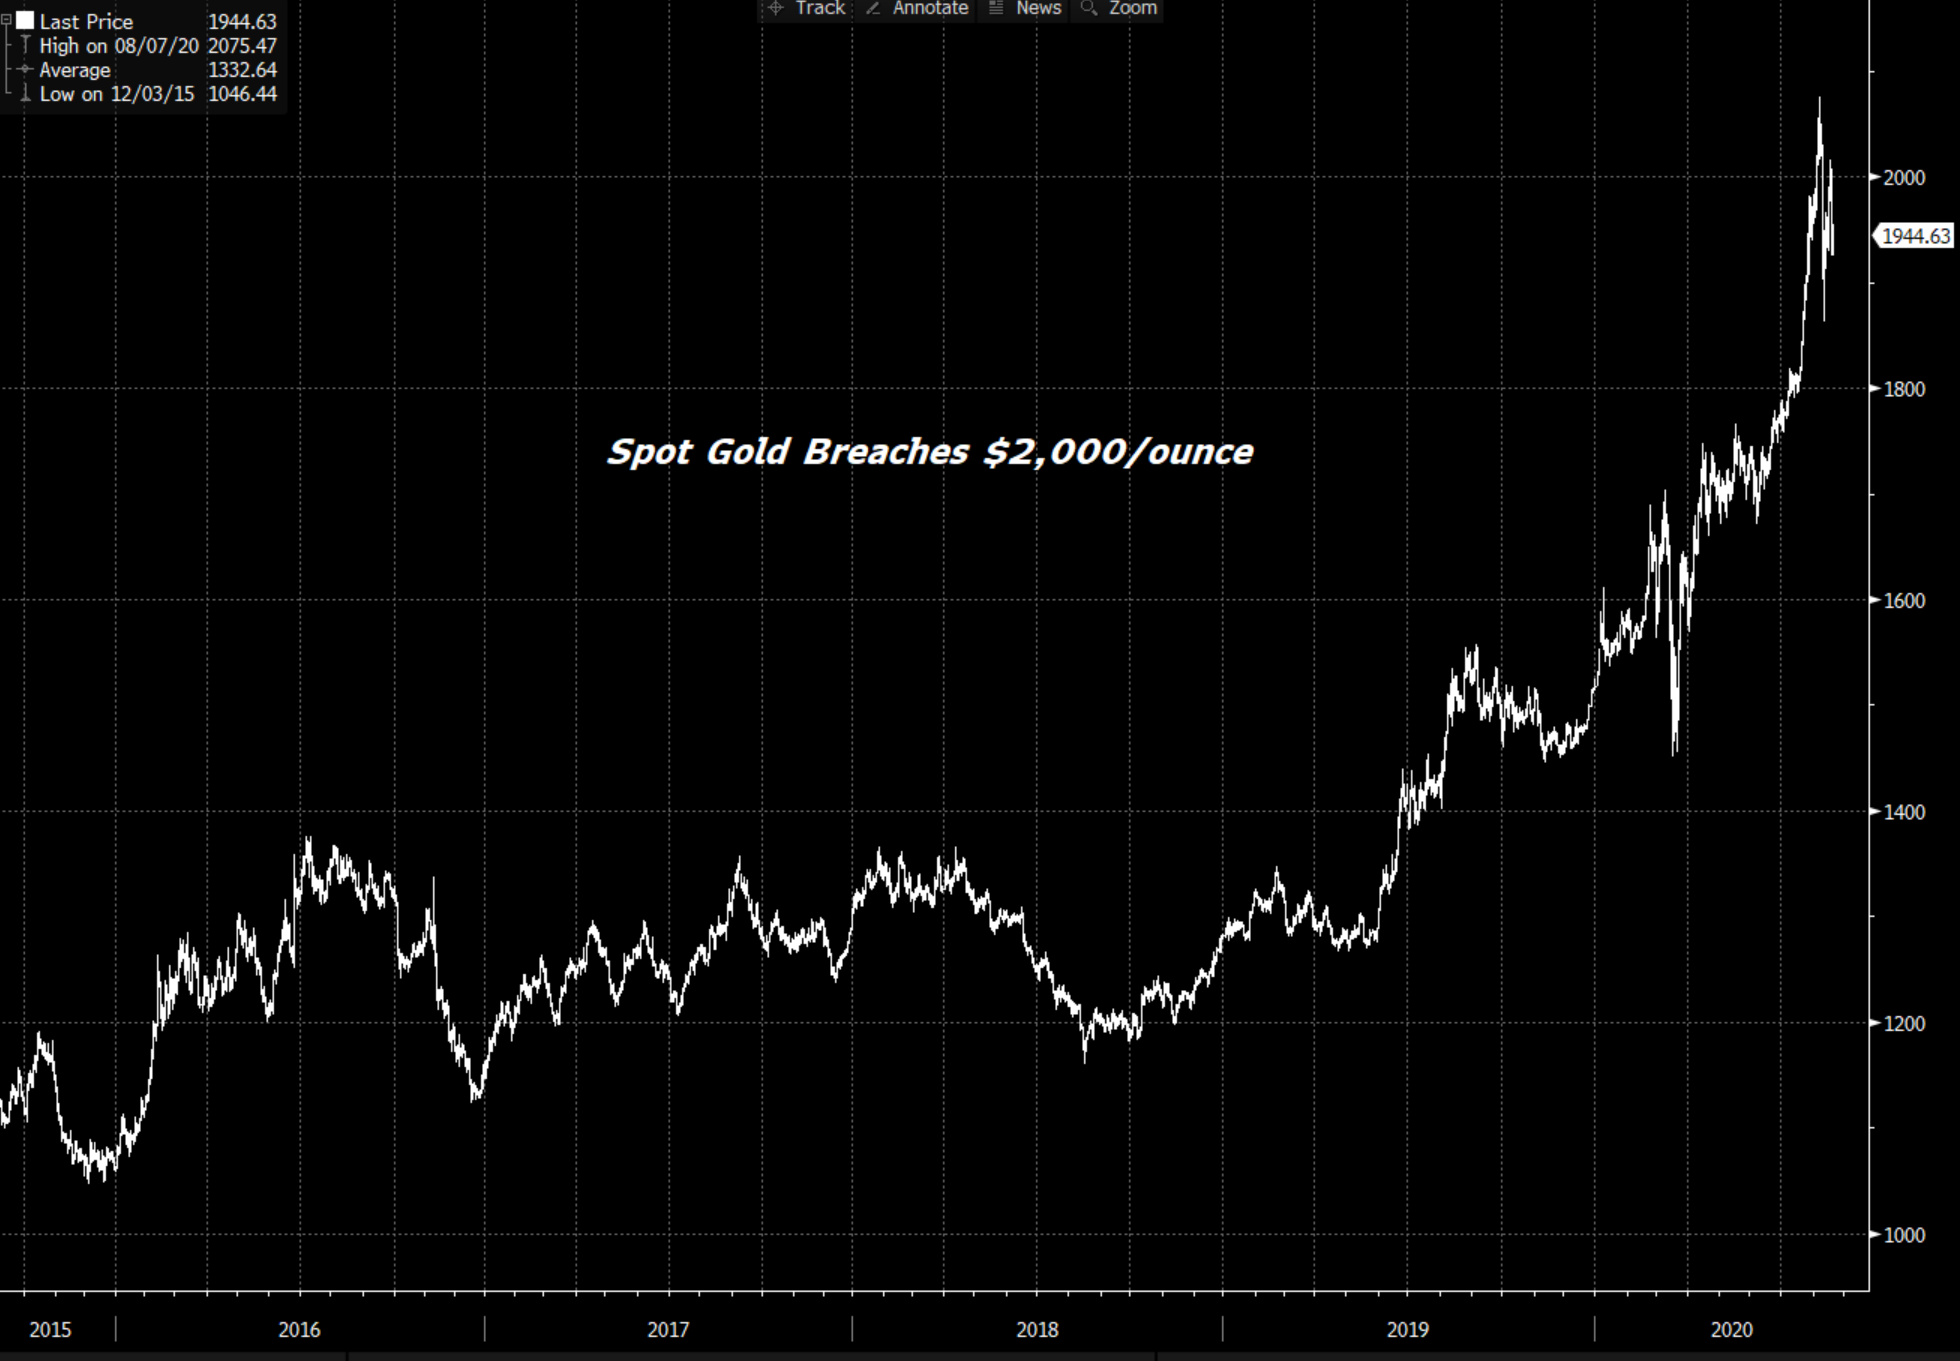
Economics tells us that when the supply of a good is suddenly and rapidly increased, the price of that good, all else equal, should decline. Perhaps this is one of the reasons for the dollar weakness. Some of the normal “inflation hedges” have also been heading north, as evidenced by gold prices:
Some have also postulated that the equity market’s rally is likely in part due to the aggressive money supply growth. In essence, it “has to go somewhere.”
Couple the weaker dollar with the demand we are seeing out of China for steel and ore and you have the makings of a rally—at least in that part of the world! Here is a chart of iron ore prices, FOB China:
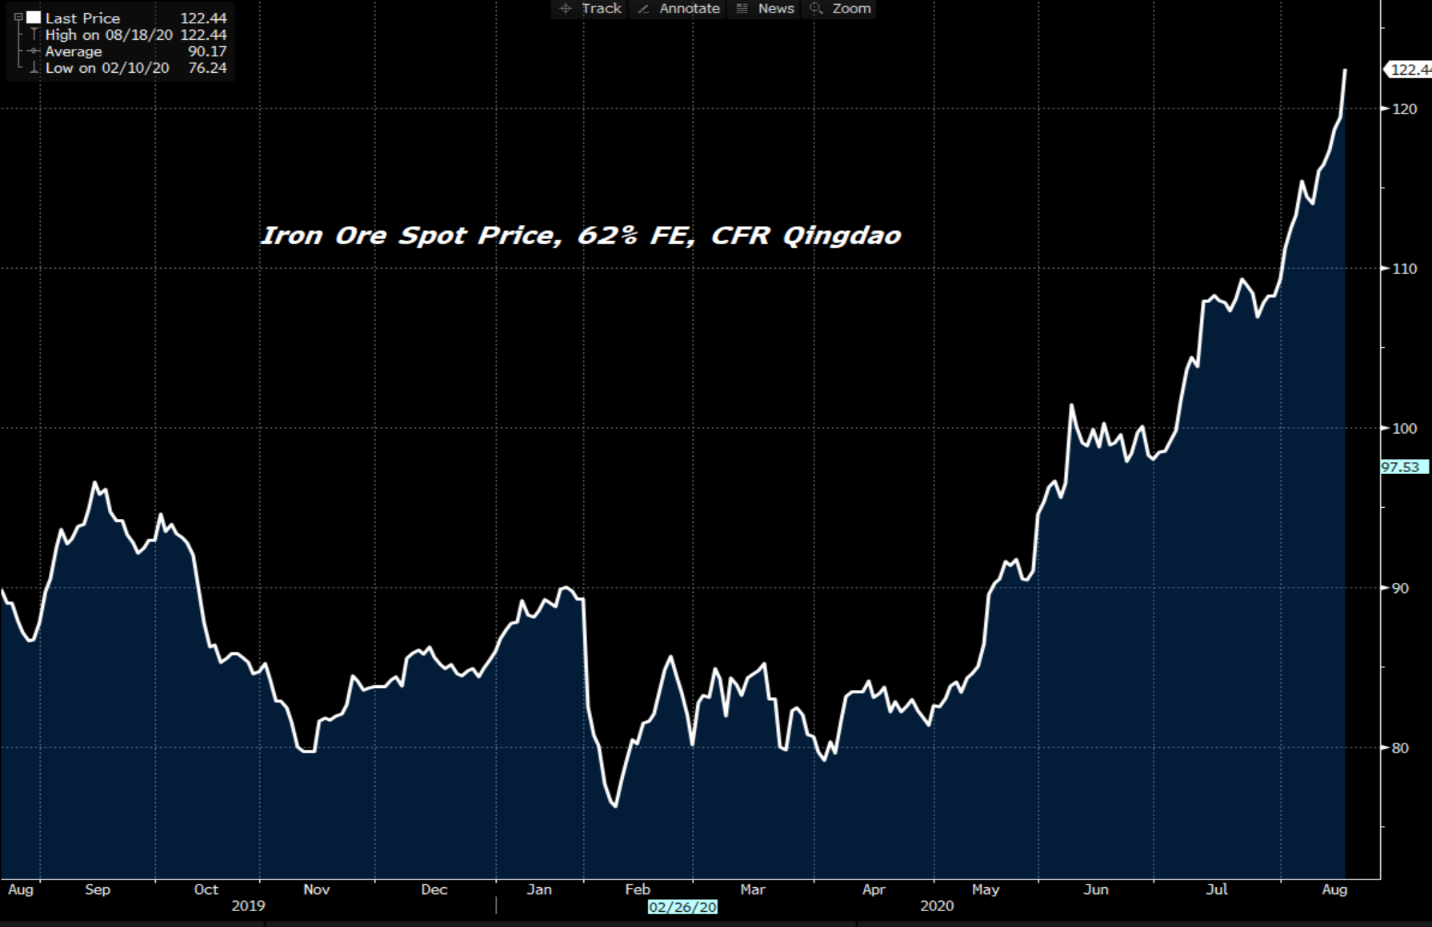
It’s one thing to see spot prices rally, but quite another to see the entire curve shift upwards. This chart shows the month/month change in the iron ore curve; it’s moved up by $12-21/ton over the next 12 months.
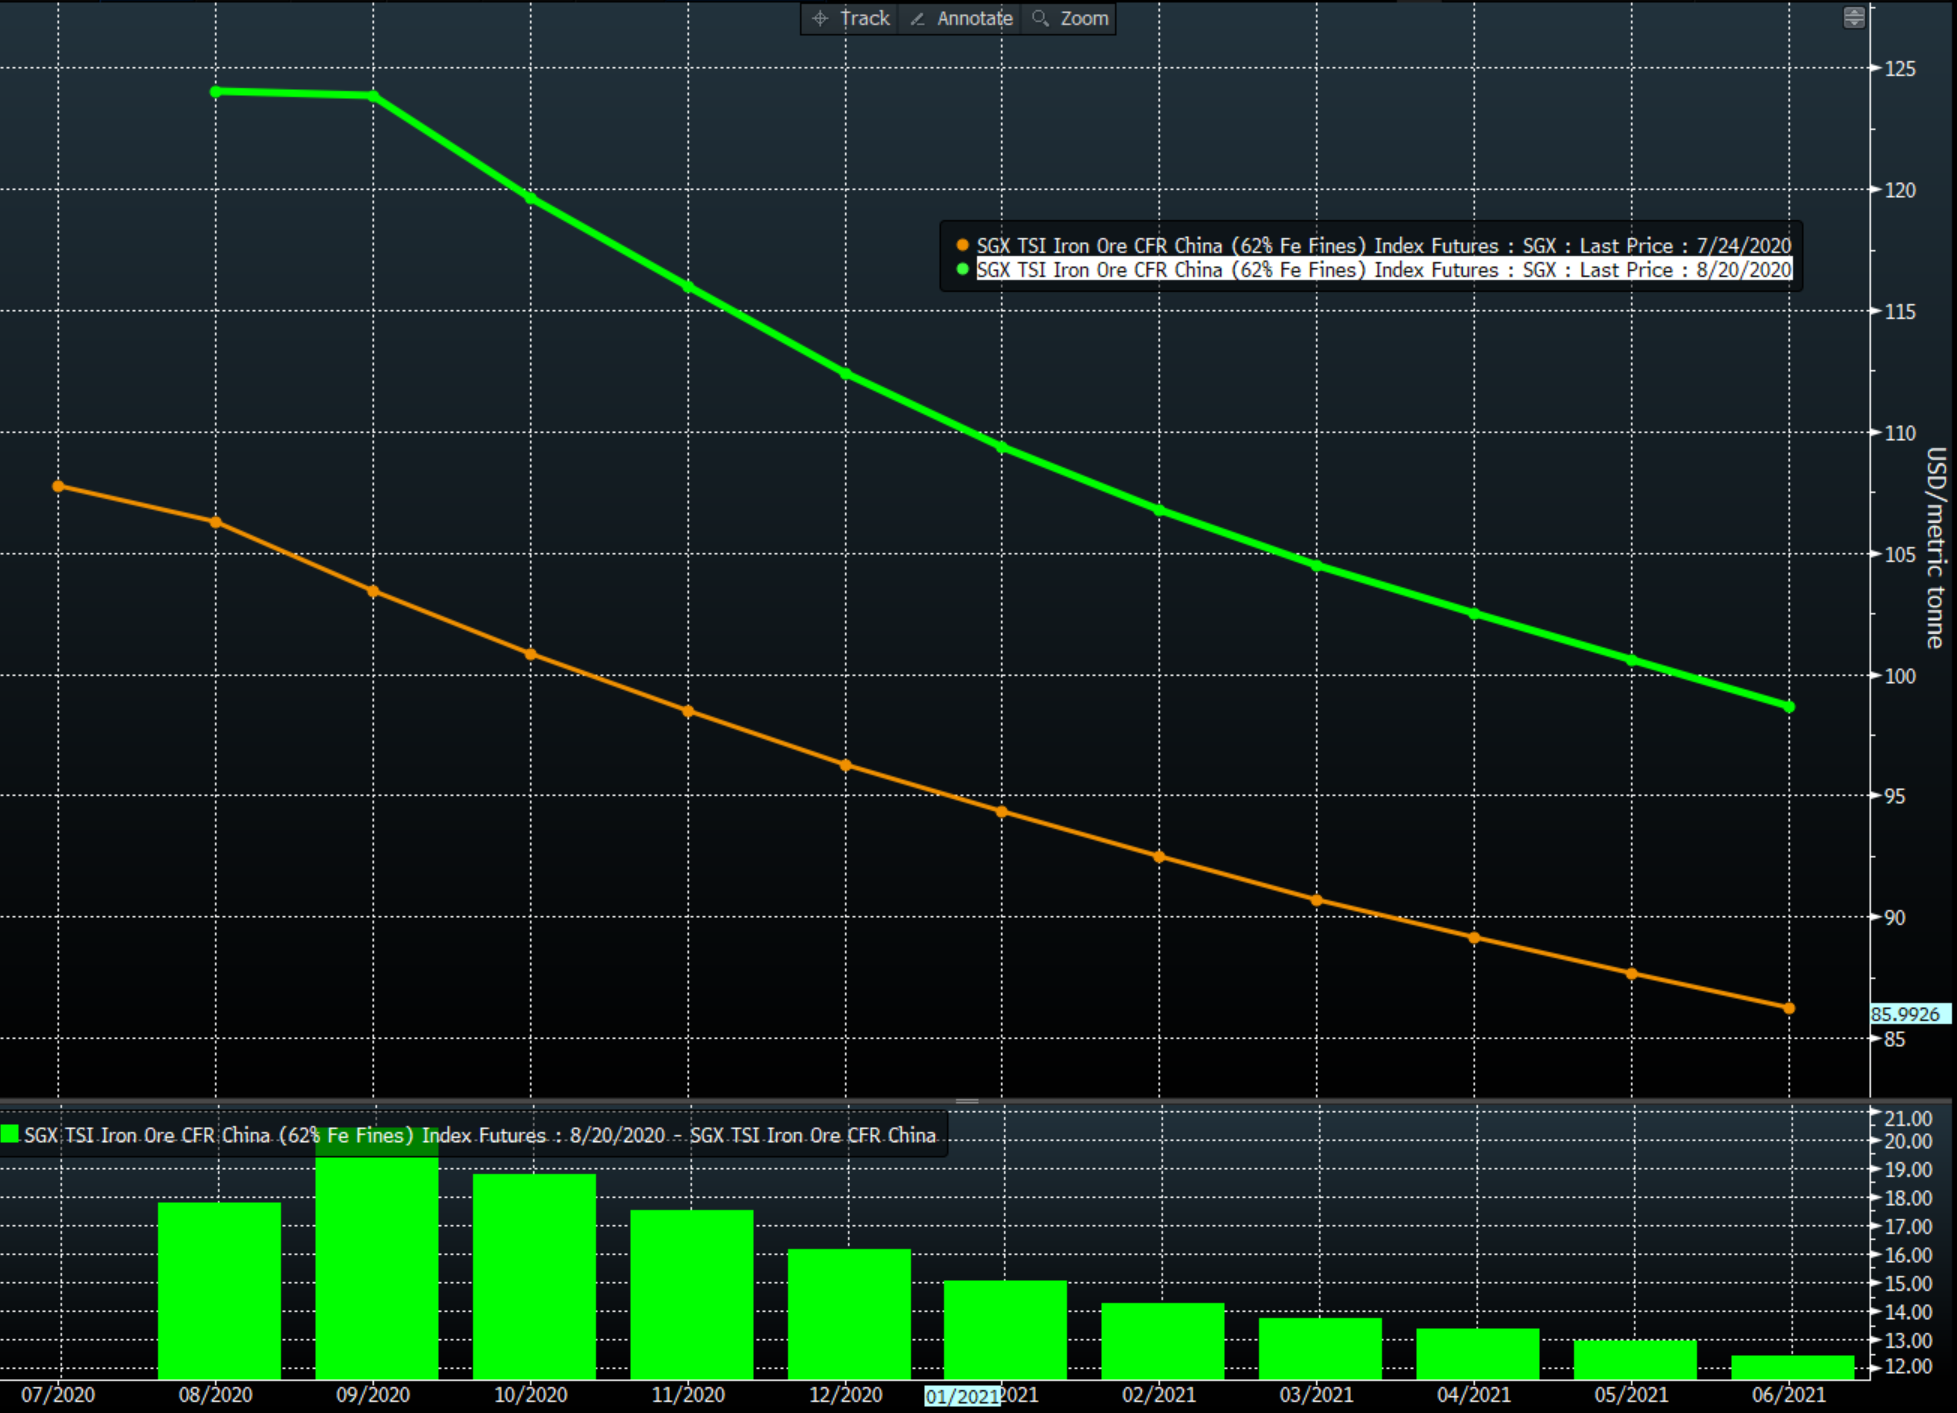
While iron ore futures are still in backwardation (future values below spot), traders have become more convinced that higher iron ore prices are sustainable. Indeed, the Chinese government just approved a vast number of airport and railroad projects for the second half of 2020, and a number of these will still be in process in 2021. Infrastructure spending in China has been estimated by some analysts to be on pace for a 10 percent rise in 2020 versus 2019. All that being said, things can change quickly. The Fed could slow down the money printing, China could have a hiccup that slows spending, and the world could fall back into more COVID-related shutdowns. In the meantime, the ferrous futures are in a very steep contango (higher prices in future months versus spot) here in the U.S. Note this chart that is the spread of the second month HRC contract with the 6th month:
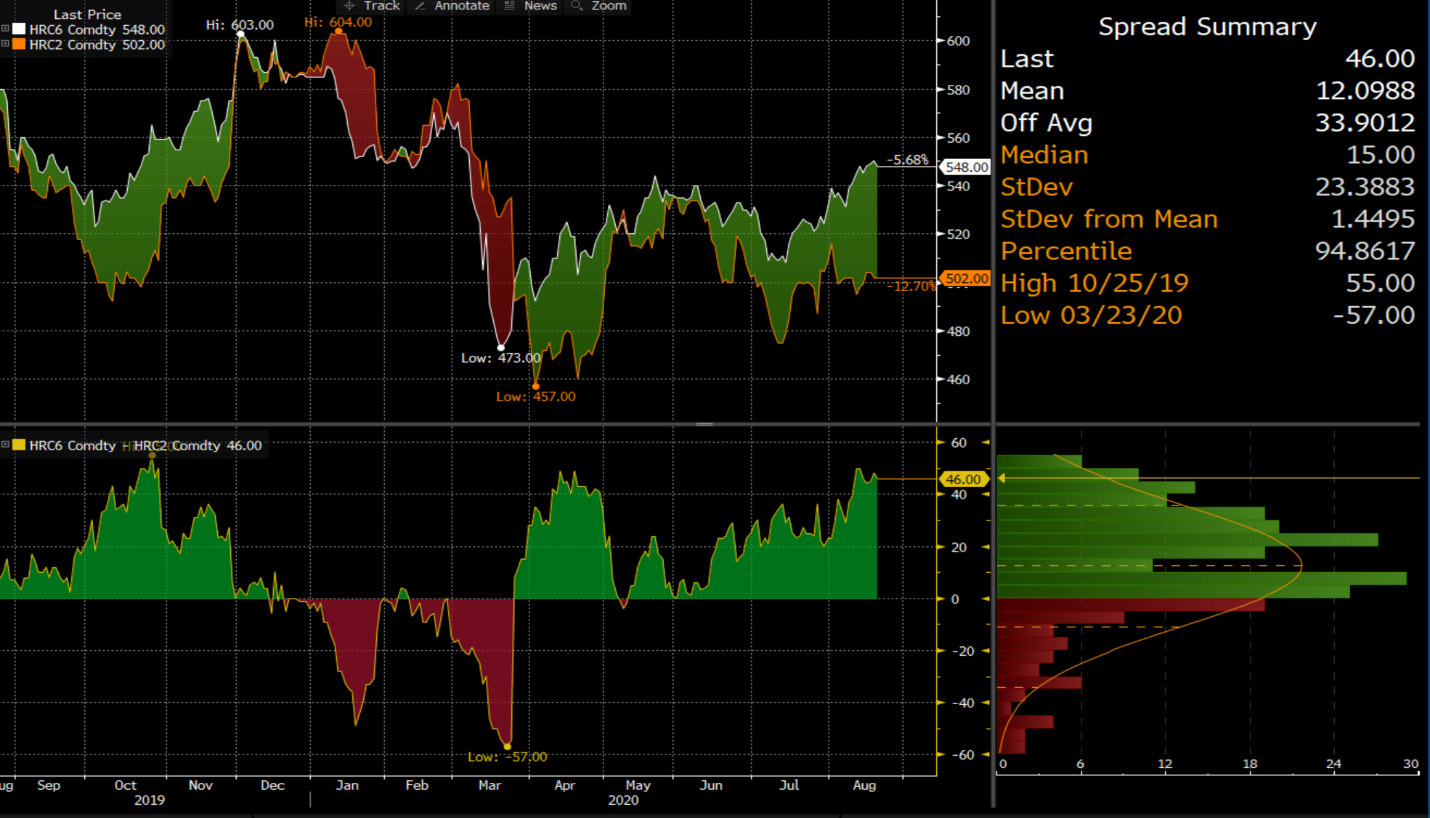
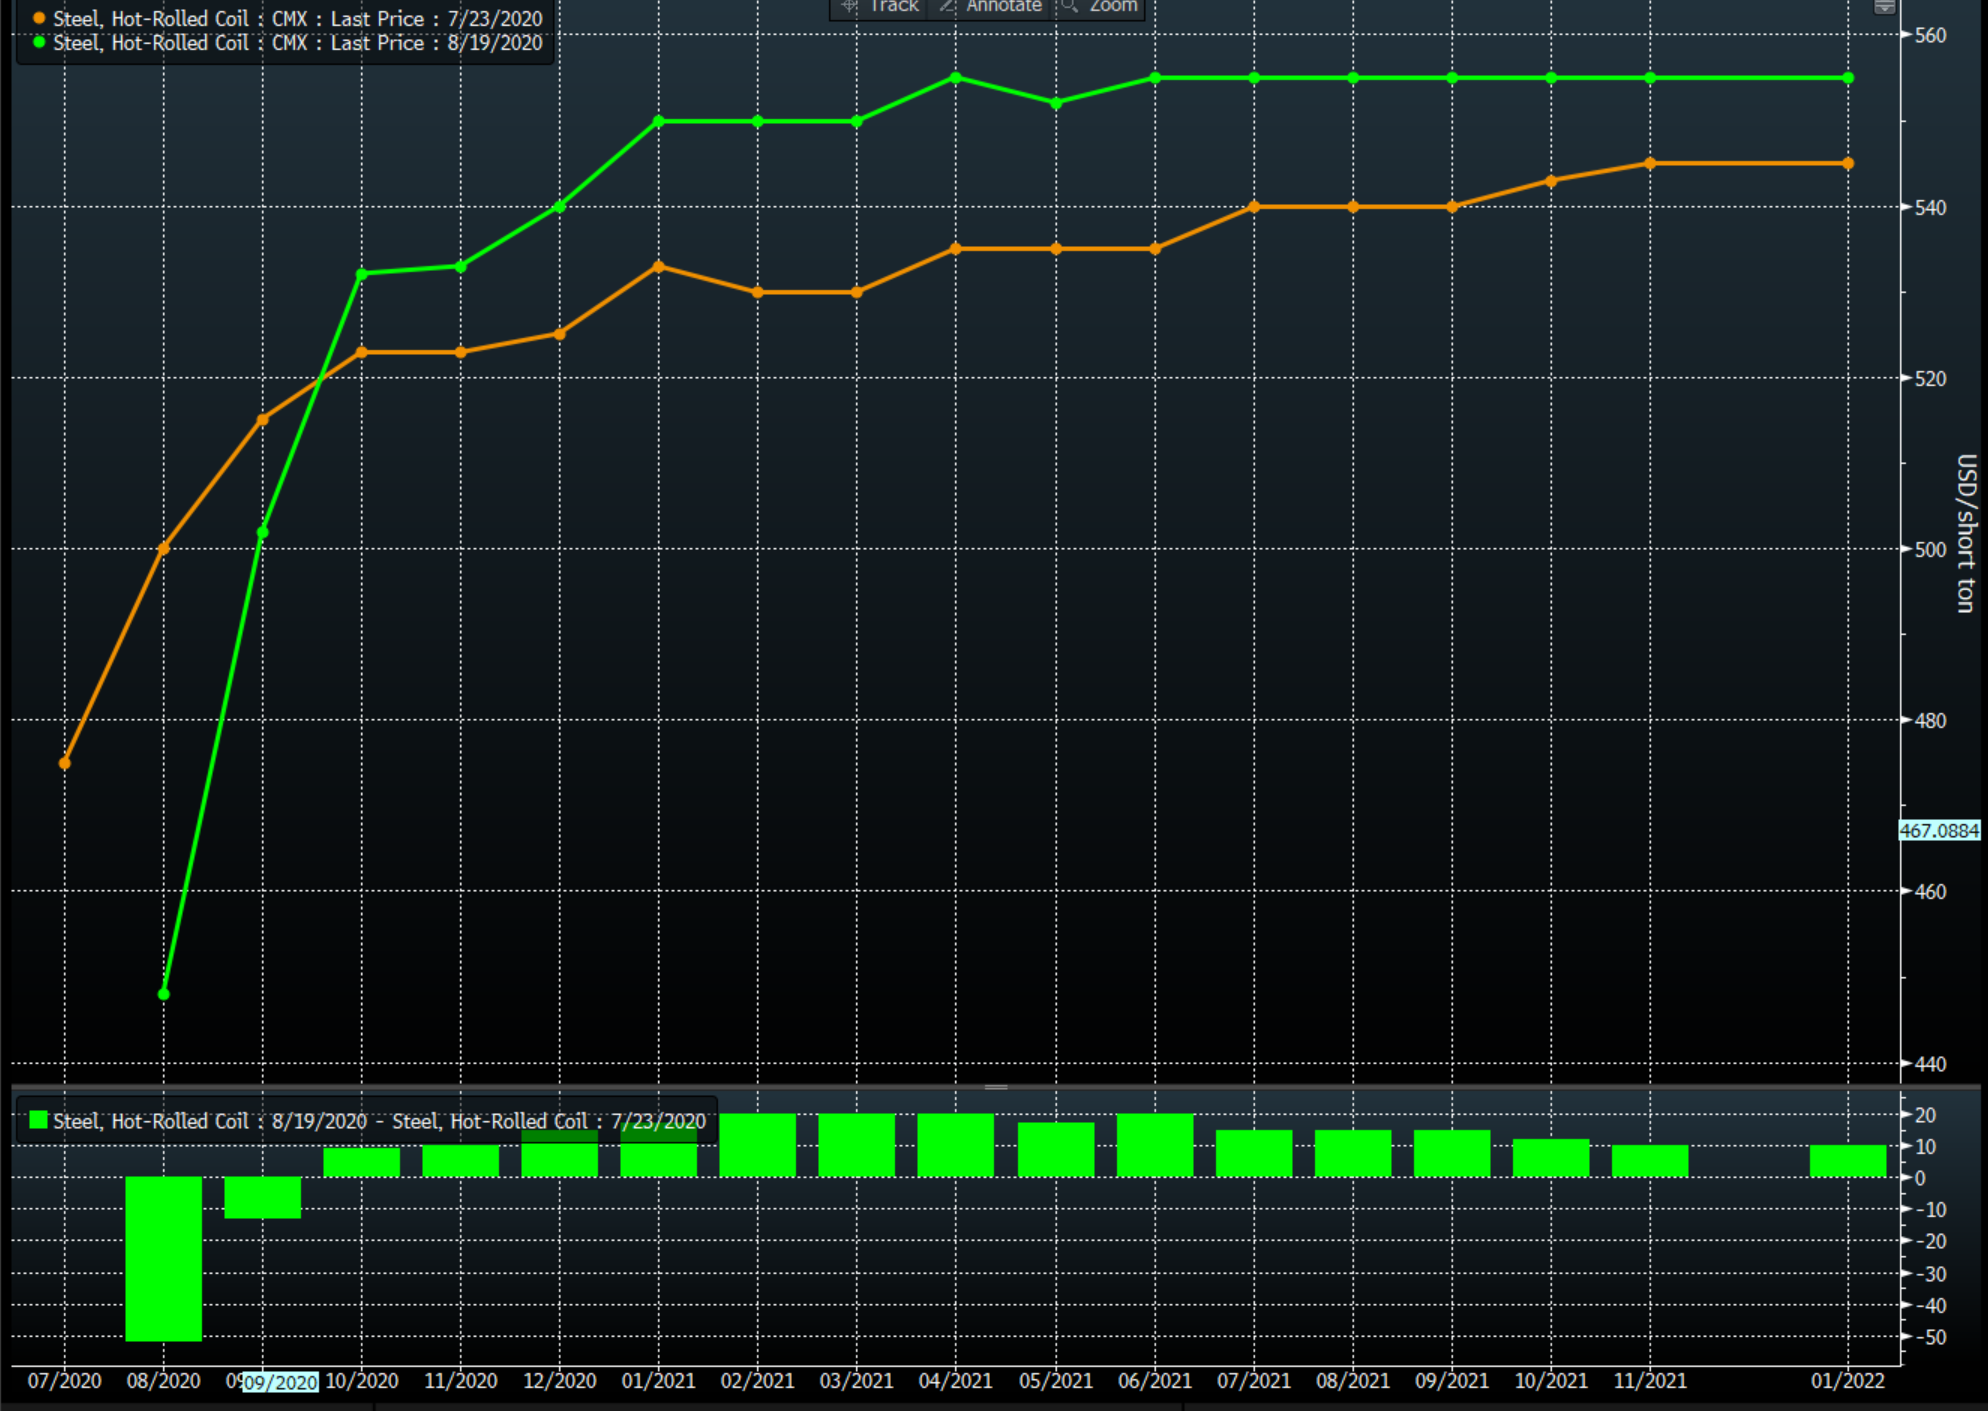
You can tell that it is uncommon to see the contango this steep—and the chart would look similar even if we extended it to five years. Contangos rarely exceed $50/ton between the 2nd and 6th months. Thus, the futures market is expecting prices to rise. What could change this? Sellers could come into the market to hedge physical buys that they have done recently. Some companies do this to decrease the risk in their business. We could also see another bump up in virus cases as students return to school, which causes fresh shutdowns and fears of a double-dip recession. That could cause the bullish sentiment to dissipate. As far as the HRC curve—we’ve shown this compared to one month ago for added perspective. The steepening of the curve has been very pronounced, with August getting hammered to the tune of $50/ton, but the rest of the curve beyond September actually moving up:
As far as scrap goes, we have seen the curve move higher over the past month, but not by much:
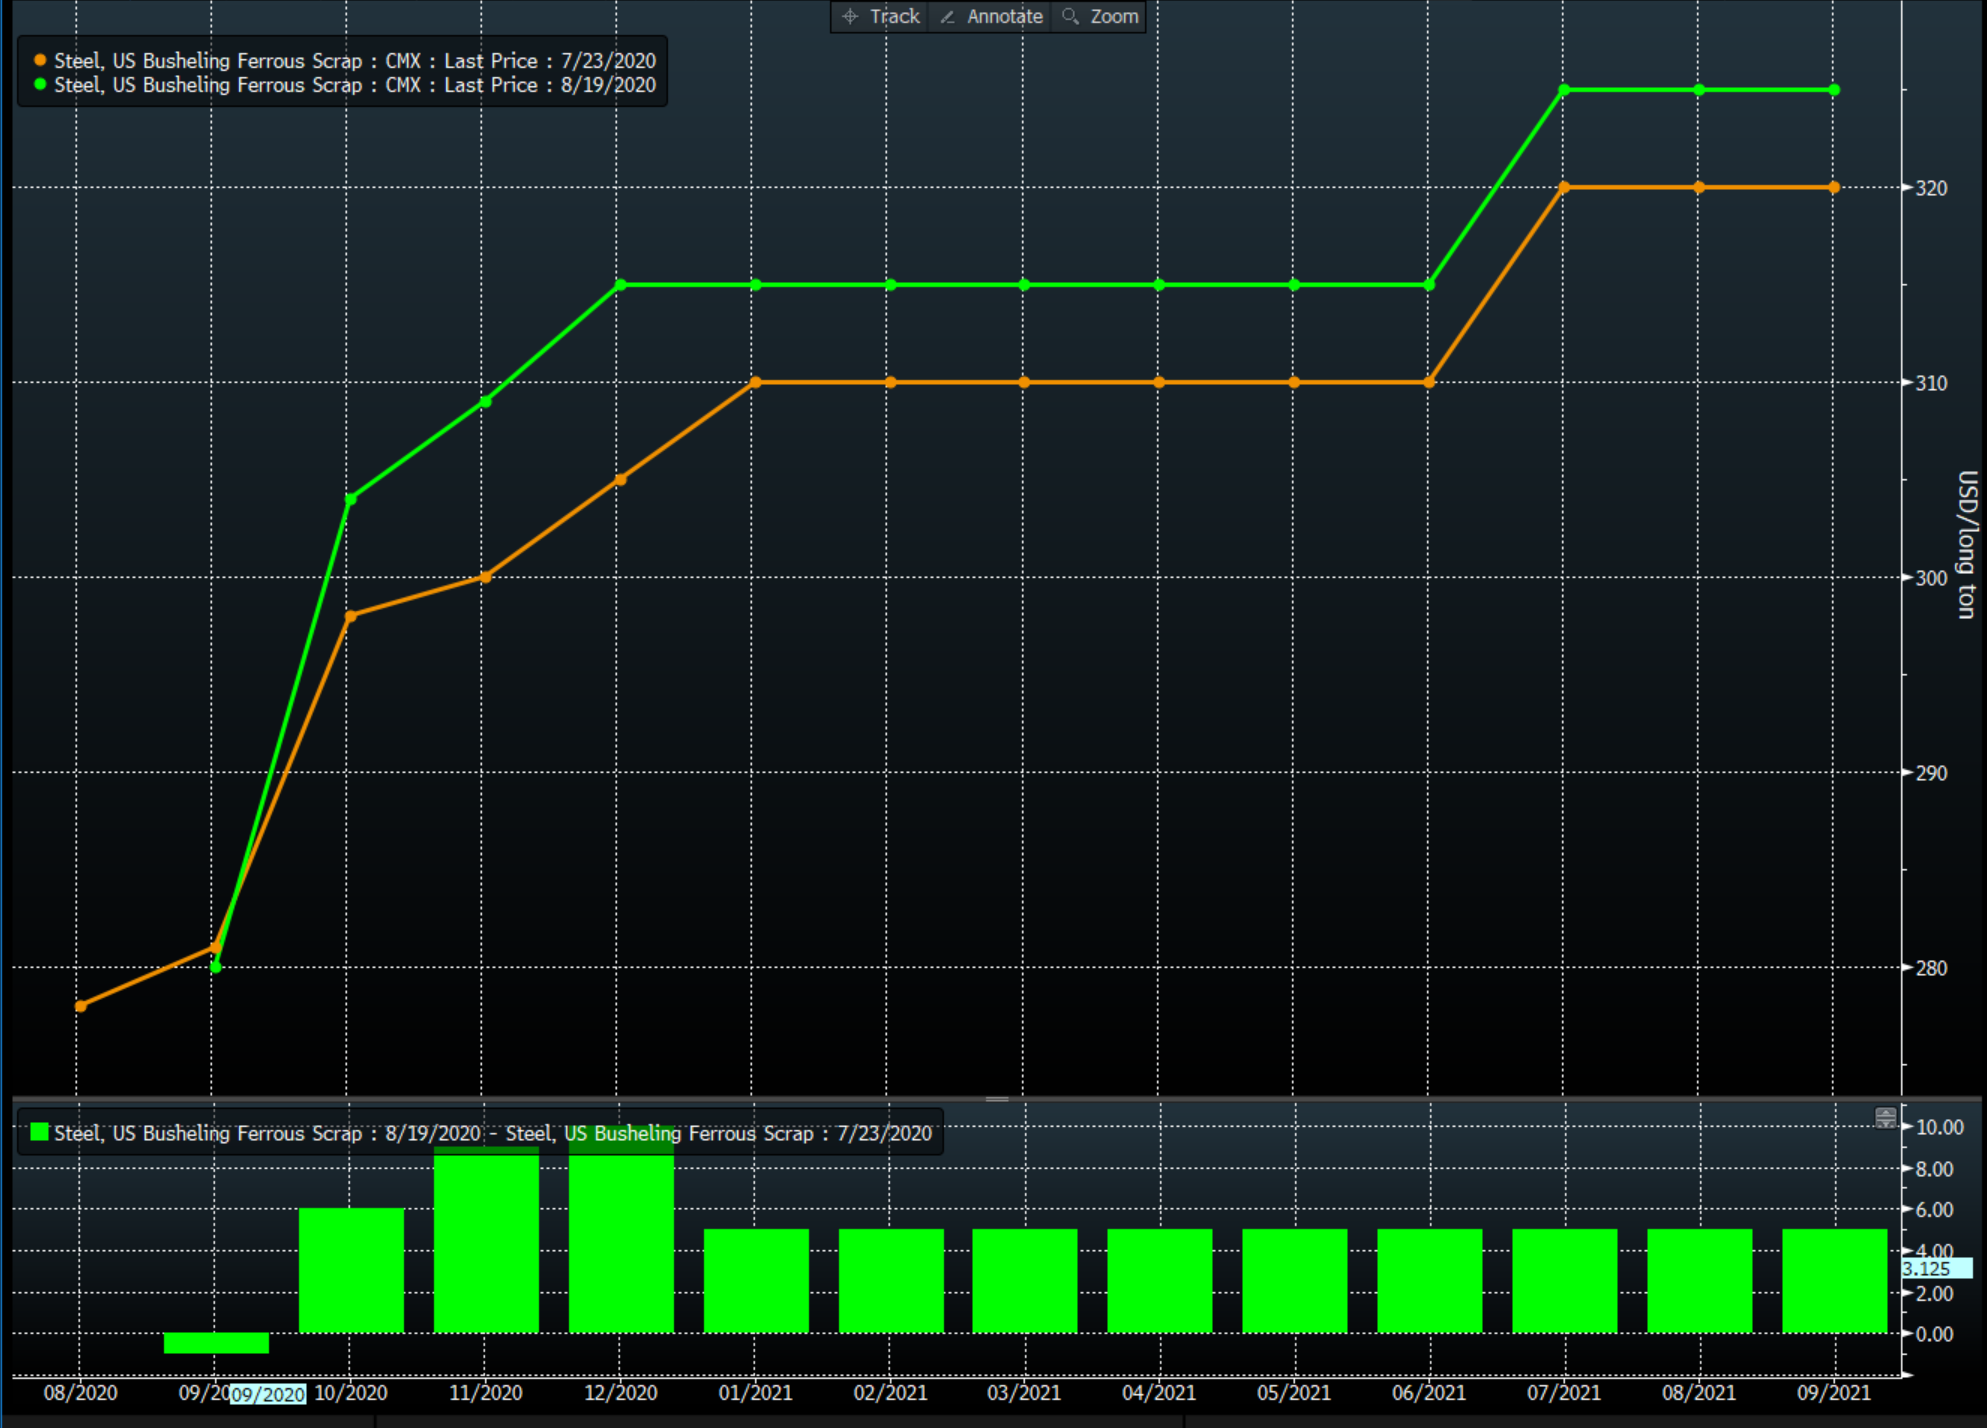
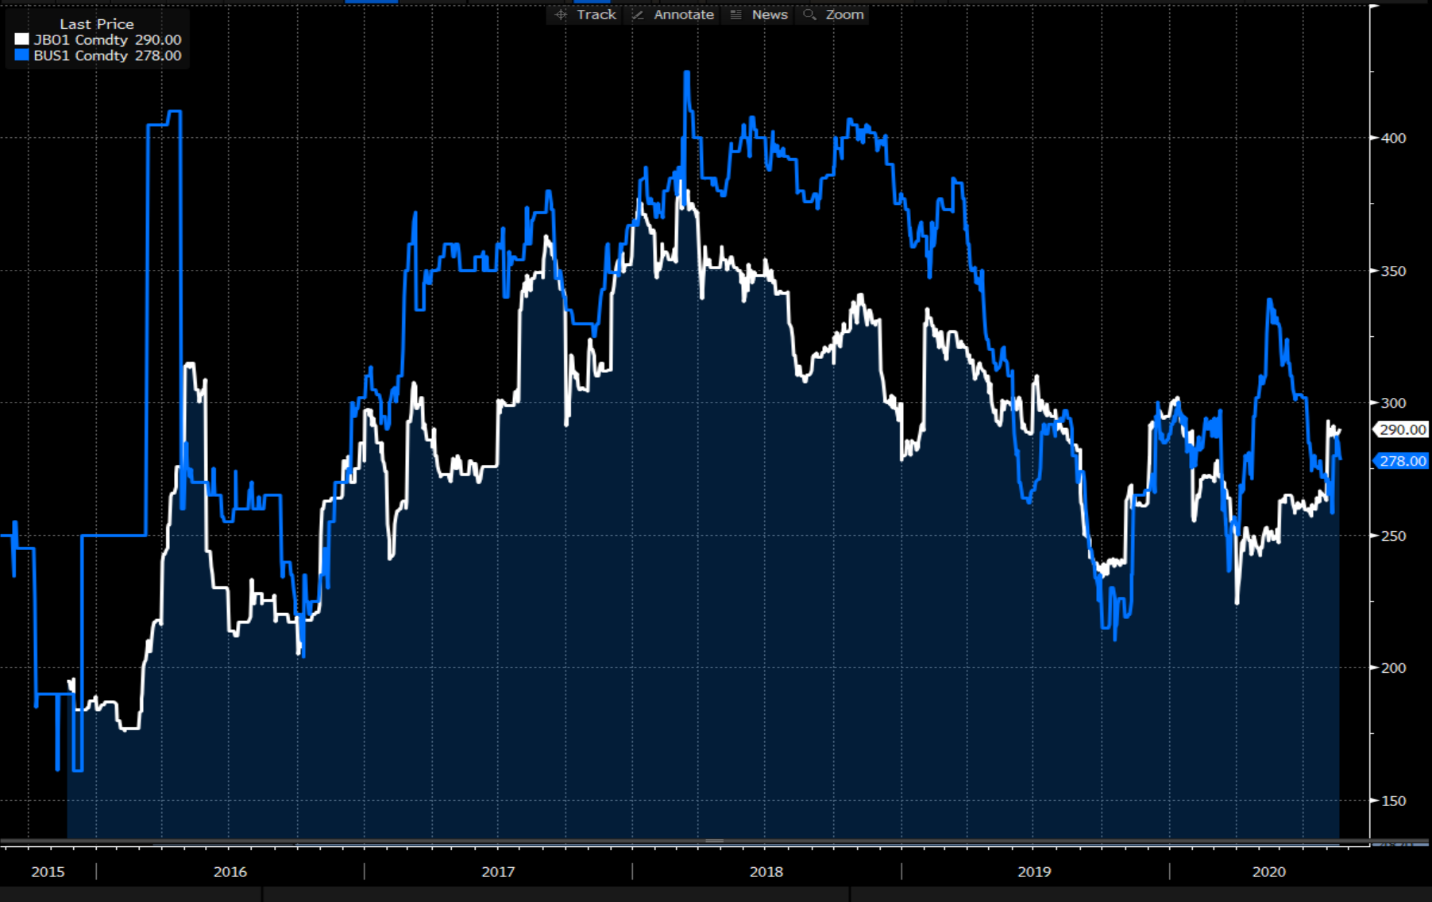
Meanwhile, the front month Turkish scrap contract has had a sharp runup and is now trading at a premium to the front month busheling contract. This is not a situation that normally lasts long.
On the volume front, HRC volumes pulled back somewhat in July to a bit over 200,000 tons trading. However, we would expect a big jump in August, as activity has been quite robust month to date. All told, there are certainly some macro developments that could cause some more pronounced inflation. It remains to be seen if it will actually play out in the U.S. ferrous markets. With that, we will wrap up, and we hope everyone is staying safe and healthy.
Disclaimer: The information in this write-up does not constitute “investment service,” “investment advice” or “financial product advice” as defined by laws and/or regulations in any jurisdiction. Neither does it constitute nor should be considered as any form of financial opinion or recommendation. The views expressed in the above article by Metal Edge Partners are subject to change based on market and other conditions. The information given above must be independently verified and Metal Edge Partners does not assume responsibility for the accuracy of the information


