Prices

May 28, 2020
Hot Rolled Futures: More Muted Trading
Written by Jack Marshall
The following article on the hot rolled coil (HRC) steel and financial futures markets was written by Jack Marshall of Crunch Risk LLC. Here is how Jack saw trading over the past week:
Steel
There’s been more muted trading as the market reflects lower volumes and takes a more cautious wait-and-see approach.
Lately the focus in HR futures has been on the latter half of 2020 as most of the volume trading has occurred in both Q3’20 and Q4’20. Their values have been fairly flat as they have been trading basically between $530/ST and $540/ST. This is up about $20/ST from May 1, but is still well below the $565 to $575/ST region they were valued at back on March 2 just before the futures market turned lower. Trading volumes have ebbed somewhat as hedgers have been more cautious. Current Q3’20 and Q4’20 prices have recovered about 42 percent and 33 percent from the beginning of March, leaving many folks sidelined as they wait for better levels to execute. This month the forward curve has flattened somewhat reflecting a more neutral expectation. This is likely in part due to the slowing rate of increase in the index to levels shy of $500/ST and the shifting expectations in the BUS prime scrap markets.
Below is a graph showing the history of the CME Group hot rolled futures forward curve. You will need to view the graph on our website to use its interactive features; you can do so by clicking here. If you need assistance with either logging in or navigating the website, please contact us at info@SteelMarketUpdate.com.

Scrap
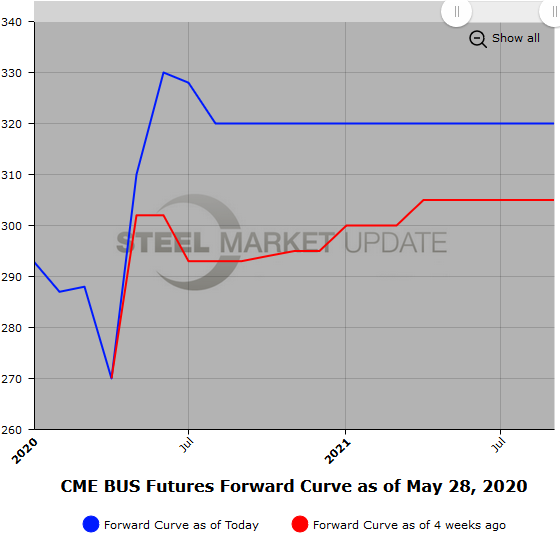
BUS futures trading has eased back this past week as expectations for Jun’20 have moderated. The latest activity puts it at between $320/GT and $330/GT, which pretty much reflects the range that the market has been chattering about for the Jun’20 settle. The futures curve is just slightly backwardated with the back half valued around $320/GT. Interestingly, the spread between HR and BUS settled at $157 ($467/ST and $310/GT), which is not sustainable. The market will look for it to retrace from the $233 that it settled at in April.
Below is another graph showing the history of the CME Group busheling scrap futures forward curve. You will need to view the graph on our website to use its interactive features; you can do so by clicking here.


