Product

May 14, 2020
Ferrous Futures: Busheling and Hot Rolled Futures Continue Higher Despite Massive Risks
Written by David Feldstein
SMU Contributor David Feldstein is president of Rock Trading Advisors (davidfeldstein@rocktradingadvisors.com, twitter @TheFeldstein). In addition to market analysis, RTA provides price risk management not only for ferrous products, but also base metals, energy and interest rates. RTA also trains sales staff and creates the infrastructure necessary for firms to offer their customers fixed pricing on physical sales.
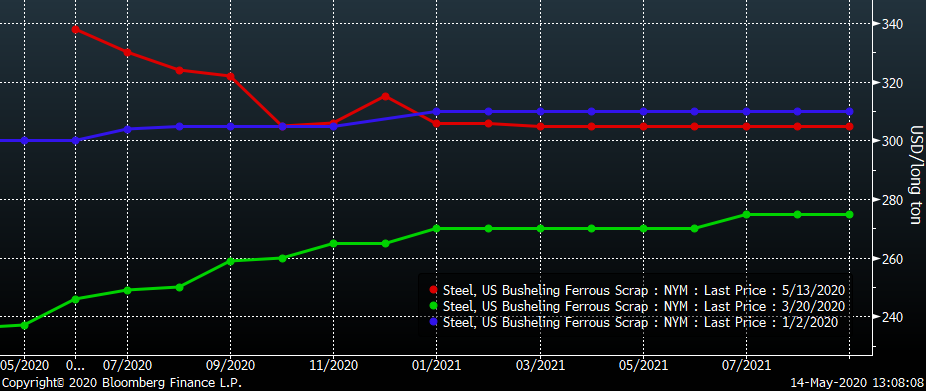
The amazing run in CME busheling has continued to reach new highs after the May future settled +$37 at $310. The curve below shows a flat curve around $300 at the start of the year (green). As markets sold off and COVID exploded, the curve crashed with June trading as low as $220 before rocketing back to last night’s settlement (red) at $338. The curve has shifted into a steepening backwardation (downward sloping).
CME Busheling Futures Curve
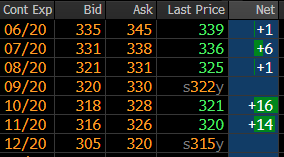
This is a snapshot of the CME busheling futures market today around mid-afternoon with June futures pricing in another +$30 move. The Big Three are set to reopen their factories on Monday, which should help ease the busheling shortage. The knock-on effects of their reopening will keep us all on our toes.
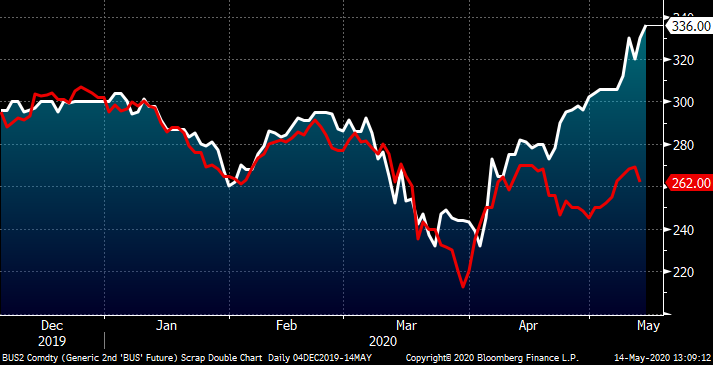
The tightness in busheling has caused all kinds of market distortions, such as the sharp divergence between busheling and Turkish scrap.
Rolling 2nd Month CME Busheling Future (white) & LME Turkish Scrap Future (red)
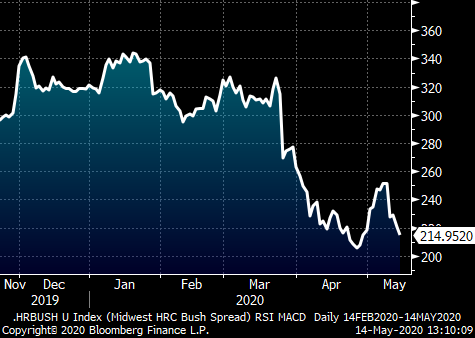
Or the sharp drop in the spread between Midwest HRC and busheling. Who will be the one to profit from buying the LME Turkish scrap futures and selling the CME busheling futures? What will EAFs do to recover their profit margin? Will they raise flat rolled prices? Will they look to alternatives to busheling such as DRI, pig iron, etc.? An article earlier this week noted an anonymous Indiana recycler talking about $400 busheling in June. Likely talking up their book, I wonder if busheling can sell at $400? It last traded that high in 2018 when HR was above $800. In the current environment, how many service centers would dump their aged HR inventory at $400 to raise cash? With the last of the barges heading south in early June as the Illinois river closes, will busheling stuck in the Midwest accumulate forcing the price lower as the market shifts from shortage to oversupply? That’s a lot for busheling to overcome in the weeks ahead, but this rally horse has been the clear-cut champ of 2020 and might have a race or two left before heading to the glue factory.
CME Midwest HRC Minus Busheling Spread (Rolling 2nd Month)
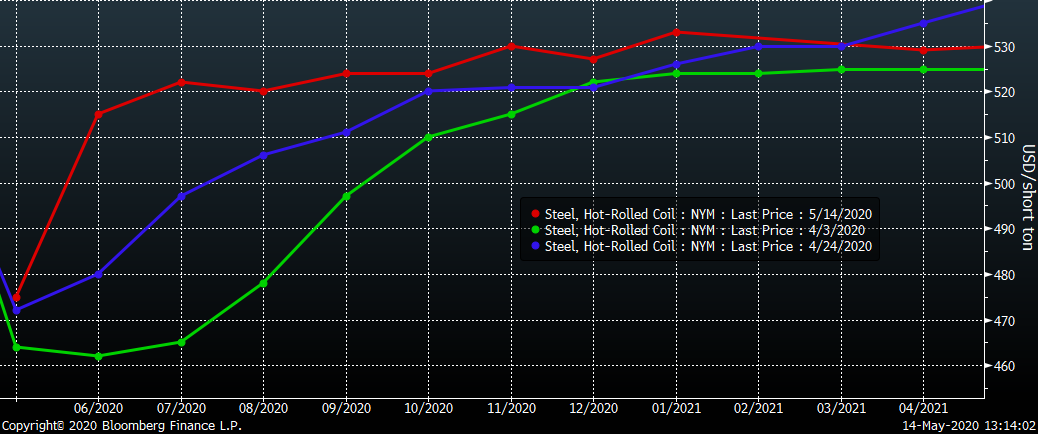
The CME Midwest HRC futures curve has rallied sharply in the front of the curve while the long end has remained in the same general $520-$530 area for most of the last six weeks.
CME Hot Rolled Coil Futures Curve $/st
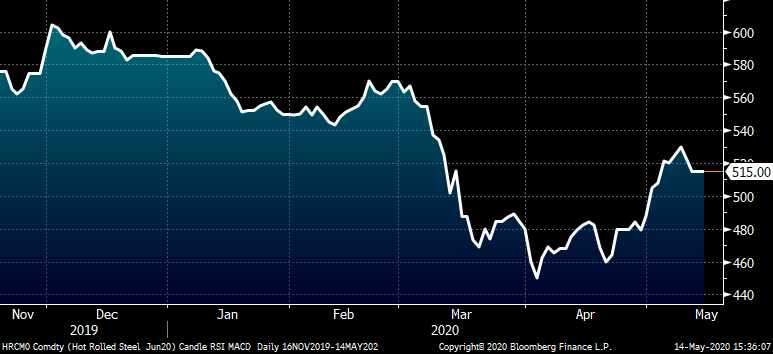
After collapsing from $560 on March 1 to a low of $445 on April 3, the June HRC future remained range bound between $460 to $480. Then on April 30, the June future broke out of its range in response to ArcelorMittal’s price increase announcement. June traded as high as $534 last Friday as rumors circulated of a second price increase announcement. At $534, buyers are not only factoring in this second price increase occurring, but also that the mills will successfully capture the full amount of both increases. As stated above, the return of the Big Three brings with it the anticipation of the domestic mills supply-side response to the reopening of automotive manufacturing. With so much abrupt action taken in the wake of the outbreak, expect the unexpected and more unintended consequences to keep coming.
June CME Hot Rolled Coil Future
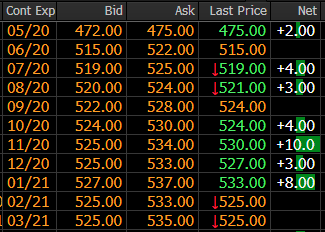
This is a snapshot of the CME Midwest HRC futures market today around mid-afternoon; $530 has provided consistent selling interest and resistance regardless of the month.
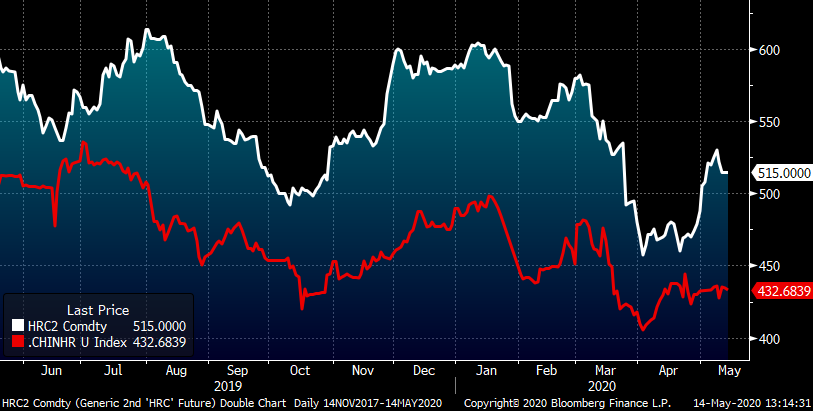
Forecasting the market is extremely difficult now with uncertainty at a fever pitch. In addition to domestic demand and supply issues, the global picture is starting to look more relevant than it has in years. This chart shows the premium of CME Midwest HRC over Shanghai Futures Exchange Chinese HRC expanding like scrap above indicating a broader premium in the U.S vs. ROW.
Rolling 2nd Month CME Midwest HRC (white) & SHFE Chinese HRC Futures (red) (both $/st)
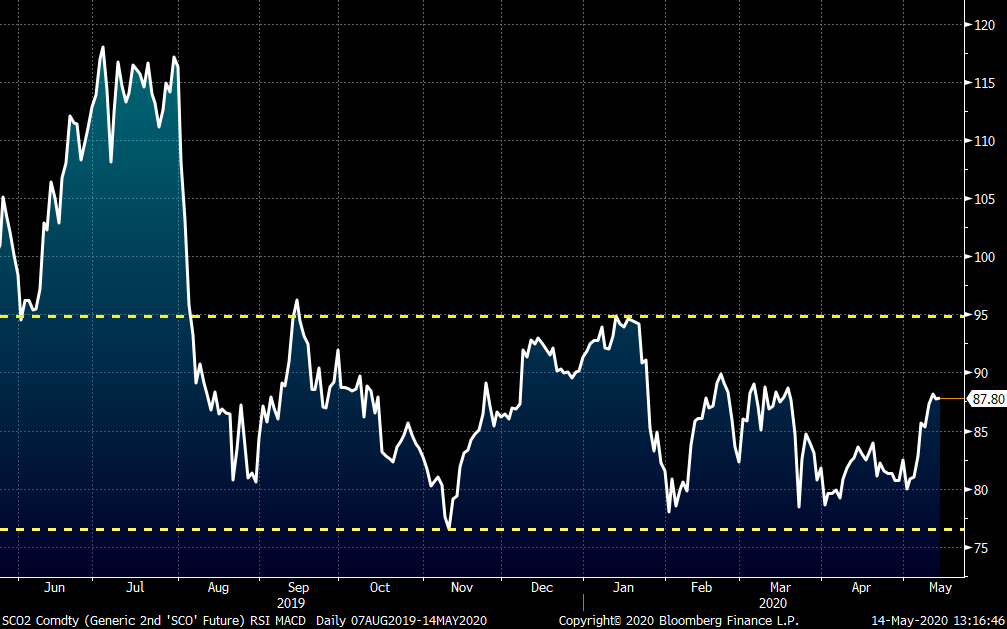
Iron ore futures have been rallying in recent days, but have remained range bound since last August.
Rolling 2nd Month SGX Iron Ore Future $/mt
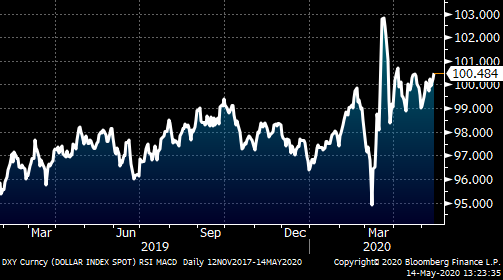
A strong U.S. dollar is a negative for commodities, but the dollar index, heavily weighted by the cross vs. the euro and Japanese yen, fails to tell the whole picture.
U.S. Dollar Index
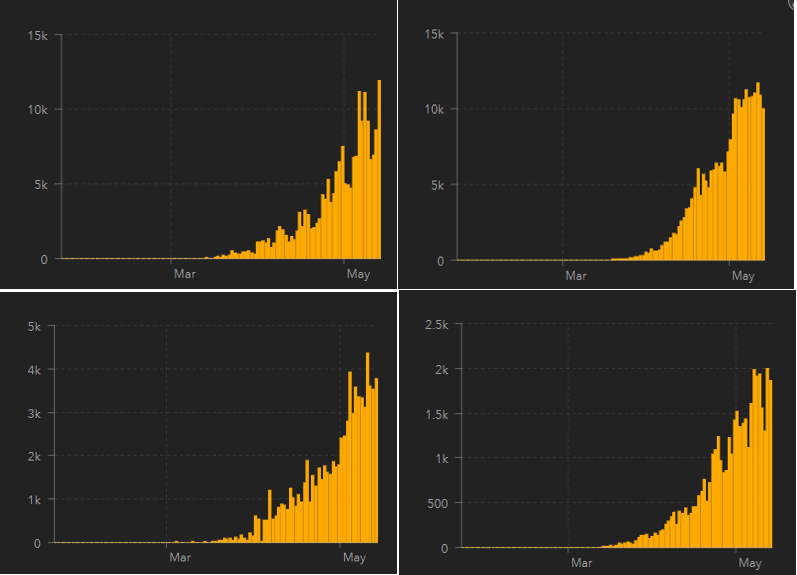
We are in a global recession and four countries currently experiencing exponential waves of COVID infections include Brazil, Russia, Mexico and India. Each play a strong supporting role in steel and manufacturing.
New Daily COVID Cases (clockwise Brazil, top left, Russia, Mexico and India)
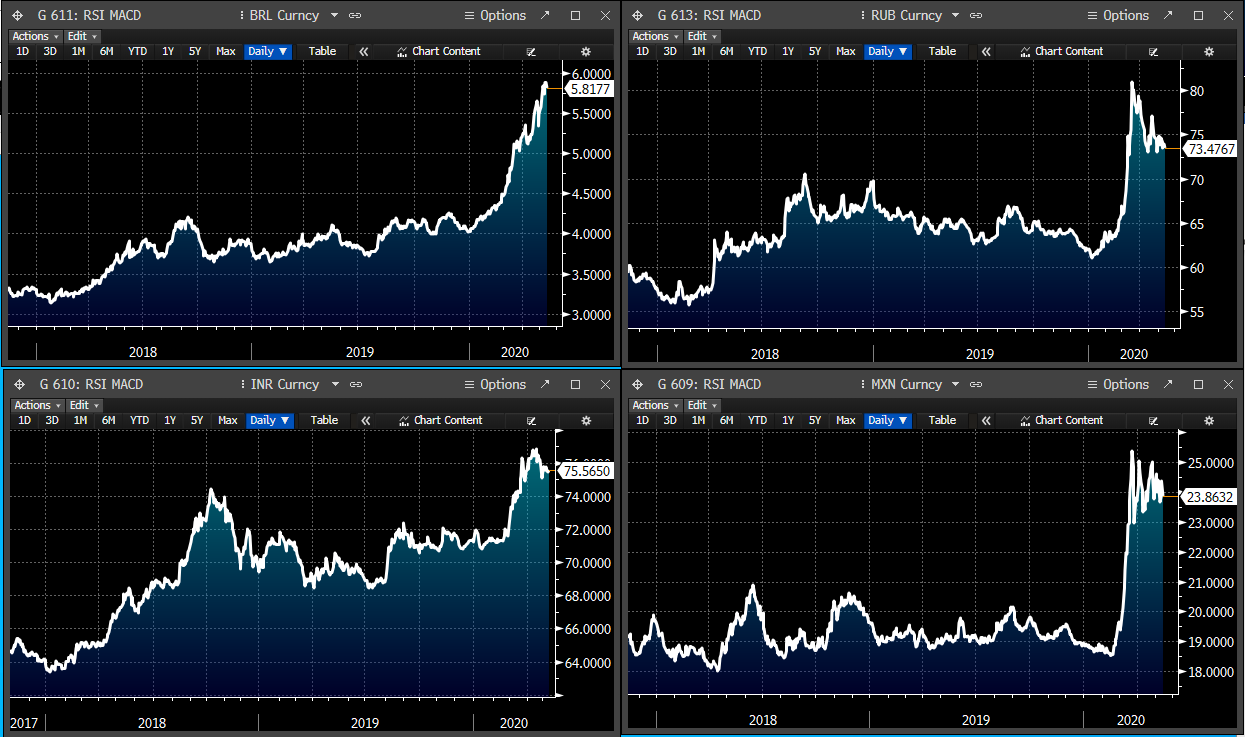
Moreover, their currencies as well as the Turkish lira, have been decimated with Brazil’s president and economic minister going as far as to warn about the country’s imminent economic collapse. Past currency defaults have sent massive shockwaves through the global economy. It would have an even greater effect considering the weakened state the pandemic has left the world in. The consequences of another economic shock are unimaginable right now, making the threat of imported steel from these countries seem like a second order concern. Global pricing, in addition to the demand shocks and temporarily idled supply returning, will add pressure to any domestic hot rolled price rally.
Clockwise Brazilian Real (top left), Russian Ruble, Mexican Peso & Indian Rupee
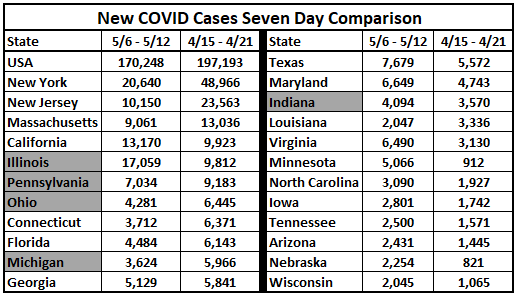
Our nation is polarized on how to manage the COVID pandemic. As states reopen, the idea of a second wave this fall is very concerning, however considering where we are at with current daily infections, there is a very real risk that this initial wave keeps going and the virus resumes its exponential growth. In my last SMU article, I provided a table of new COVID cases over the one-week period from 4/15 to 4/21 (states with Midwest flat rolled mills highlighted in grey). This table compares those cases with the cumulative number of new COVID cases over the one-week period from 5/6 to 5/12. Some states have improved while others have seen their cases worsen. Regardless, there is still an enormous number of new cases across the country.
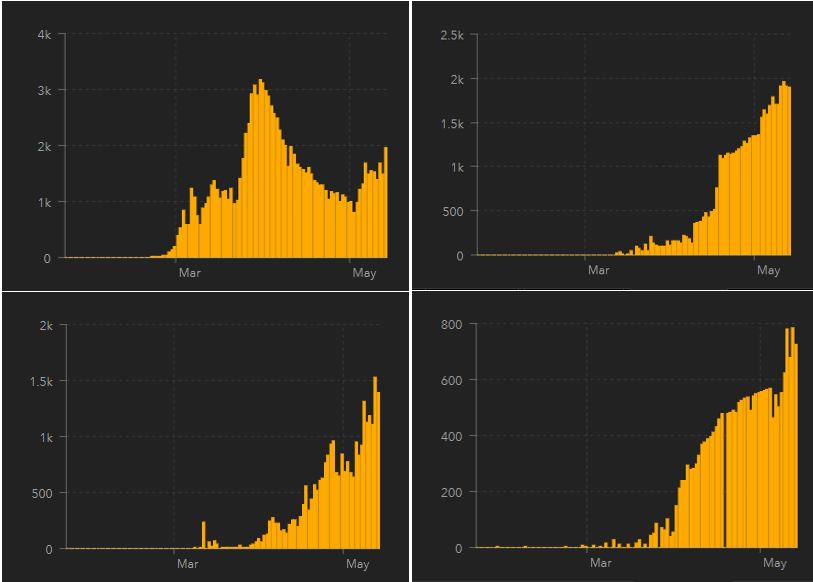
These charts of new daily COVID cases in Iran, Saudi Arabia, Qatar and U.A.E. show exponential growth in infections. Iran is in the upper left corner and you can see after they successfully “flattened” their curve, they have had a resurgence in new cases while Saudi Arabia, Qatar and UAE experience their first wave. I don’t know why this is occurring, but perhaps the reason has to do with Ramadan, which started on April 23. Mass gatherings have been the breeding ground for outbreaks and exponential growth in cases, so perhaps gatherings and travel related to Ramadan are the root cause of their outbreaks. This begs the question, will we see a similar outcome as Iran with the reopening of our economy? If this is our future, what measures will be taken to stop the spread at that point and what will that do to the economy?
New Daily Cases (clockwise Iran, top left, Saudi Arabia, Qatar, UAE)
This is very scary stuff. Hope for the best, but plan for the worst. Don’t underestimate the downside price risk that remains embedded in the steel industry and U.S. economy.
Disclaimer: The content of this article is for informational purposes only. The views in this article do not represent financial services or advice. Any opinion expressed by Mr. Feldstein should not be treated as a specific inducement to make a particular investment or follow a particular strategy, but only as an expression of his opinion. Views and forecasts expressed are as of date indicated, are subject to change without notice, may not come to be and do not represent a recommendation or offer of any particular security, strategy or investment. Strategies mentioned may not be suitable for you. You must make an independent decision regarding investments or strategies mentioned in this article. It is recommended you consider your own particular circumstances and seek the advice from a financial professional before taking action in financial markets.


