Market Data

May 7, 2020
CRU: V U L—Demystifying Recession Shapes
Written by Jumana Saleheen
By CRU Chief Economist Jumana Saleheen, from CRU’s Global Steel Trade Service
Many are still discussing what type of recession will ensue following the Covid-19 pandemic. Will it be U-, V- or L-shaped? Different people may refer to the same shape to mean different outcomes. To bring clarity to this issue, this insight sets out the standard economic definition of each type of recession. The pandemic is forecast to give rise to different shaped recessions in different countries. For the world economy, we forecast a U-shaped recession—defined as a permanent loss in the level of world GDP, but no change in the long-term growth rate of world GDP.
Recession Shape Defined by What Happens to the Level and Growth Rate of Output
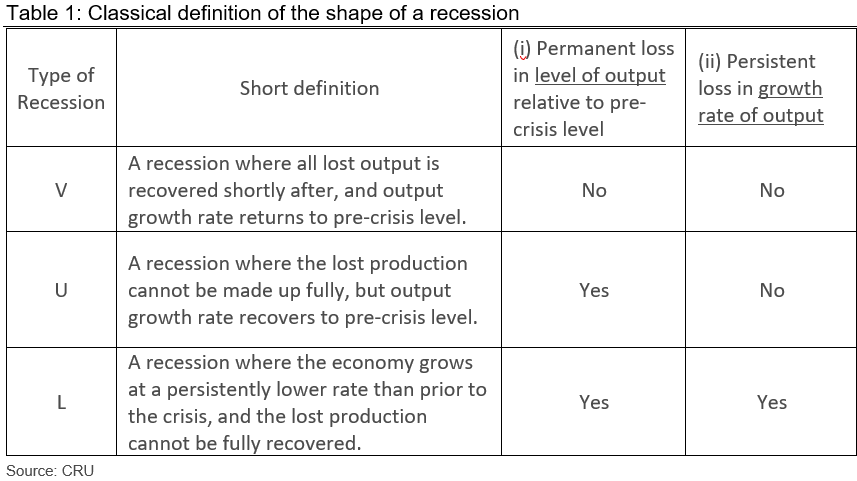
When assigning a letter to a recession, it is important to be clear how we define each letter represented recession. Most common ones are V-, U- and L-shaped. They are defined in Table 1 and illustrated in Figure 1. Less frequently used is the double-dip recession, which is referred to as W; and a tick-mark recession, which includes a sharp downturn followed by a prolonged recovery. However, the latter two are variants of the three main types of recession, which we focus on here.
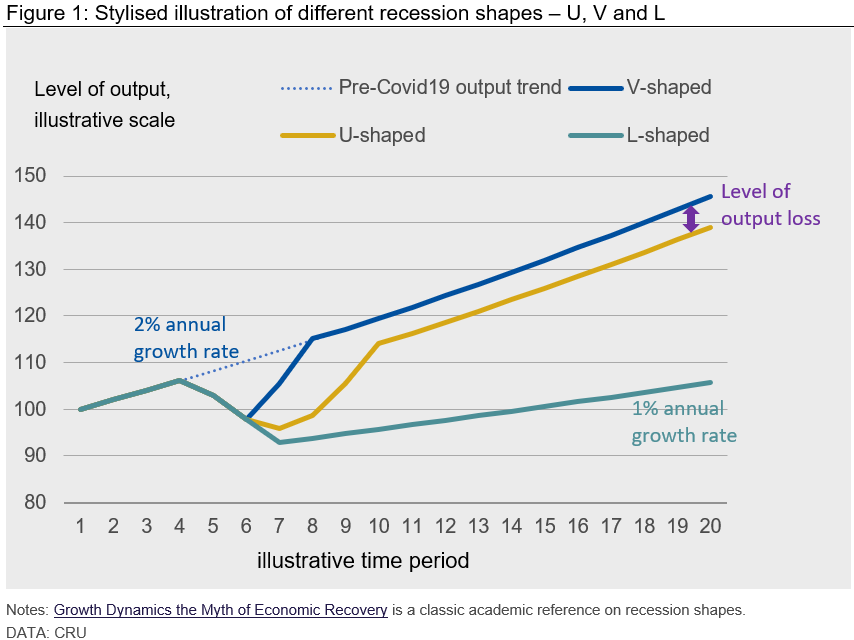
There are two factors which help differentiate the three types of recession: whether there is a permanent loss in the level of output and a persistent fall in the growth rate of output.
Factor 1: Whether the recession causes a permanent loss in the level of output.
This happens when the missed spending during the downturn is not fully made up during the recovery phase. A good example of a permanent loss in output level is when a haircut missed in March is unlikely to be followed by two haircuts in April – in that sense some expenditure is lost permanently.
Factor 2: Whether the growth rate of output returns when the crisis is over.
If the economy sees a permanent loss in its level of output but can return to its pre-crisis growth rate in the medium term—it will be called a U-shaped recession. To continue with the example above, this occurs when the missed spending (e.g. haircuts) is not made up, but will continue at the usual frequency once the pandemic is behind us.
By far the worst shape of a recession is the L-shaped recession. Not only will an economy see a permanent loss in its level of output, but it will also see a persistent fall in its growth rate. This occurs when the crisis leaves lasting structural damage on the economy’s supply side. Capital inputs, labor and productivity are repeatedly damaged. For example, unemployed workers become disengaged from the labor market. The economic environment lowers innovation and investment such as the entry of new business.
Recession Shape: One Size Does Not Fit All
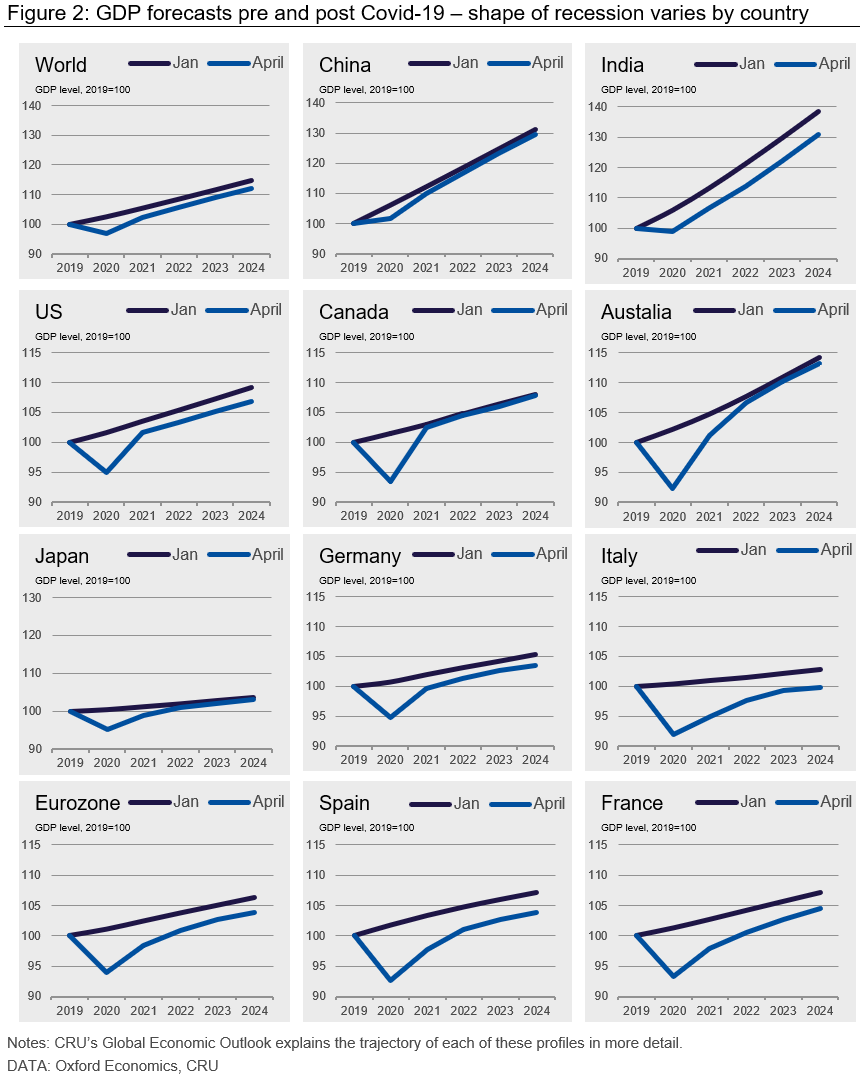
With definitions out of the way, we now turn to the shape of the recession following Covid-19. Figure 2 illustrates our forecasts for a selected group of countries. The latest April forecast is compared to our January forecast (which is pre-Covid-19). Across countries Covid-19 has led to a large destruction in economic output (April lines lie below the January lines).
In some countries, such as Canada, there is a sharp initial drop in output level. But then output returns to the level that we had expected in January. Using the definitions in Table 1, this would be a V-shaped recession, as there is no permanent loss in the level of output. The April line returns to the January output line by the end of 2021. Indeed, as noted in the Harvard Business Review, Canada also experienced a V-shaped recession during the global financial crisis.
Australia and China look close to a V-shape, but technically they are U-shaped. That is because the gap of output level between April and January forecast persists till the end of our five-year forecast time horizon. According to our definitions, we label this a permanent loss in output level. Most countries are expected to follow a U-shaped recession.
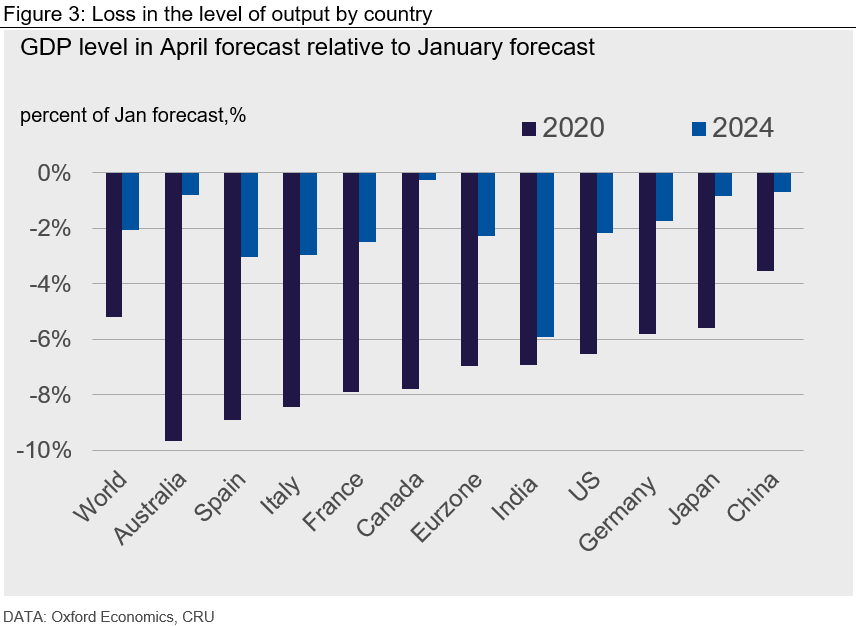
The loss in output level is more visual in Figure 3, comparing our April forecasts for output level to January’s (pre-Covid-19) at two points in time, 2020 and 2024. The loss in output level in 2020 is significant. Even in five years’ time, till 2024, the loss in output level cannot be made up by all countries. Canada, China and Japan are successful in making up most of the loss. In Europe, the loss in output level by 2024 is the largest. It is also significant at 2 percent in the U.S.
It is probably too early into the Covid-19 downturn to consider which economies might face an L-shaped recovery. This will become clearer once we can ascertain which economies are being scarred by Covid-19. During the global financial crisis, Greece was categorized as L-shaped. If that were to happen, we would see the distance between the latest growth forecast and the January line widen over time, as lost output continuously grows.
Hallmarks of a Lockdown: “Sudden Stop,” Strong Recovery
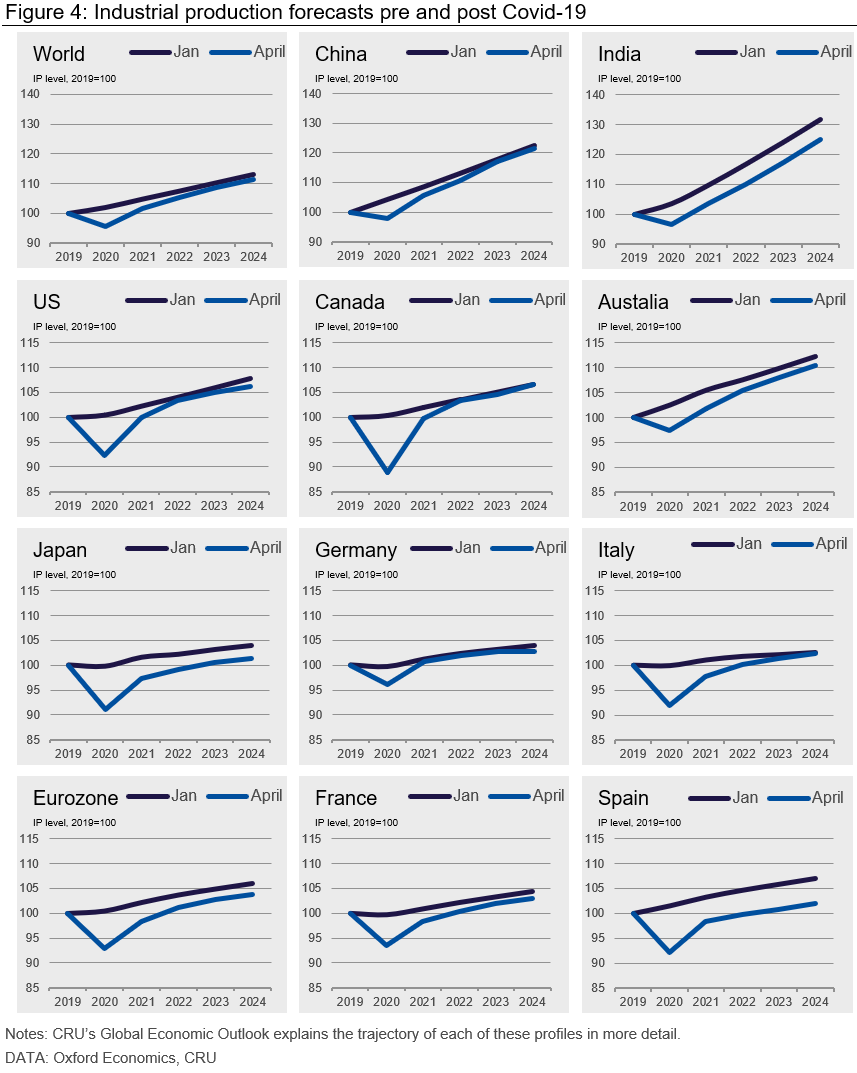
A defining feature of the pandemic recession is the sharp economic downturn in the first half of 2020, which can be seen in Figure 2 and Figure 4. Some have referred to this sharp fall in activity as a “sudden stop” – a phrase normally used to describe how emerging market economic activity is forced to stop when foreign funding (or capital inflows) dry up at short notice. It is the steep drop in output within a matter of weeks of lockdown that defines the pandemic induced recession. That fall in activity occurs as social distancing makes the closure of certain types of business mandatory, e.g. bars and clubs.
Once lockdowns end, we expect a strong bounce back in economic activity. Some businesses are expected to re-open and we envisage that consumers will be keen to make up for some of the spending they missed during lockdown (e.g. on durable goods, such as manufactured goods). However, this bounce back in growth is not forecast to be strong enough to recover all the output that was lost during the downturn. In other words, we forecast strong GDP growth rates later this year and early next year, but the level of output in most countries, does not return to pre-Covid-19 forecast level.
Social Distancing Hurts Services More Than it Hurts Industry
Figure 4 shows the corresponding fall in industrial production (IP) for the same set of selected countries. Two differences stand out relative to the GDP chart (Figure 2). First, the fall in IP in 2020 is larger than GDP – this is normal given that IP is historically more cyclical than GDP. Second, the fall in IP appears to be less persistent than the fall in GDP; the gap between the two IP forecast lines typically closes by 2024 (except for India and Spain). This highlights that Covid-19 is having less of a lasting damage on the industrial sector than it does on overall economy (as captured by GDP in Figure 2). That makes sense given that social distancing will have a longer lasting impact on the service sector of the economy, where people tend to be in close contact (e.g. in a restaurant) than it would on manufacturing.
Country Specific Factors Determine Recession Shape
The speed and shape of recovery will also depend on many country-specific factors. These can be divided into three categories:
Flexibility and resilience of the economy—The flexibility and dynamism of an economy is a well-known factor in determining how an economy rebounds from this crisis. For example, North America is known to have a flexible labor market, where the rates of hiring and firing of workers are higher than other countries. This flexibility allows an economy to bounce back quickly from a shock like Covid-19. Indeed, this flexibility is one reason why the U.S. recovered from the global financial crisis faster than countries in Europe. The resilience of an economy going into the Covid-19 crisis will also be important. Some countries in Europe entered the crisis on a weak footing, suffering from the impact of Brexit and rising protectionism from the U.S.-China trade war. That has left them vulnerable to the second shock.
The industrial and corporate structure of the economy—The industrial and corporate structures of an economy are also vital. The industrial structure varies across countries. Countries which are very tourism dependent – such as parts of Europe and South East Asia – will feel the pain more. Economies with a large service sector will fare poorly, given that measures of social distancing are likely to remain in place for a while. Countries with a large manufacturing sector, particularly automated manufacturing, will do better still.
The corporate structure and balance sheet will also drive recovery. Research confirms that companies with large cash balances weather crises better. Access to internal funds enables companies to continue to invest and gain a competitive edge over their competitors. This is particularly the case for young and small firms.
Government support—How much the government can support the economy through the crisis will also be important. Effective and generous furlough schemes, unemployment benefits, business tax holidays and low-cost loans can help households and businesses survive through the crisis. These policies have been used in different combinations across countries (see Bruegel). If the support is effective, it will ensure that they are ready to get back to work once the crisis is over. Without such supports, the “scarring” effects of the recession could be large.
Global Economy to See U-shaped Recession from Covid-19
There has been a lot of discussion about the shape of the recession following the Covid-19 pandemic. But the use of terminology has not been uniform. This insight sets out a standard economic definition of each type of recession – U, V and L. What happens to the level and growth rate of output after a crisis is critical to defining the shape of a recession.
CRU expects the Covid-19 pandemic to give rise to a U-shaped recession for the world economy. That means we expect to see a permanent loss in the level of world GDP, but no impact on long-term world GDP growth rates. Of course, the recession shape can and does vary by country.
Request more information about this topic.
Learn more about CRU’s services at www.crugroup.com


