Prices

February 13, 2020
Hot Rolled Futures: Uncertainty Leads to Lower HR Futures Prices, Flat Forward Curves
Written by Jack Marshall
The following article on the hot rolled coil (HRC) steel and financial futures markets was written by Jack Marshall of Crunch Risk LLC. Here is how Jack saw trading over the past week:
Steel
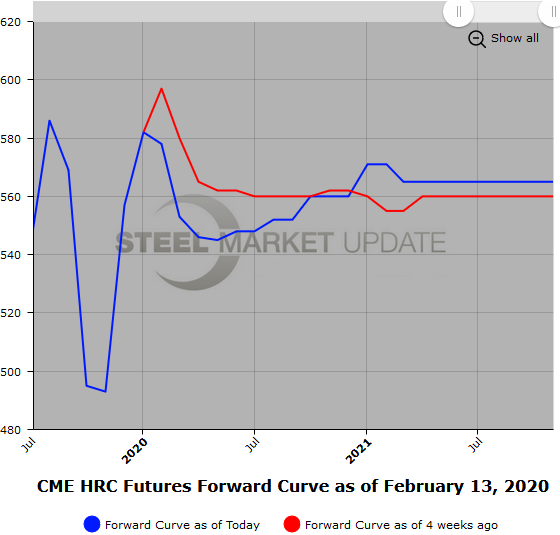
HR futures prices have retraced lower since the beginning of the year in spite of the mill price increases. Tepid demand/extra capacity for physical HR has seen active futures sellers come in for the nearby six months.
The curve out to Dec’20 has declined an average of about $30/ST, but the nearer dates have declined further, which has shifted the shape of the curve that was slightly backwardated at the turn of the calendar year to one of slight contango. This can be seen in the shift in the prices of the quarters. For example, Q2’20 at the turn was valued at $585/ST versus $543/ST on Feb. 12 (down $42/ST), and Q3’20 at the turn was valued at $584/ST versus $551/ST on Feb. 12 (down $33/ST), while Q4’20 at the turn was valued at $581/ST versus $557/ST on Feb. 12 ( down $24/ST). Meanwhile, Mar’20 has been actively trading between $550/$555.
Tight inventory controls probably have led to softer demand as last year’s price declines in HR are well etched into memories. However, a pickup in demand could see prices pressured higher for these same reasons (i.e.) low inventories.
We have seen some interest of late in HRO calls and puts for the nearby months and Q3’20. The latest Q3’20 interest in 600 calls is $12.5/$15/ST. Have seen a pickup in interested option participants.
Below is a graph showing the history of the CME Group hot rolled futures forward curve. You will need to view the graph on our website to use its interactive features; you can do so by clicking here. If you need assistance with either logging in or navigating the website, please contact us at info@SteelMarketUpdate.com.

Scrap
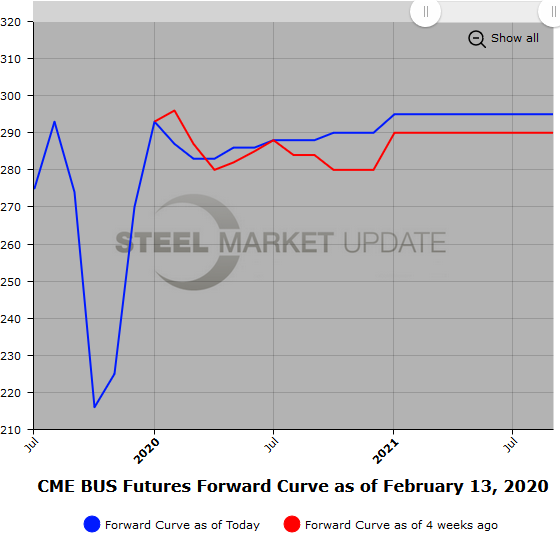
BUS futures declined less than many folks were expecting for Feb’20. Initially the thinking was that it would slide $20/GT, but it came in at just down $10/GT ($287/GT). There was considerable price variance by region. Shred lost about $21/GT, which saw the differential between prime and shred start to move back out after two months of basically trading for the same price.
The current BUS forward curve is pretty flat with BUS trading in the mid-$280 area. Early discussions point to a slight decline for Mar’20 BUS, but recent activity in the export market might again bolster prices, assuming we do not see HR trade off much more.
Below is another graph showing the history of the CME Group busheling scrap futures forward curve. You will need to view the graph on our website to use its interactive features; you can do so by clicking here.


