Prices

February 6, 2020
Hot Rolled Futures: Divergences Emerging
Written by Tim Stevenson
SMU contributor Tim Stevenson is a partner at Metal Edge Partners, a firm engaged in Risk Management and Strategic Advisory. In this role, he and his firm design and execute risk management strategies for clients along with providing process and analytical support. In Tim’s previous role, he was a Director at Cargill Risk Management, and prior to that led the derivative trading efforts within the North American Cargill Metals business. You can learn more about Metal Edge at www.metaledgepartners.com. Tim can be reached at Tim@metaledgepartners.com for queries/comments/questions.
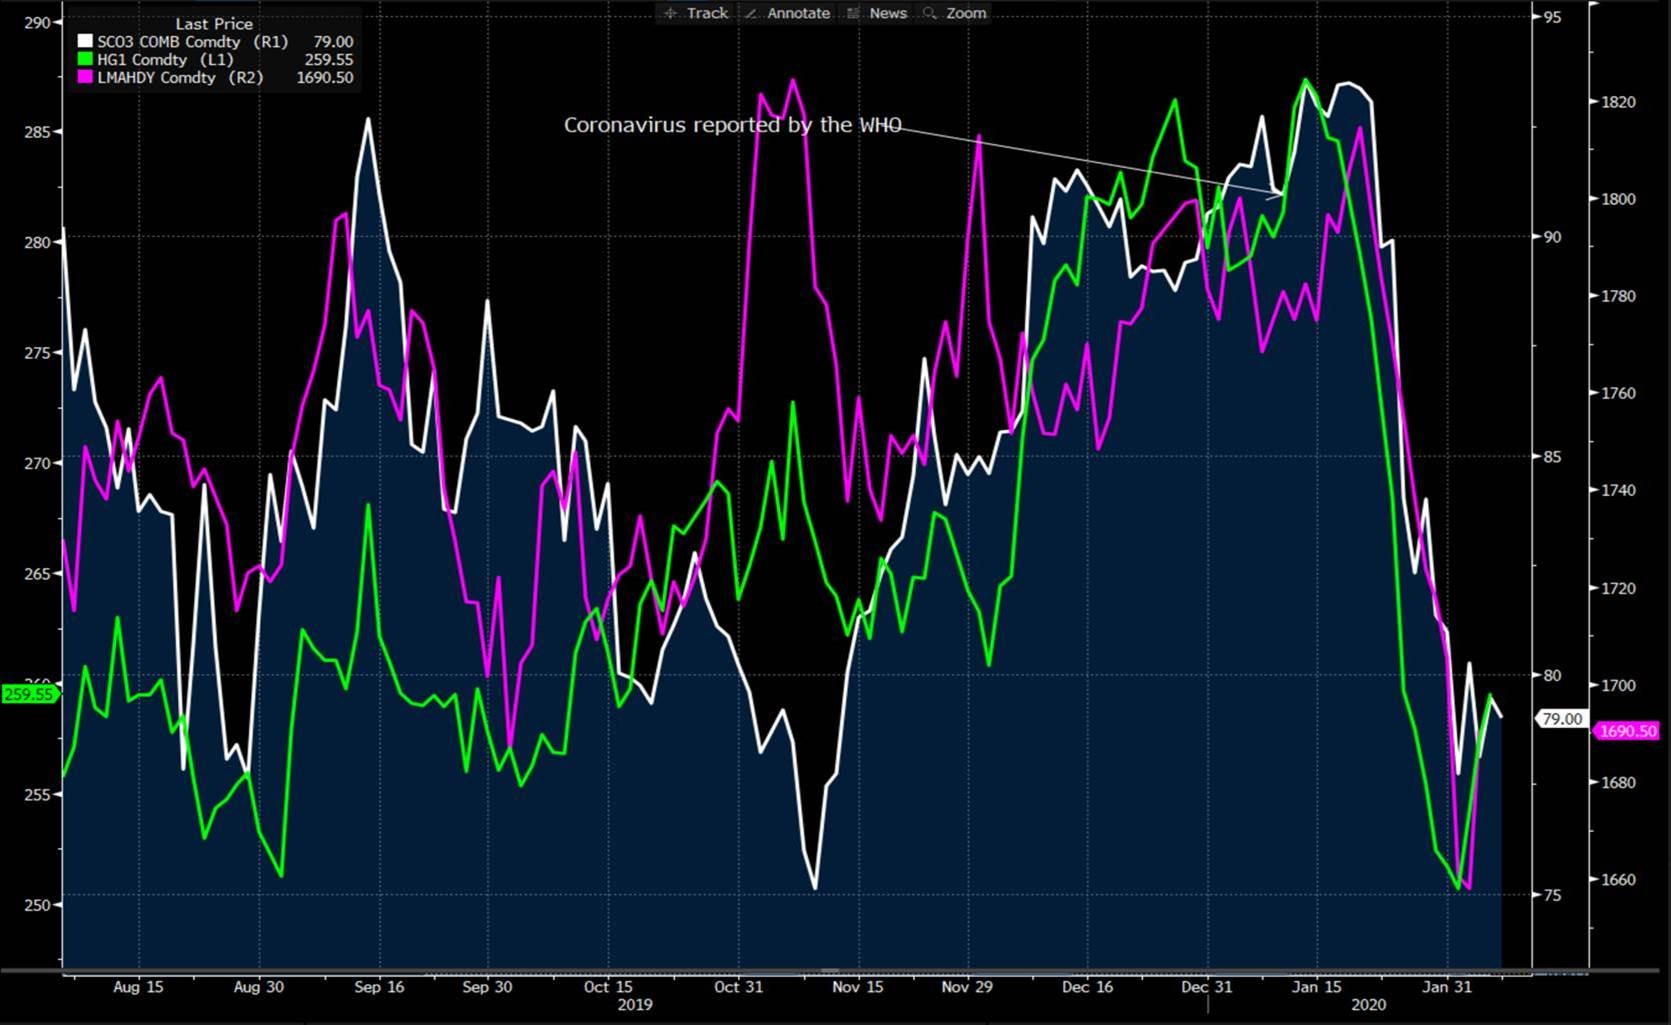
The ferrous futures markets have been active recently, with some violent reactions to changing fundamentals as well as the spreading coronavirus. Some are comparing it to the SARS outbreak of 2003, but China is much bigger now – steel production has grown almost 5x from that year! The reactions have not only been in the ferrous metals but other commodities as well, as noted in previous SMU articles:

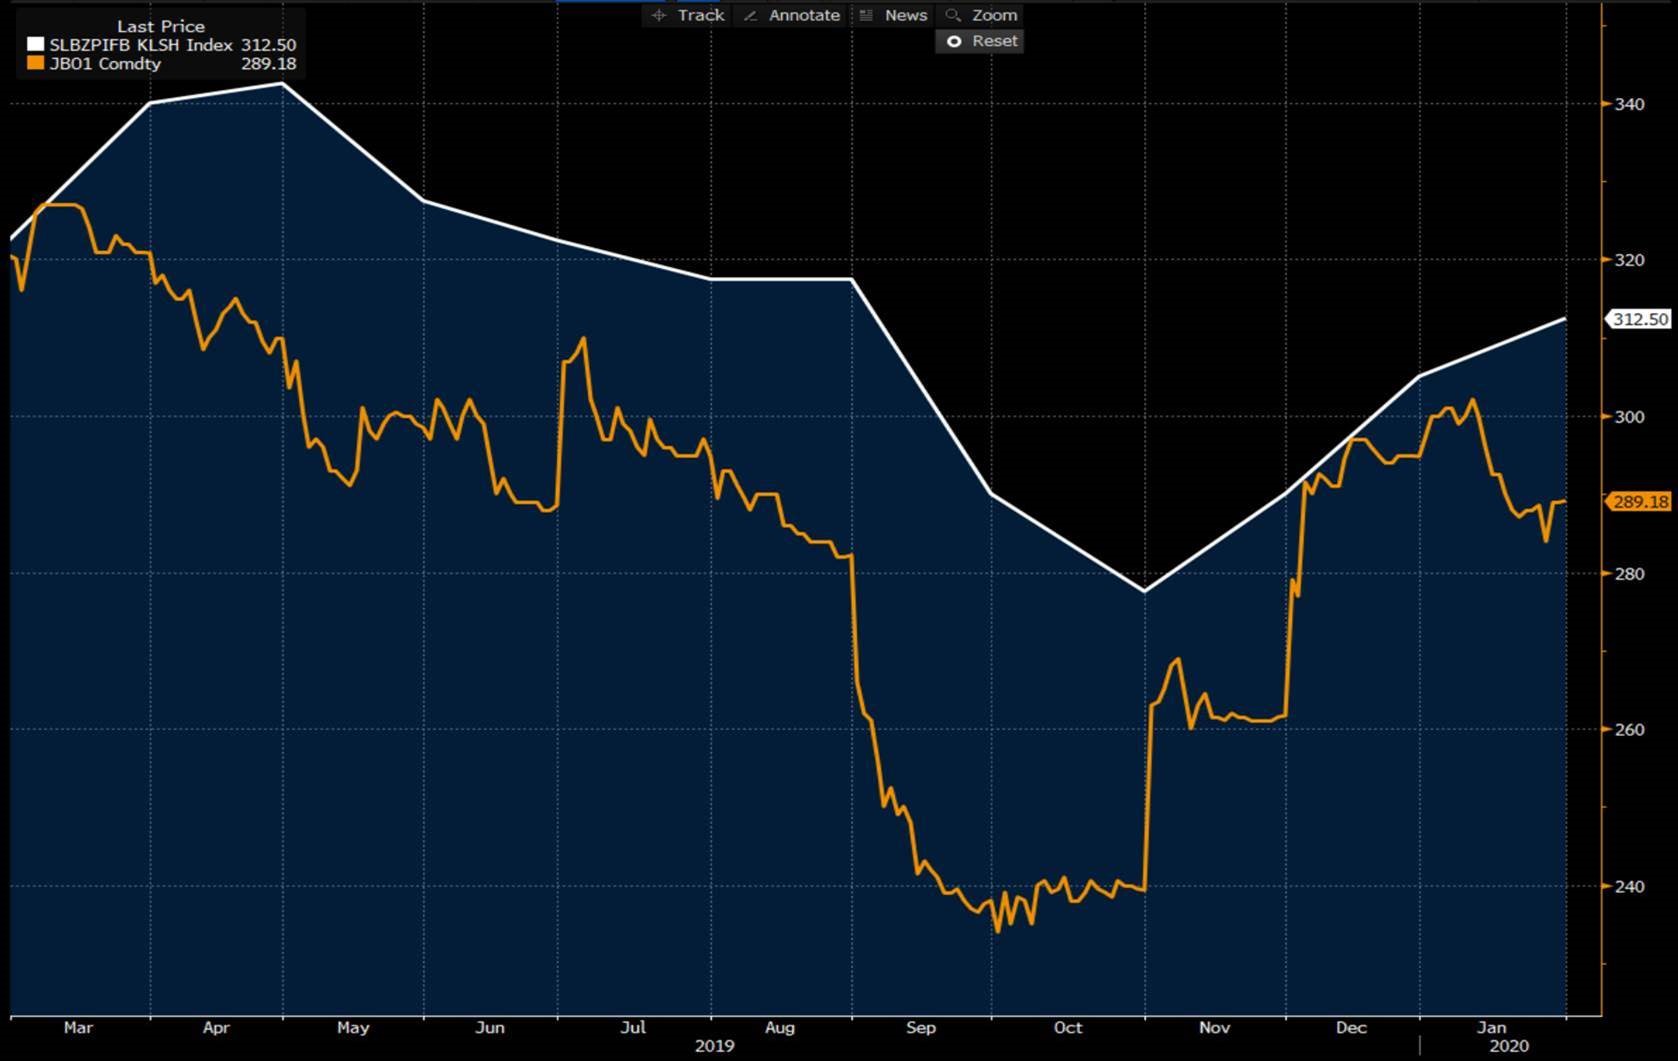
You can see that ore (white), copper (green), and aluminum (purple) have all been hit hard – but are they sniffing a bottom given the recent rebound? In addition, Turkish scrap prices have also been under pressure, but pig iron prices have been resilient. The following chart shows how the Brazilian pig iron prices (white) have diverged from Turkish scrap (the gold line is the front month Turkish scrap future). While the divergence isn’t quite as large as it was in late September/early October, consider that recent Turkish scrap transactions in the physical market have been in the $260’s. This does not appear to be sustainable.

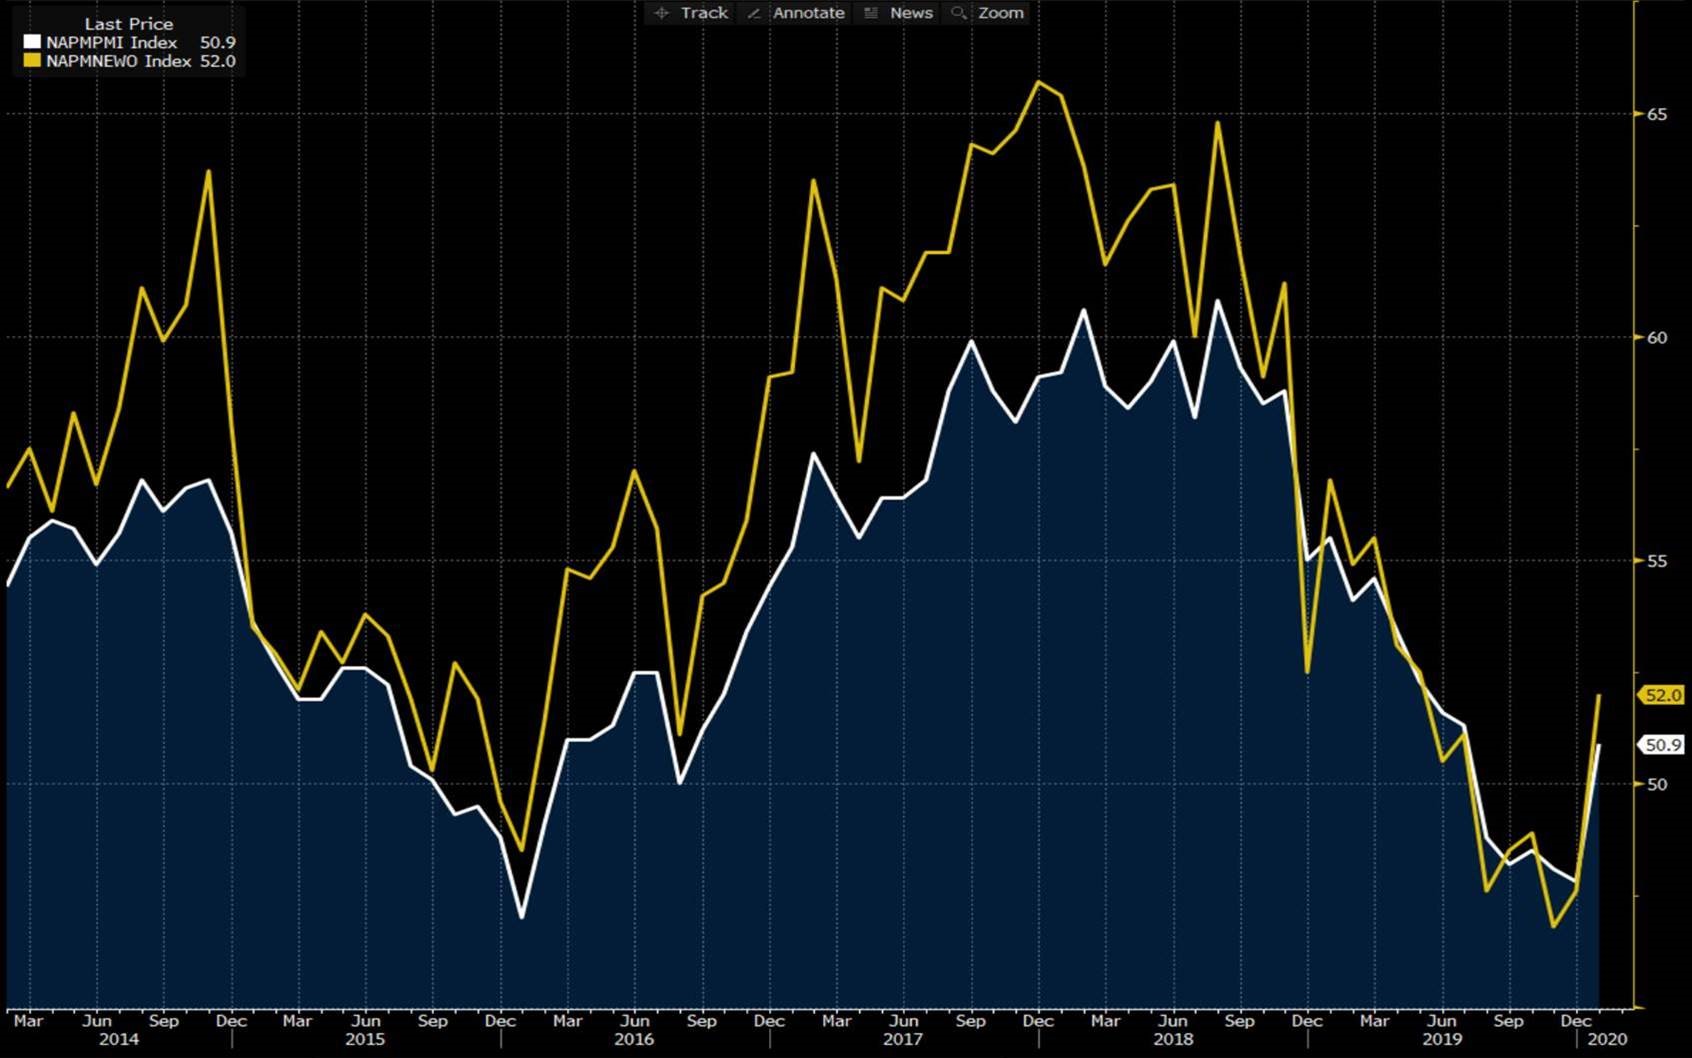
Back in the U.S., the ISM Purchasing Managers Index did spike back above 50 (white), and the important New Orders component (yellow) also ramped up in January, which was a welcome change from the readings in late 2019, which were stuck below 50.

Comparing the futures curves here in the U.S. week over week doesn’t tell us too much. Aside from the drop from February to March, the curve is actually pretty flat through the end of the year. While the scale on the chart looks like there is a more significant contango (farther out futures more valuable than nearby) from April out to December, in reality it is only $10 on a $550 commodity, or less than 2 percent.
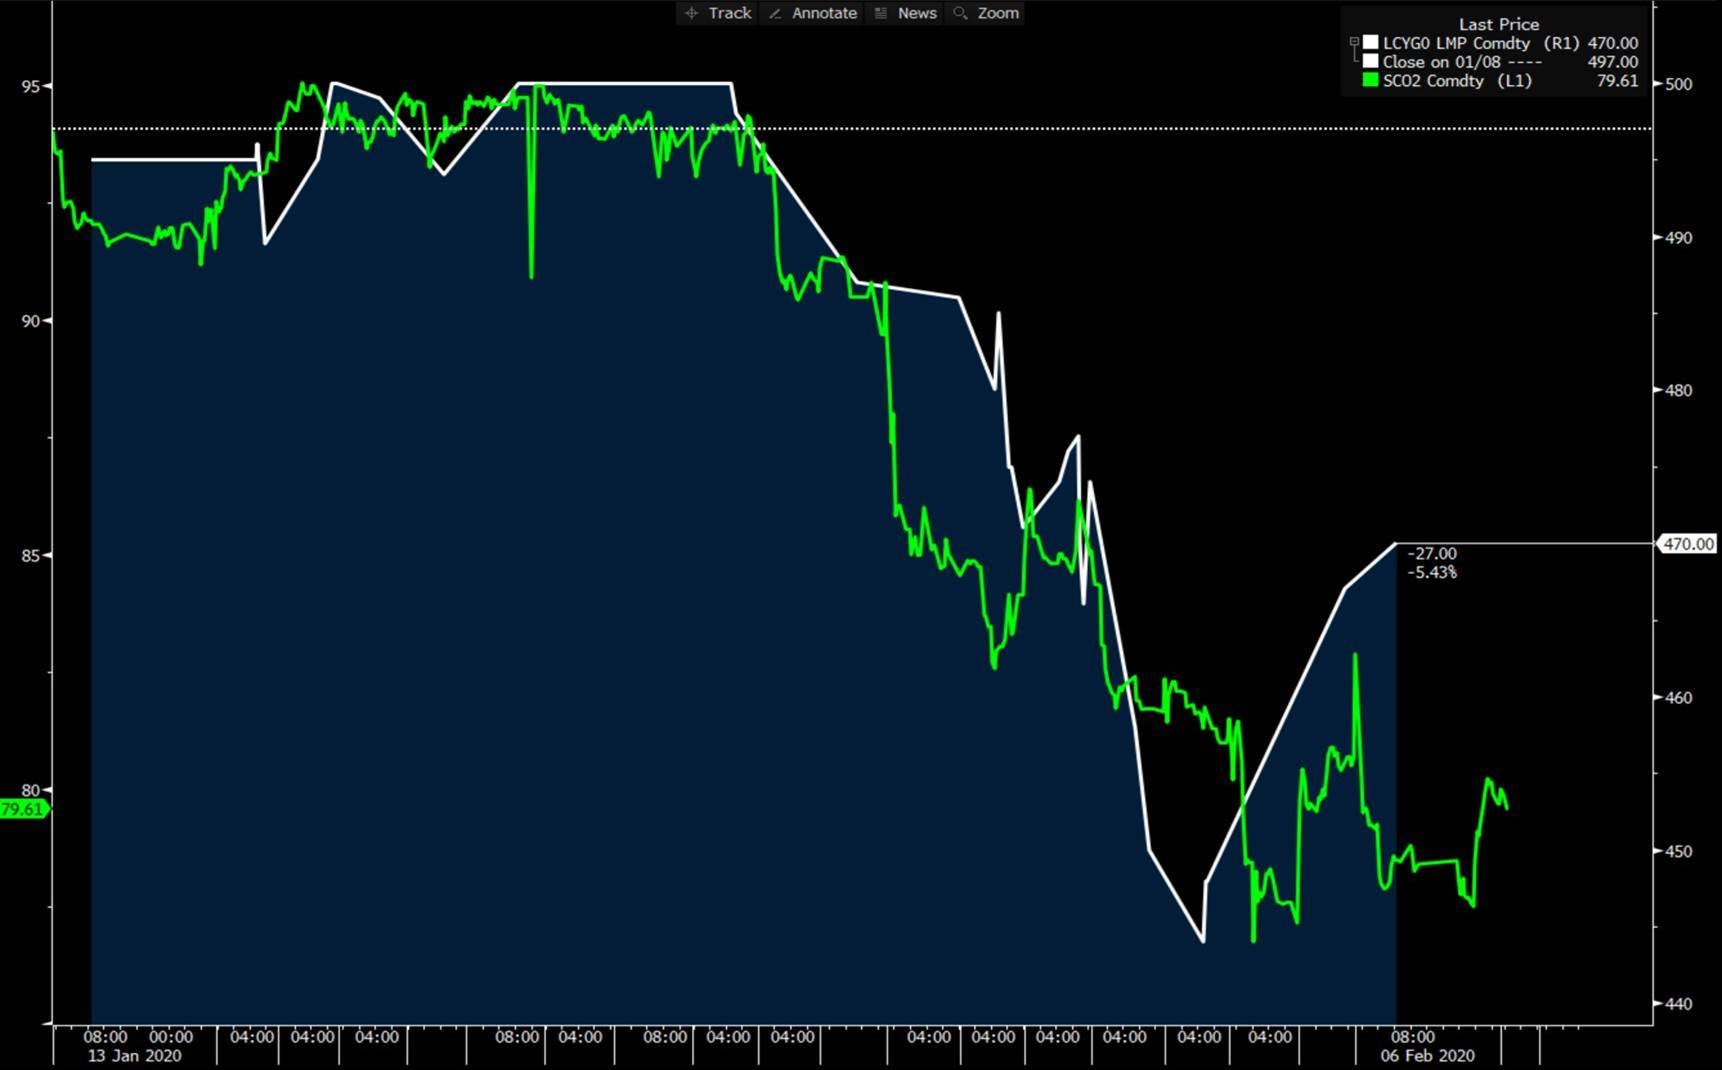
Shifting over to China briefly – another divergence is appearing – between steel and ore. You can see by the below chart that the Feb HRC steel contract (white) is starting to rally after selling off in tandem with iron ore (green). This makes some sense because if steel production is disrupted we should see higher prices there, while ore may be in lower demand until the implications are more clear.

How this will all get settled out remains to be seen. Looking at most of the macro indicators in the U.S., there doesn’t seem to be any major changes in the demand trends that dominated the second half of 2019, with the exception of the resolution of the GM strike and now the coronavirus. The forward HRC curve has taken a beating, but as we’ve stated it is “flattish” from March out to year end, which no doubt offers some opportunities for those on both sides of the market. Service centers with significant inventories may indeed find that selling $555 HRC will help them sleep better at night as they hedge the downside risk. OEM steel buyers, on the other hand, can look at $555 as a much better level to lock in their steel costs when compared to some of the HRC spot numbers, which were recently $50 higher than that or more.
Disclaimer: The information in this write-up does not constitute “investment service,” “investment advice” or “financial product advice” as defined by laws and/or regulations in any jurisdiction. Neither does it constitute nor should be considered as any form of financial opinion or recommendation. The views expressed in the above article by Metal Edge Partners are subject to change based on market and other conditions. The information given above must be independently verified and Metal Edge Partners does not assume responsibility for the accuracy of the information


