

Market Data

January 13, 2020
Drill Down of Cold Rolled Imports into Product Detail
Written by Peter Wright
Using U.S. International Trade Commission (USITC) data, Steel Market Update has taken the import tonnage of cold rolled sheet and broken it down into coil and leveled, then our report breaks out four thickness ranges and identifies how much was full hard, annealed and high strength.
Through November 2019, of the total cold rolled sheet and strip imports into the U.S., only 2.4 percent was strip. By gauge range the sheet broke down to: 28.0 percent < 0.5mm, 30.3 percent ≥ 0.5 to 1.0 mm, 40.9 percent> 1 to 3mm thick and 0.7 percent > 3 mm.
Table 1 is a summary for 2019 through November of cold rolled imports showing gauge ranges and condition and the annual year-to-date total for sheet. Strip is itemized separately at the bottom of the table. Both are in metric tons.
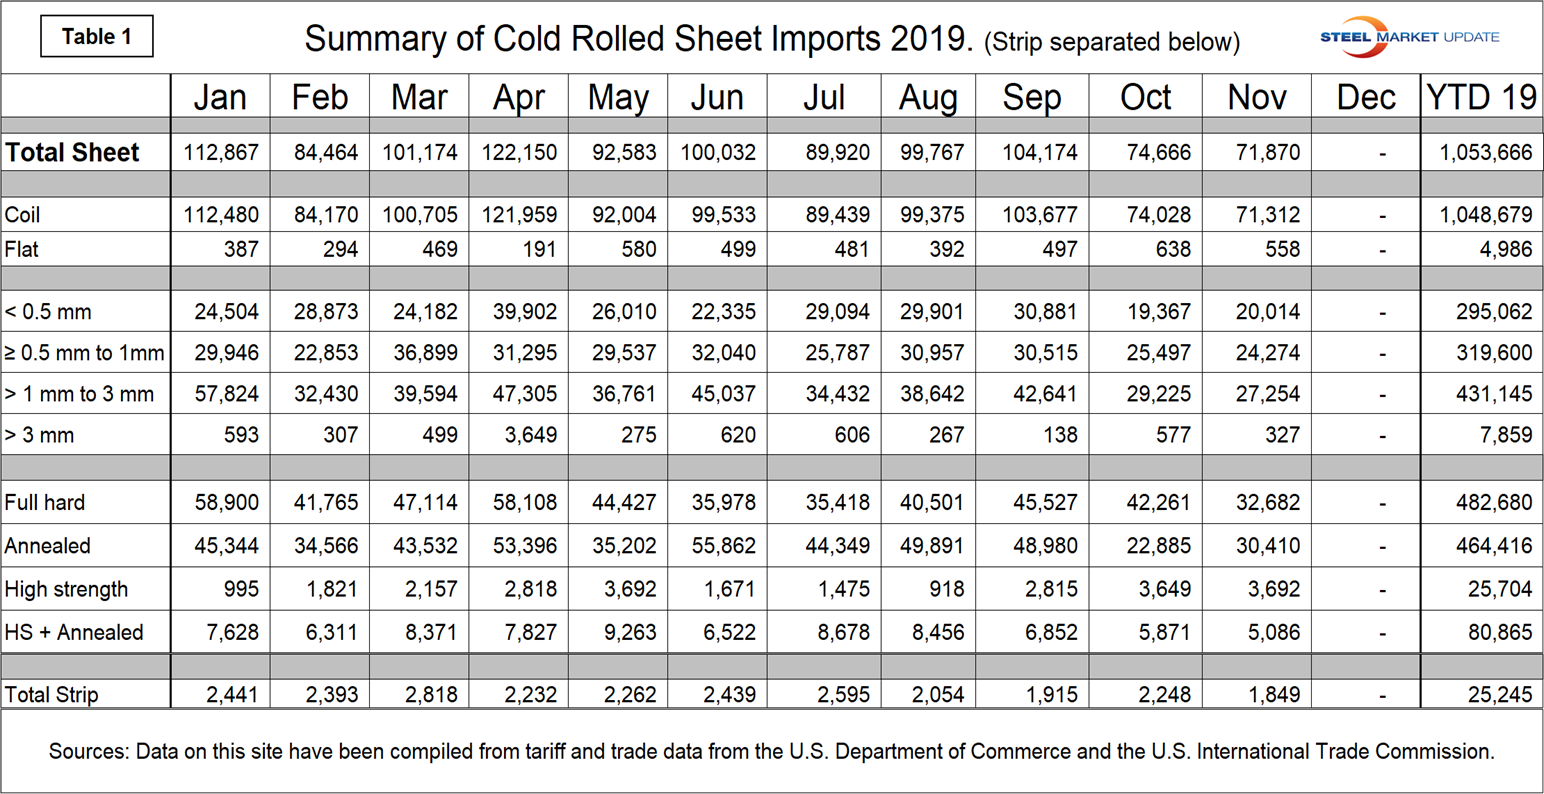
Figure 1 breaks the year-to-date cold rolled sheet tonnage down into the four gauge ranges that are identified in the HTS codes.
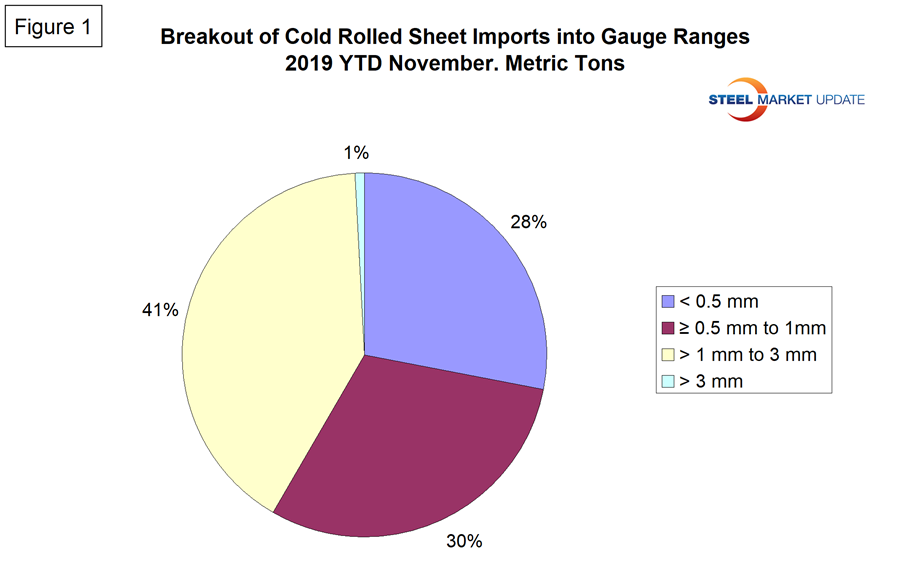
Figure 2 does the same thing for condition. It identifies the volume of full hard, annealed, high strength and high strength annealed. Year to date November, 45.8 percent was full hard, 44.1 percent was annealed, 2.4 percent was high strength and 7.7 percent was high strength annealed.
Note: This data was accessed through the USITC database. All steel traded globally is classified by the Harmonized Tariff System (HTS). The HTS code has 10 digits. The first six are globally universal. The last four are used at the discretion of the nations involved in a particular transaction and are the basis of this report. The way the U.S. uses the last four digits to define products may be different from other nations’ product classification.


