Prices

December 4, 2019
Raw Materials Prices: Iron Ore, Coking Coal, Pig Iron, Scrap, Zinc
Written by Peter Wright
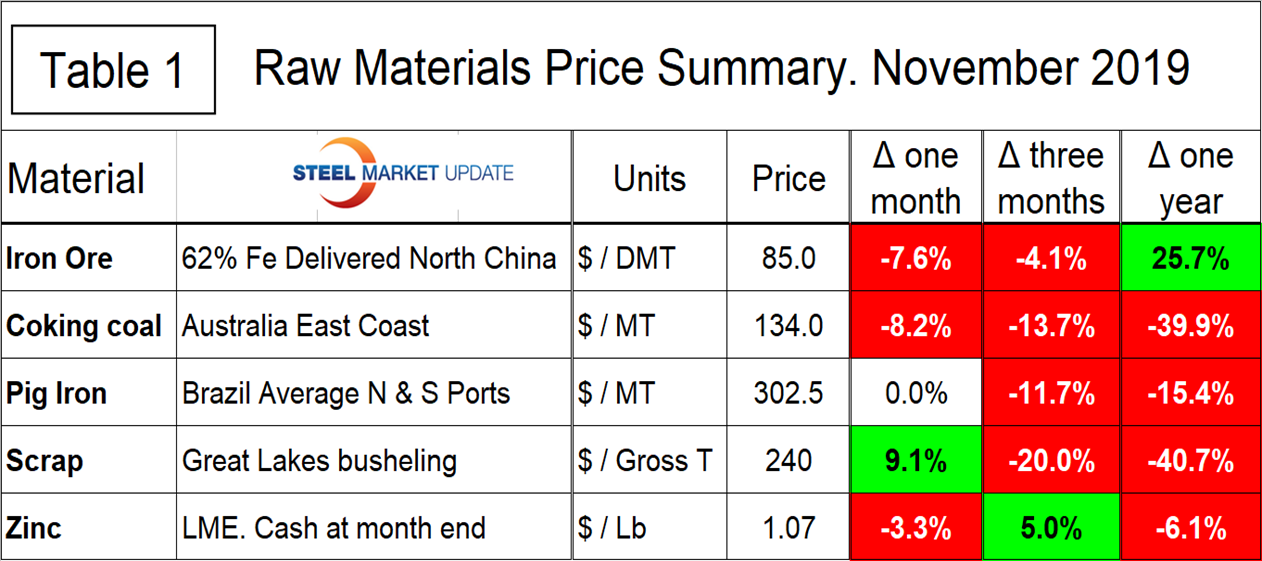
In the last month, the prices of three of the five raw materials tracked by Steel Market Update in this report declined, one advanced and one was unchanged.
Table 1 summarizes the price changes through Nov. 20 of the five materials considered in this analysis. It reports the month/month, 3 months/3 months and 12 months/12 months changes on a percentage basis. Coking coal and zinc had negative price reversals, scrap reversed in a positive direction and pig iron was unchanged since our October update.
Iron Ore
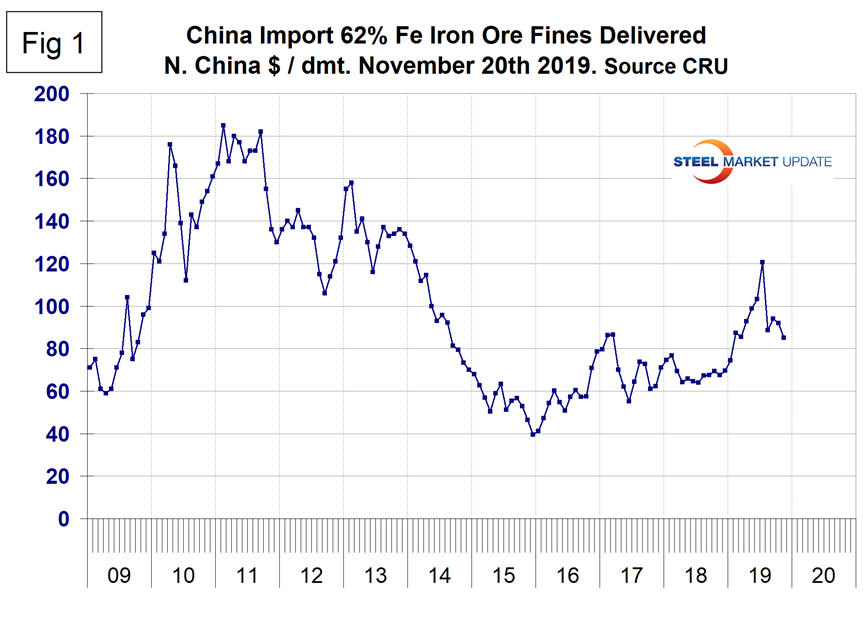
Based on CRU’s data, the weekly average spot price of 62% fines delivered North China was $85.00 per dry metric ton on Nov. 20, down from $92.00 on Oct. 16. Figure 1 shows the price of 62% Fe delivered North China since January 2009. The price of ore is still above the $20 range that prior to February 2019 had existed for a year and a half.
Coking Coal
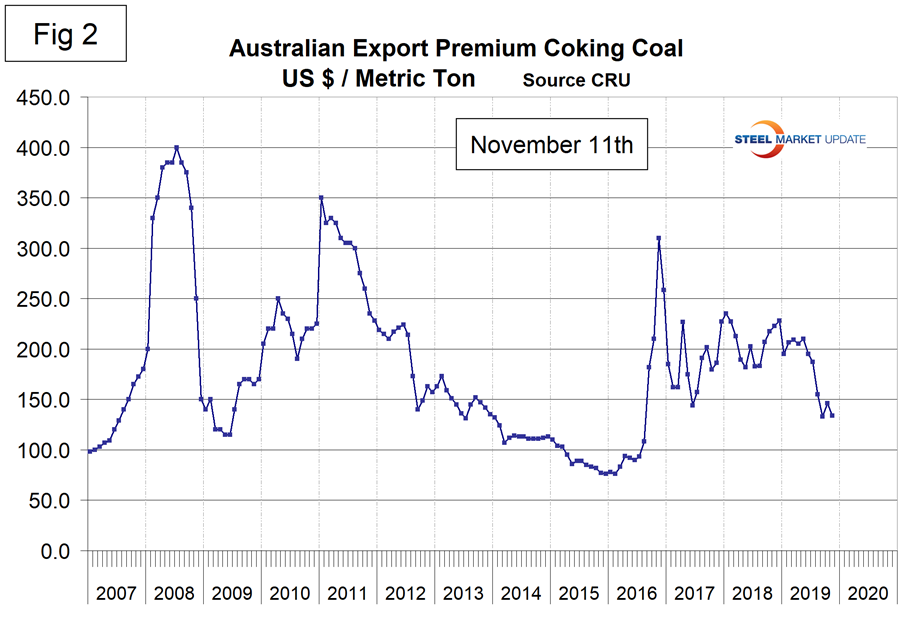
The price of premium low volatile coking coal FOB east coast of Australia declined each month June through September, then recovered from $133 in September to $146 in October per metric ton before declining again to $134.00 on Nov. 11 (Figure 2).
Pig Iron
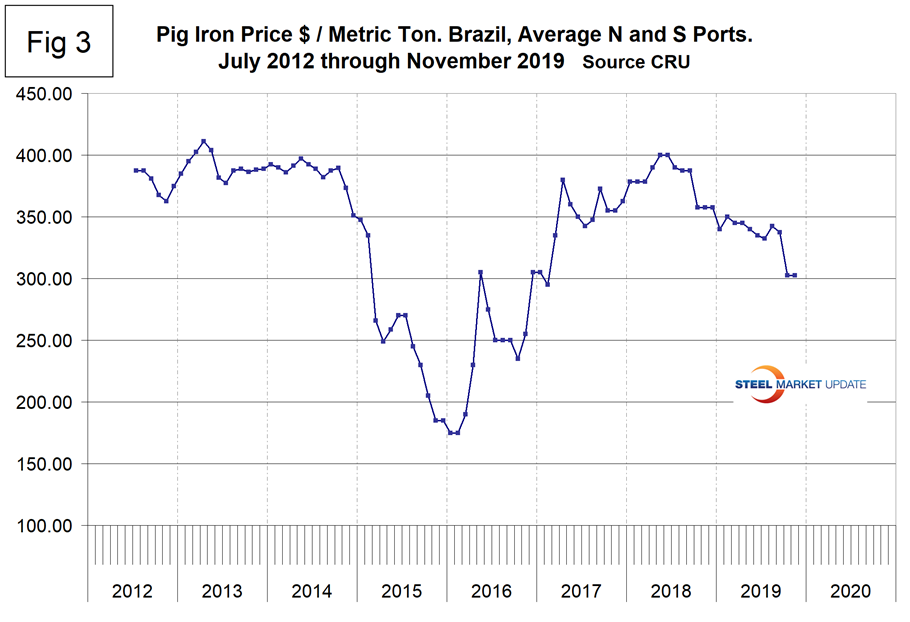
Most of the pig iron imported into the U.S. currently comes from Russia, Ukraine and Brazil with additional material from South Africa and Latvia. In this report we summarize prices out of Brazil and average the FOB value from the north and south ports. The price had a recent peak of $400 per metric ton in May and June last year and has declined steadily ever since, reaching $302.50 in October and being unchanged in November. The average price in November was 15.4 percent lower than in November last year.
Scrap
To put this raw materials commentary into perspective, we include here Figure 4, which shows the spread between busheling in the Great Lakes region and hot rolled coil Midwest U.S. through mid-November 2019, both in dollars per net ton. The spread collapsed from $564 in August last year to $286.71 in November 2019 and is now at the top end of the range that has been relatively normal for the last 13 years.
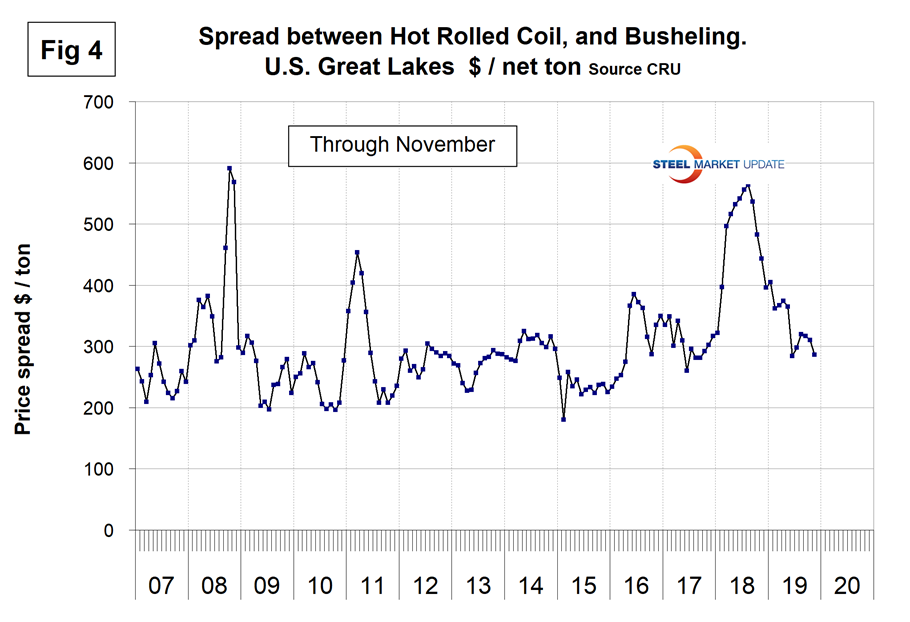
Figure 5 shows the relationship between shredded and busheling, both priced in dollars per gross ton in the Great Lakes region. This spread was $5 in November, the lowest since May 2016.
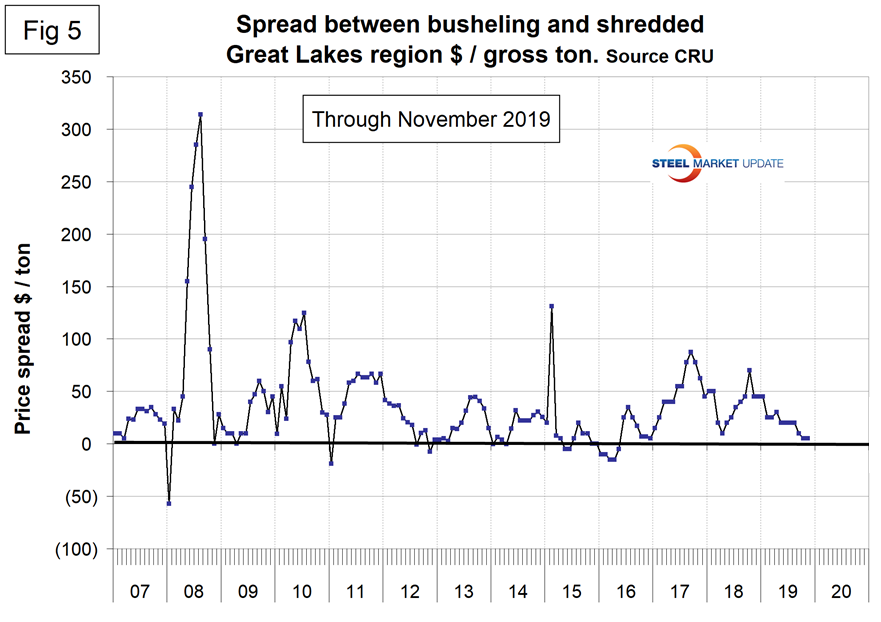
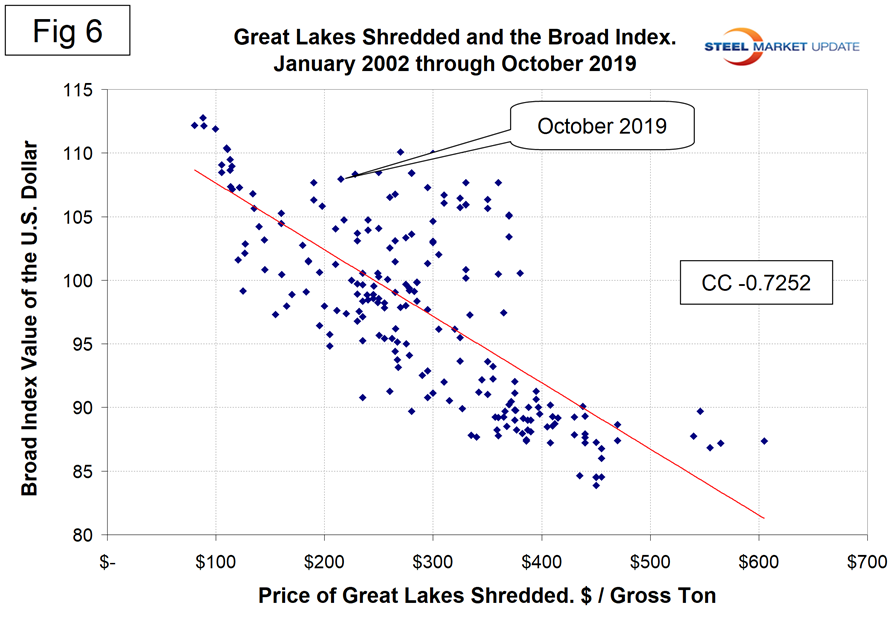
Figure 6 is a scatter gram of the price of Chicago shredded and the monthly Broad Index value of the U.S. dollar as reported by the Federal Reserve. The latest data for the monthly Broad Index was October. This is a causal relationship with a negative correlation of almost 73 percent.
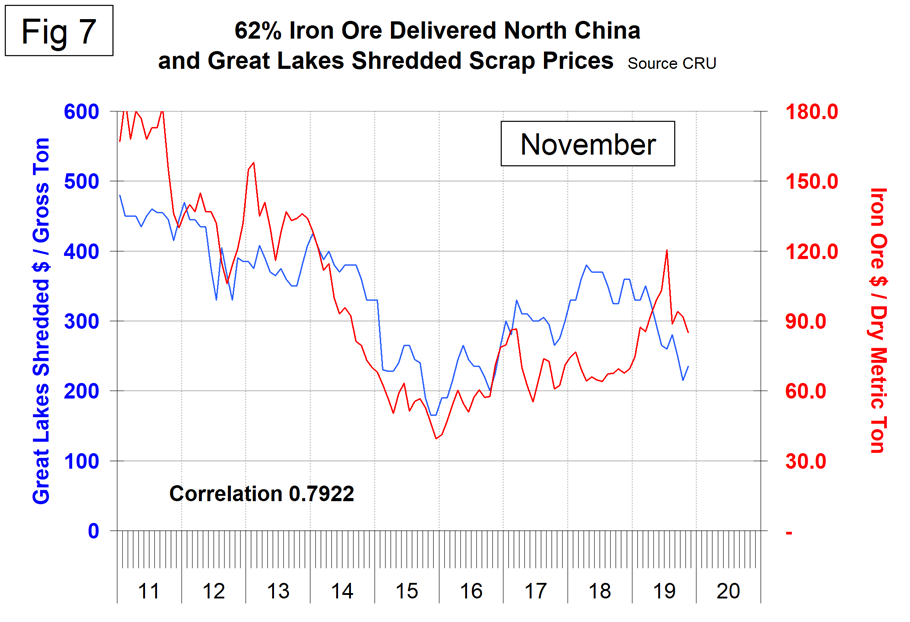
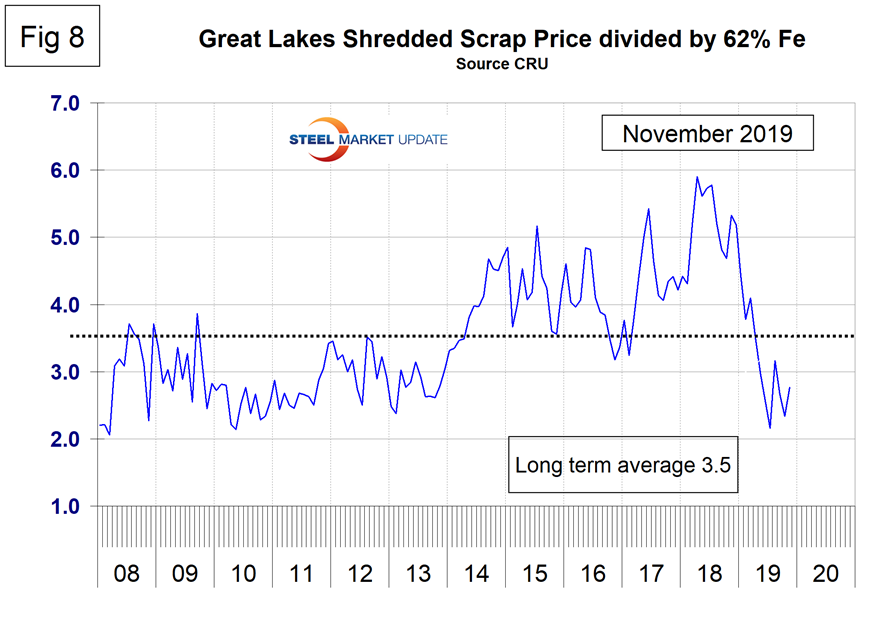
There is a long-term relationship between the prices of iron ore and scrap. Figure 7 shows the prices of 62% iron ore fines delivered N. China and the price of shredded scrap in the Great Lakes region through late November 2019. The correlation since January 2006 has been over 79 percent. There was a very unusual divergence in these prices in 2017 and 2018 that benefited the integrated producers, but that situation has now corrected leaving the EAF producers with an advantage on a historical basis.
In the last 11 years, scrap in dollars per gross ton has been on average 3.4 times as expensive as iron ore in dollars per dry metric ton (dmt). A high ratio benefits the domestic integrated producers and a low ratio benefits the EAF producers. The ratio has been erratic since mid-2014, but at 2.8 in November gives a substantial advantage to the EAF producers (Figure 8).
Zinc
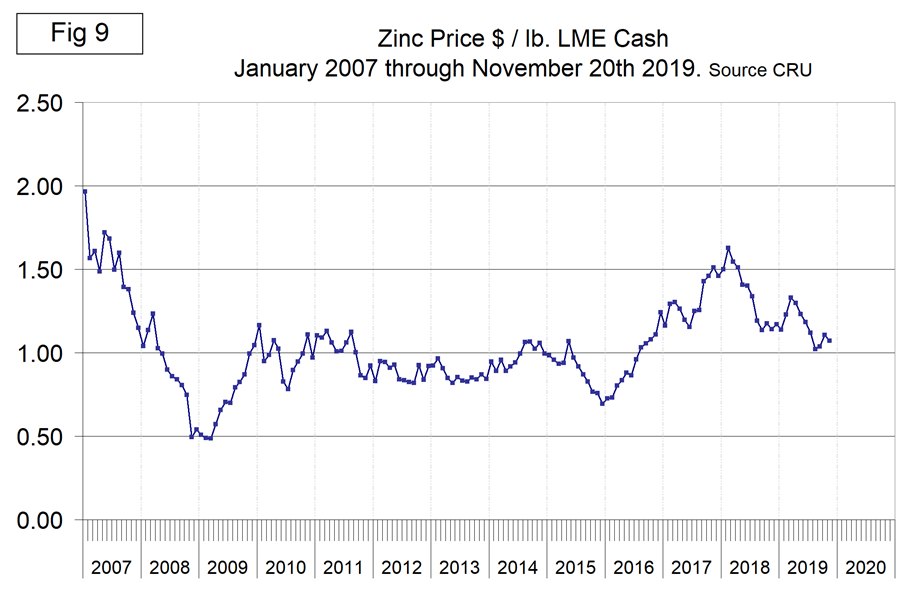
The LME cash price for zinc mid-month is shown in Figure 9. The latest data is for Nov. 20 when the price was $1.07 per pound, down every month from March through August with a small rebound since then.
Zinc is the fourth most widely used metal in the world after iron, aluminum and copper. Its primary uses are 60 percent for galvanizing steel, 15 percent for zinc-based die castings and about 14 percent in the production of brass and bronze alloys.


