Prices

November 21, 2019
Hot-Rolled Futures: A Tale of Uncertainty and Caution
Written by Gaurav Chhibbar
SMU contributor Gaurav Chhibbar is a partner at Metal Edge Partners, a firm engaged in Risk Management and Strategic Advisory. In this role, he and his firm design and execute risk management strategies for clients along with providing process and analytical support. In Gaurav’s previous role, he was a trader at Cargill spending time in Metal and Freight markets in Singapore before moving to the U.S. You can learn more about Metal Edge at www.metaledgepartners.com. Gaurav can be reached at gaurav@metaledgepartners.com for queries/comments/questions.
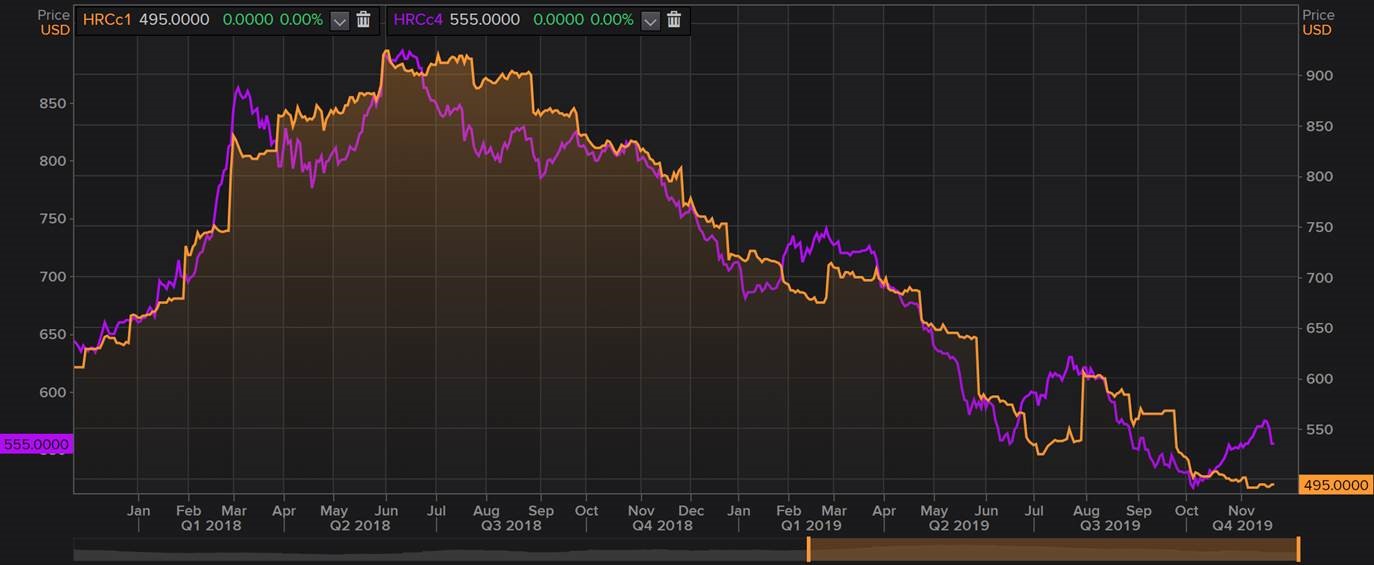
Over the past few days, it is possible that many of you have experienced dilemma, concern and doubts about the U.S. steel market and its impending direction. If the trend of the futures market is anything to go by, the confusion is best captured in the derivative arena. Futures’ prices have meaningfully appreciated since early October (blue line). The Q1 2020 prices up until 10 days ago had moved more than $40 in a month. Any trader long Q1 2020 futures at $528 (average Q1 on 10/10) would have made $42/ton on 11/11. Since then, however, the market has seen some renewed pressure. This pressure has largely been attributed to the question asked by many: Are we amidst another dead cat bounce?

To analyze the question, the following chart adds some interesting perspective. The chart shows the 4th month futures price and that of the spot month. Loosely, it implies that the chart tracks the moving expectation of the market (its sentiment) for pricing 4 months out versus today’s price. To understand the chart better, when the purple line is above the orange line, the curve is in a contango (means the 4th month is priced higher than spot price) and when the purple line is below the orange line we are in backwardation (means current price is above the price 4 months out).

To spot “dead-cat bounce” scenarios on this chart, you’d have to look for actively dropping expectation for the purple line followed by drops in the orange line. Clearly, you’ll see Feb-Mar 2019 & Aug 2019 as periods of active decline in the purple line after having moved higher than the orange line. The period of 2018 stands out, though. Although you see a similar pattern, that of purple line actively moving below the orange line, that period is accompanied with the orange line moving still higher (Section 232 tariffs + Canada/Mexico exemptions being taken away).
Looking at the above and analyzing the current data, one has to try to identify changes in the landscape (or lack thereof) from the previous moves in the HRC cycle. My argument is not to paint a picture either way as I best leave it to your judgment (and client conversations), but it is important to look at scrap, longer domestic lead times, ore, supply—domestic and international—and the broader inventory situation in order to try to assess whether this cycle is the same as the ones before or if there is a new twist to the story.
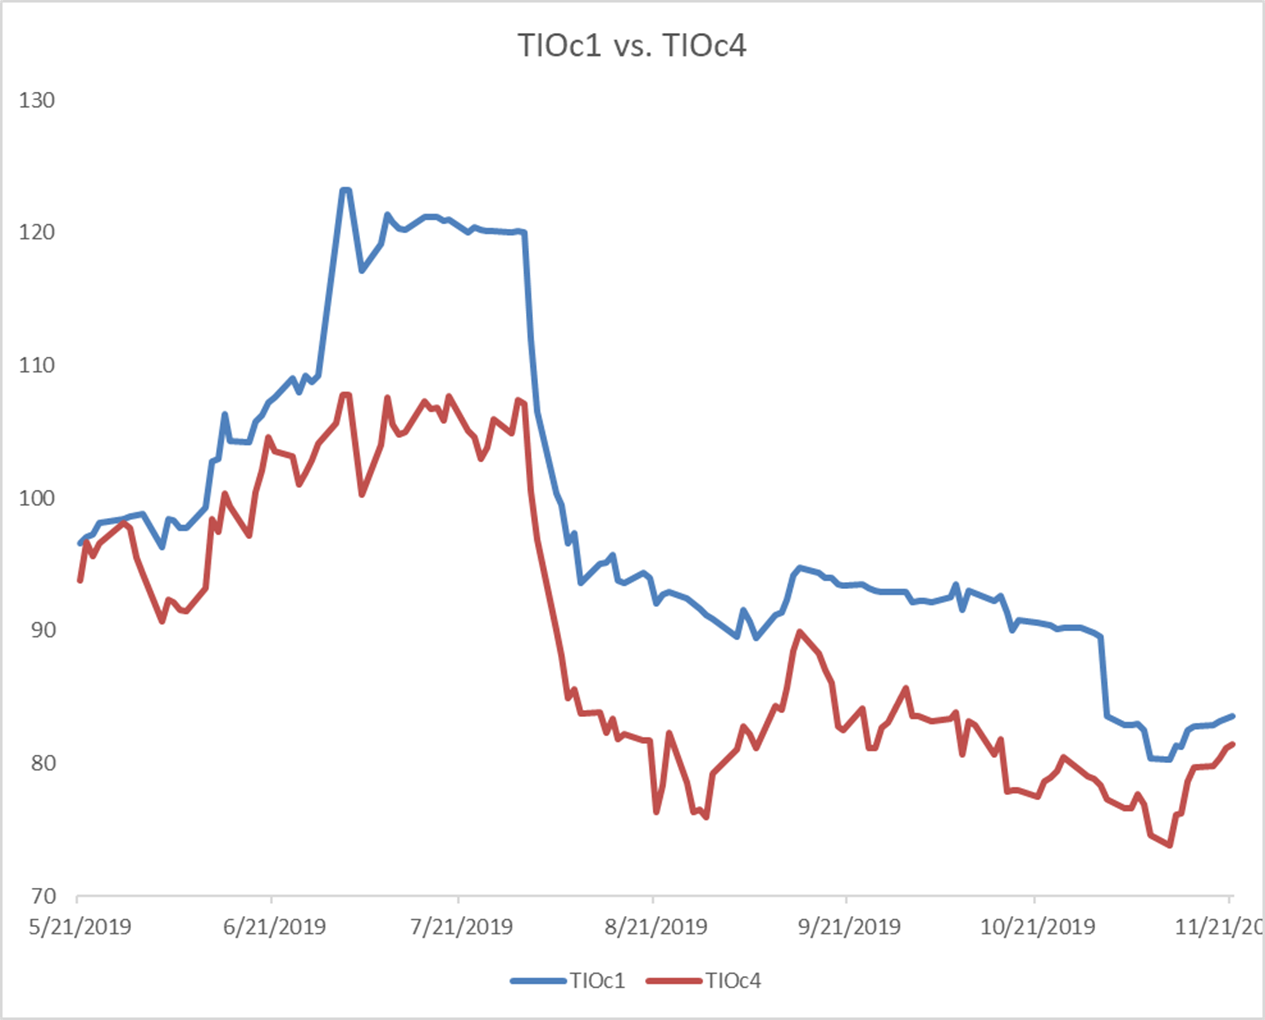
Just a quick look at the iron ore curve for the same comparison will tell you that the raw material markets aren’t as dismissive about the future pricing as some of our market participants in the U.S. The gap between 4th month and spot month on ore keeps reducing.

The positive momentum in international markets is not limited to iron ore, but to steel (rebar) as well. With increasing Chinese government support and stricter curbs on production to reduce pollution, the steel pricing has remained well supported.

I would summarize with pondering over a question that came up on one of our client calls today: “Why would we bother about what’s happening internationally at a time when all we buy is domestic steel?” I’m sure we’ve all felt that the U.S. trades in its own little bubble, but the reality is that buoyed scrap markets in Turkey, Chinese appetite for billets, and strong production cuts in Europe are going to impact what happens in our own backyard. Often sooner than we think!
Disclaimer: The information in this write-up does not constitute “investment service,” “investment advice” or “financial product advice” as defined by laws and/or regulations in any jurisdiction. Neither does it constitute nor should be considered as any form of financial opinion or recommendation. The views expressed in the above article by Metal Edge Partners are subject to change based on market and other conditions. The information given above must be independently verified and Metal Edge Partners does not assume responsibility for the accuracy of the information


