

Market Data

November 15, 2019
Shipments and Supply of Steel Products Through September
Written by Peter Wright
Demand for steel sheet products declined by more than the seasonal norm in September.
This analysis by Steel Market Update is based on steel mill shipment data from the American Iron and Steel Institute (AISI) and import/export data from the U.S. Department of Commerce (DoC). The analysis summarizes total steel supply by product from 2003 through September 2019 and year-on-year changes. The supply data is a proxy for market demand, which does not take into consideration inventory changes in the supply chain. Our analysis compares domestic mill shipments with total supply to the market. It quantifies market direction by product and enables a side-by-side comparison of the degree to which imports have absorbed demand.
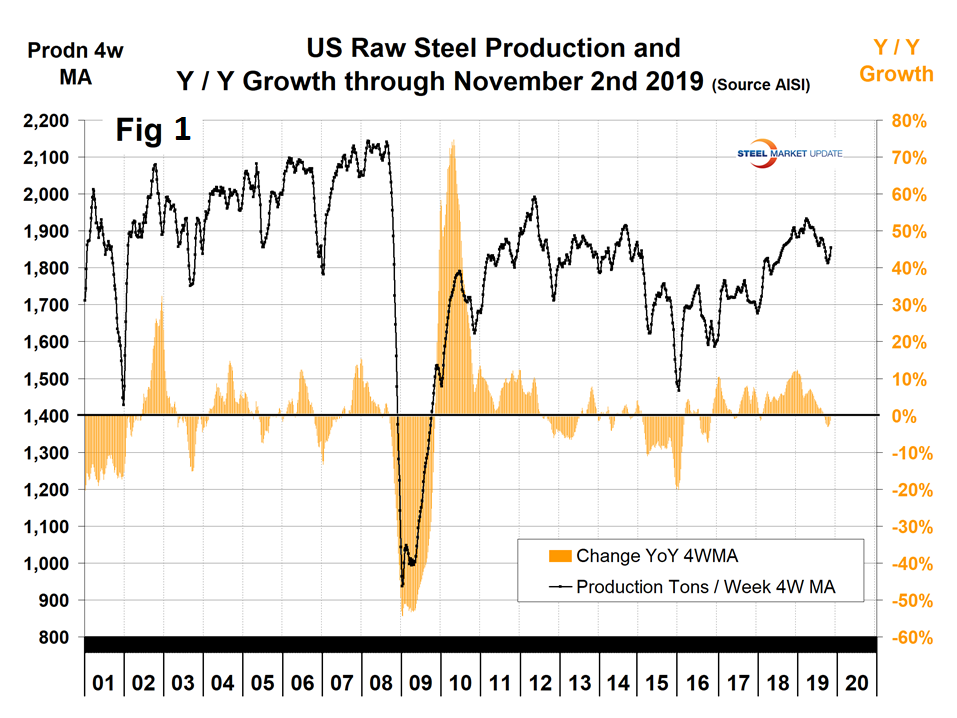
Figure 1 shows that the robust growth of U.S. raw steel production that occurred last year reversed in 2019 until the week ending Oct. 5. Since then there has been a 4.7 percent growth spurt through the week ending Nov. 2. Year over year through Nov. 2, production was down by 1.4 percent. This is a four-week moving average and is based on weekly data from the AISI.
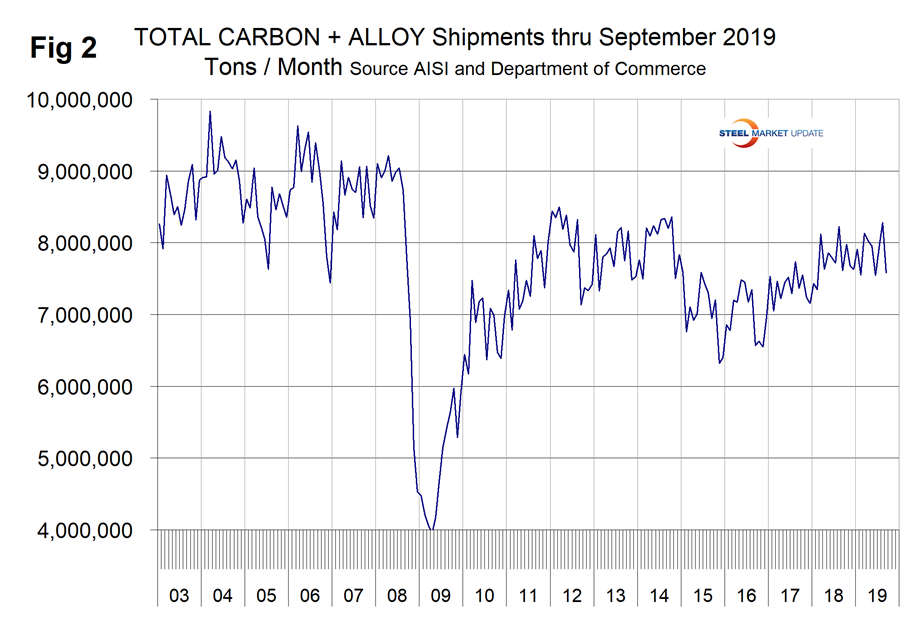
The shipments and supply report that you are reading now is based on monthly shipments by product as reported by the AISI plus import and export data from the DoC. Figure 2 shows the monthly shipment data for all rolled steel products. In the long run the trajectories of growth in Figures 1 and 2 are comparable, but the most recent increase in weekly shipments hasn’t appeared yet in the monthly data.
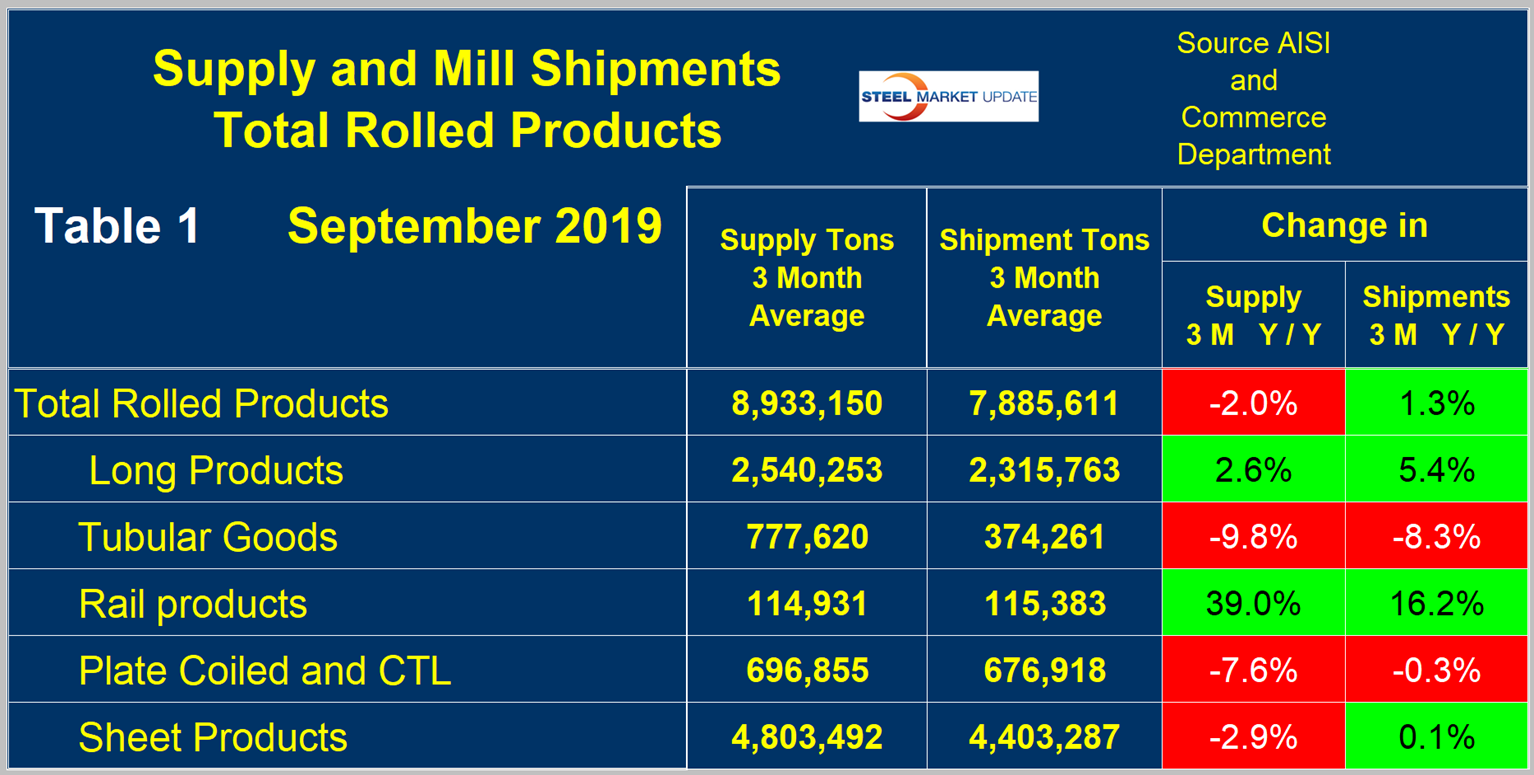
First, though, we will look at the shipment and supply situation for all product groups to see how much difference there is between them. Table 1 is this compilation. Total supply (proxy for market demand) as a three-month moving average (3MMA) was down by 2.0 percent year over year and mill shipments were up by 1.3 percent, meaning that imports took a smaller slice of the pie in the three months through September year over year. There is a big difference between products. Long products have performed best of the major product groups and tubulars the worst. The supply of sheet products was down by 2.9 percent in three months through September year over year and shipments were up by 0.1 percent.
Now let’s look at sheet products in detail. One consideration is that seasonality of demand is significant with a 10-year historical average that varies by 11.4 percent between the high month of August and the low month of November. Over this 10-year period, May, June and July have been very consistent as shown in Figure 3. On average since and including 2010, September has been down by 5.3 percent from August and this year was down by 8.3 percent.
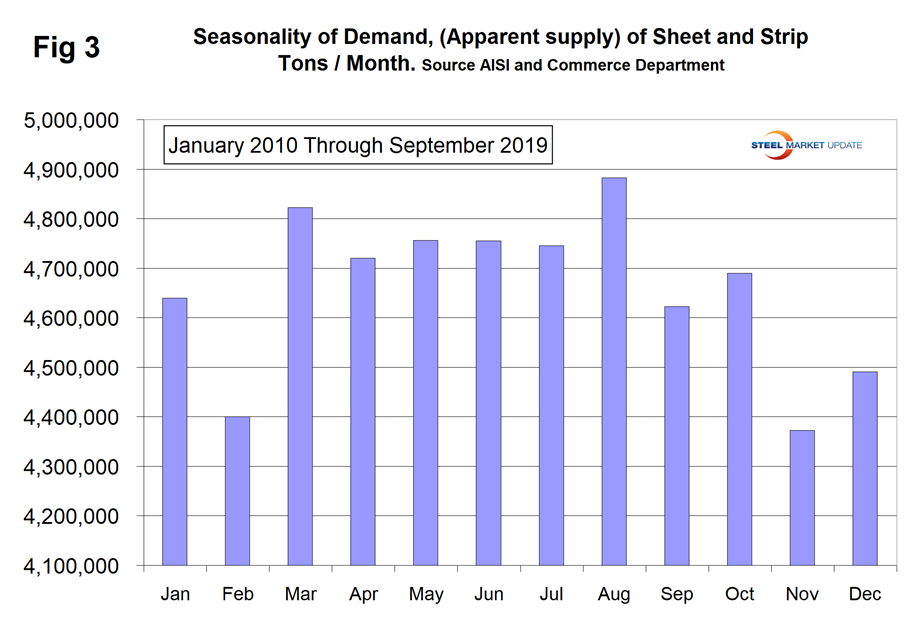
Table 2 describes both apparent supply and mill shipments of sheet products (shipments includes exports) side by side as three-month averages through September with year-over-year growth rates for each. Comparing the year-over-year time periods, total supply of sheet products to the market decreased by 2.9 percent on a 3MMA basis and mill shipments increased by 0.1 percent. Table 2 breaks down the total into product detail and shows that supply was down for all products except other metallic coated, which is mainly Galvalume. Shipments were up for hot rolled and other metallic coated, but down for cold rolled and galvanized products. Apparent supply is defined as domestic mill shipments to domestic locations plus imports. In the three months through September 2019, the average monthly supply of sheet and strip was 4.803 million tons. There is no seasonal manipulation of any of these numbers. By definition, year-over-year comparisons have seasonality removed.
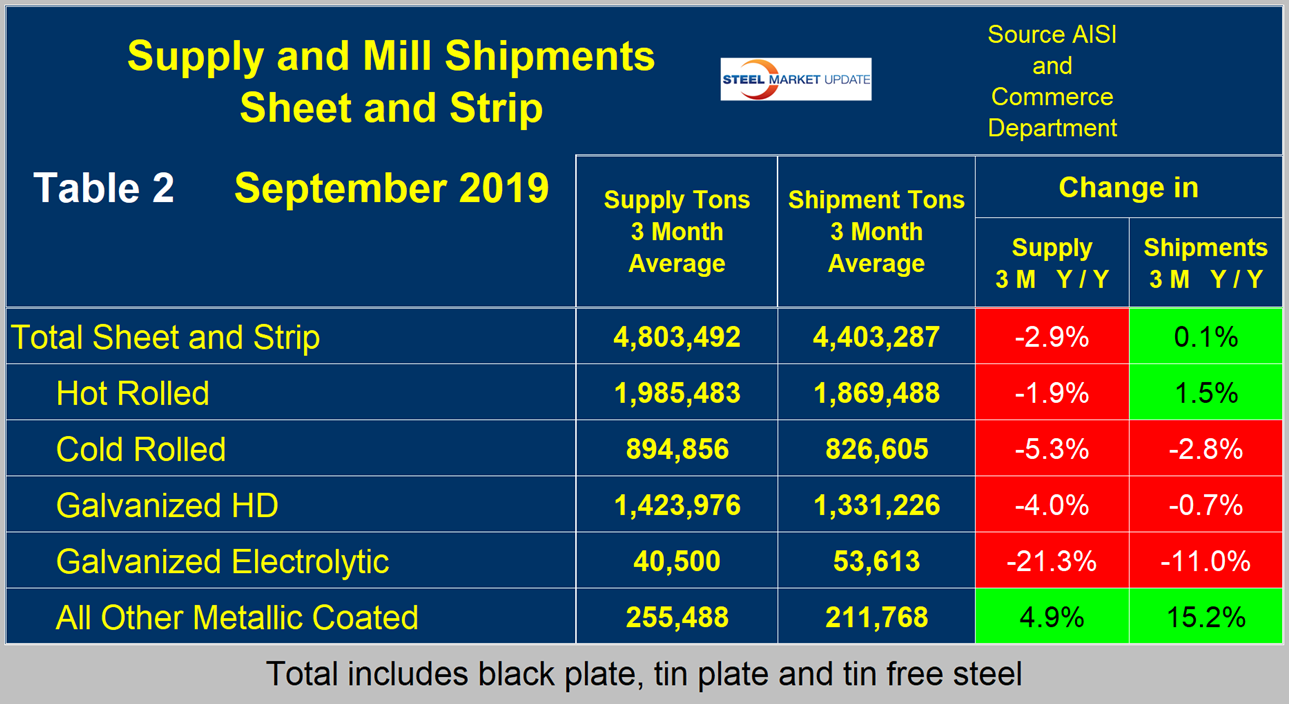
Table 3 shows that total supply of sheet and strip products including hot rolled, cold rolled and all coated products increased in the three months through September compared to three months through June. However, all sheet products had negative supply growth in three months through September year over year.
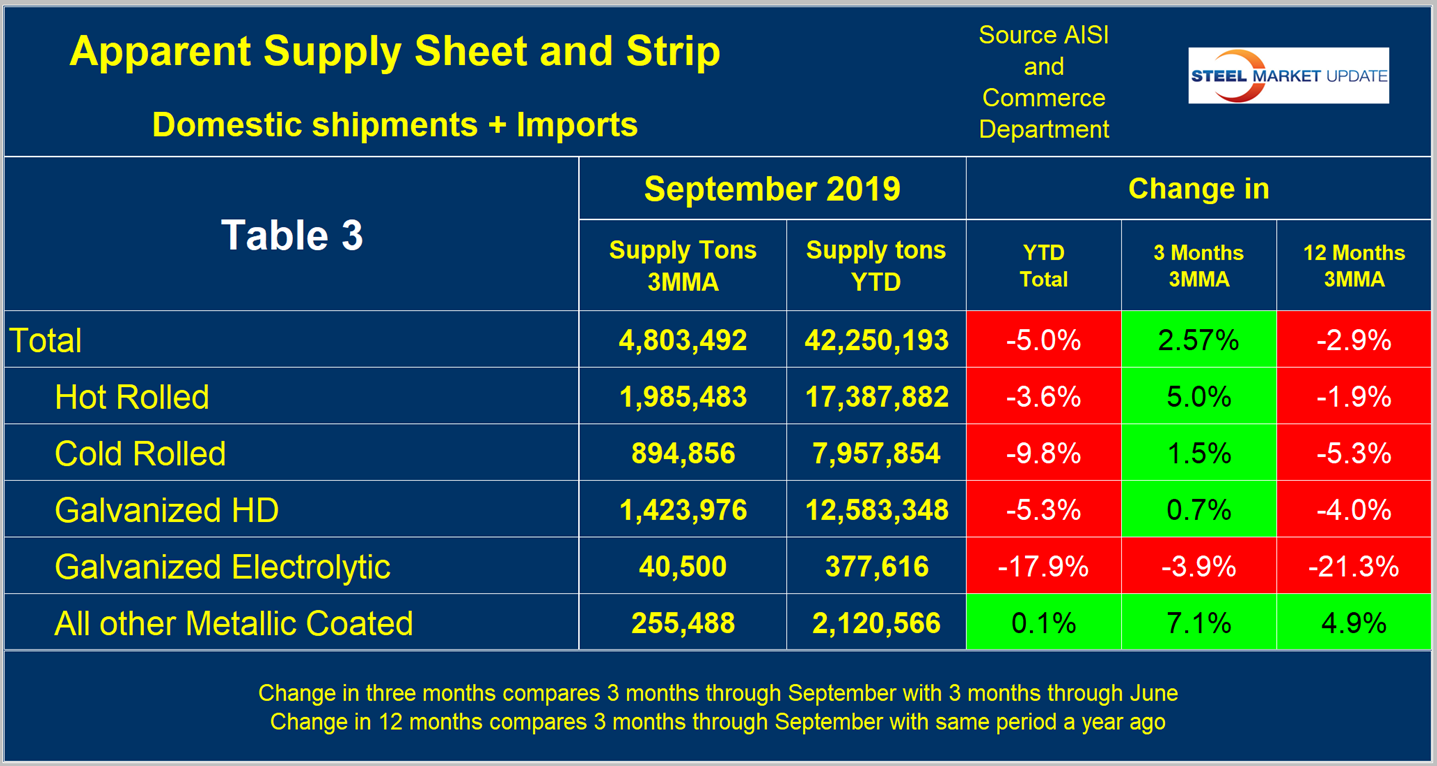
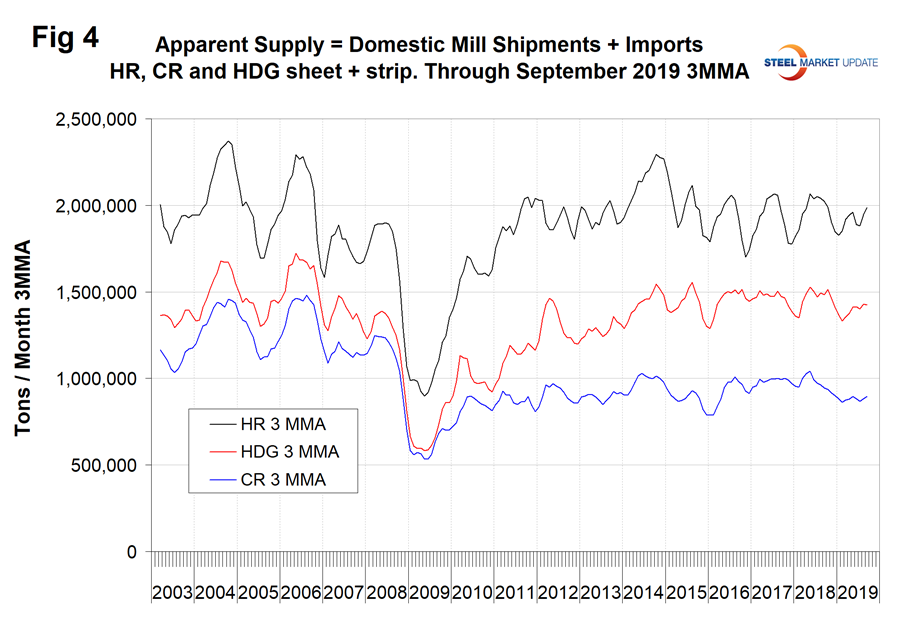
Figure 4 shows the long-term supply picture for the three major sheet and strip products, HRC, CRC and HDG, since January 2003 as three-month moving averages.
The dramatic difference between long and sheet products is shown in a comparison between Table 2 and Table 4. All the long product constituents except structural shapes had positive growth of both shipments and supply year over year. Long products are driven more by construction and less by manufacturing. Sheet products have the reverse drivers. Figure 5 shows the same result for longs on a graphical basis.
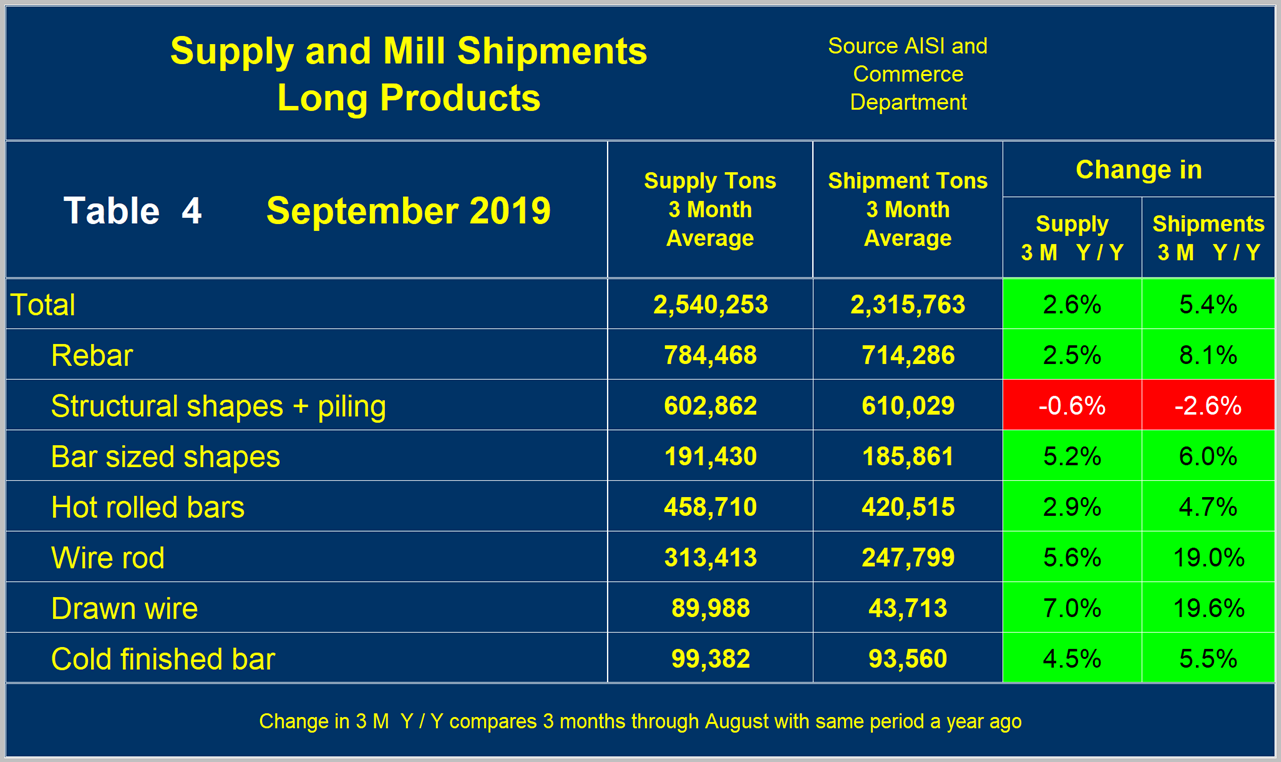
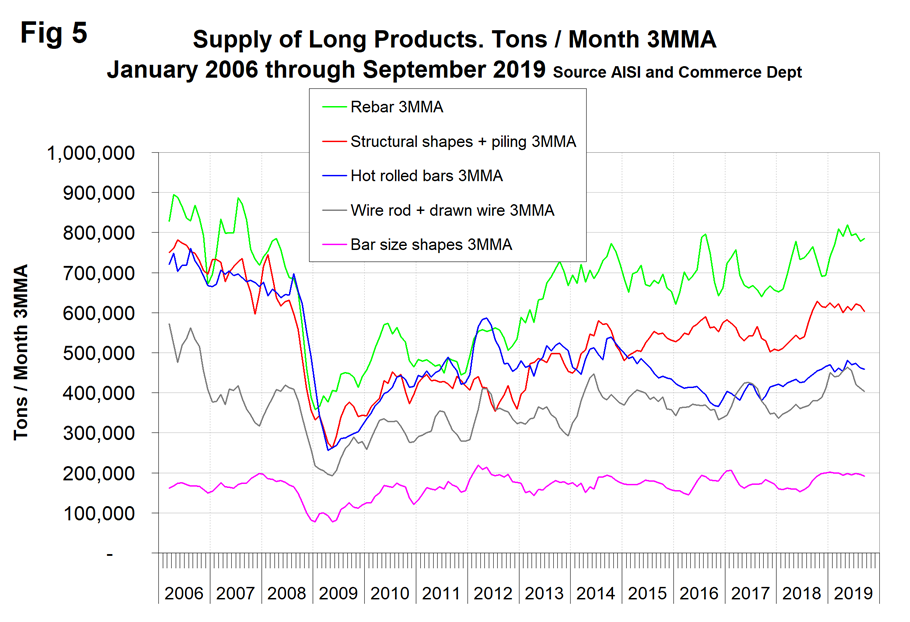
Figure 6 shows the long-term comparison between flat and long products. These are monthly numbers (not 3MMA) and clearly show the trend difference between longs and flat products including plate. The trend of flat rolled has been a decline since March last year as longs have trended up. It looks as though long products are now past their recent peak as construction expenditures are declining.
SMU Comment: The demand for sheet products declined in September by more than the seasonal norm. In the period June through September, there was a decline in construction expenditures for the first time since November 2011. This trend now appears to be negatively affecting long product demand. Sheet product demand is being adversely affected by the weakness of manufacturing industries, which has been intensifying since April this year. Since last November, the long product mills have had higher capacity utilization than the flat rolled mills for the first time since October 2012.


