

Market Data

October 1, 2019
BEA: U.S. GDP Grew by 2.01 Percent in Q2
Written by Peter Wright
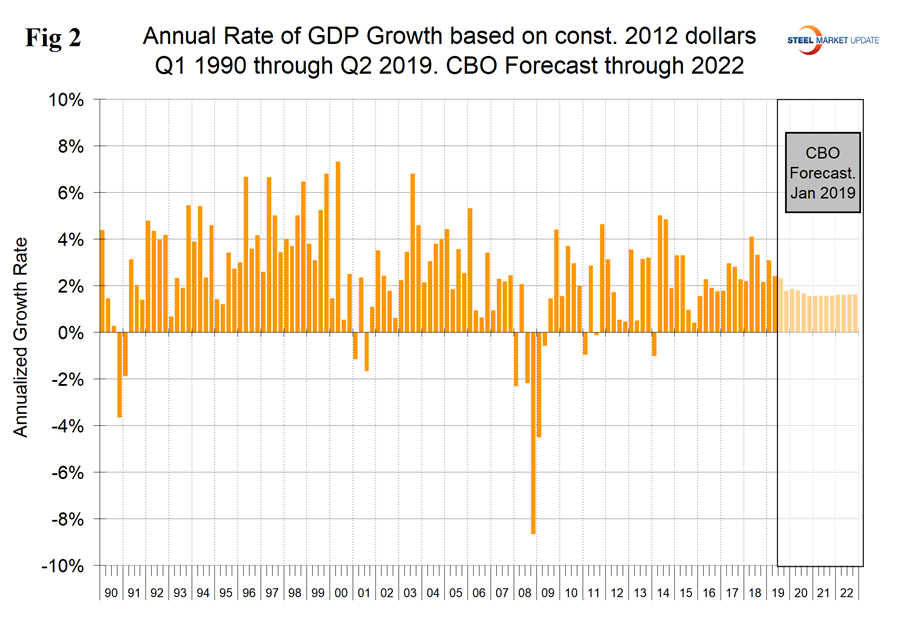
The third estimate of U.S. GDP growth in Q2 2019 at 2.01 percent was little changed from the first estimate.
U.S. GDP is reported quarterly by the Bureau of Economic Analysis (BEA). There are three estimates. The first is released about 25 days after the end of the quarter and the second and third are released one and two months later. SMU reported on the first estimate in late July. Since there was so little change between the first and third estimates, we will limit ourselves in this writeup to the revised exhibits
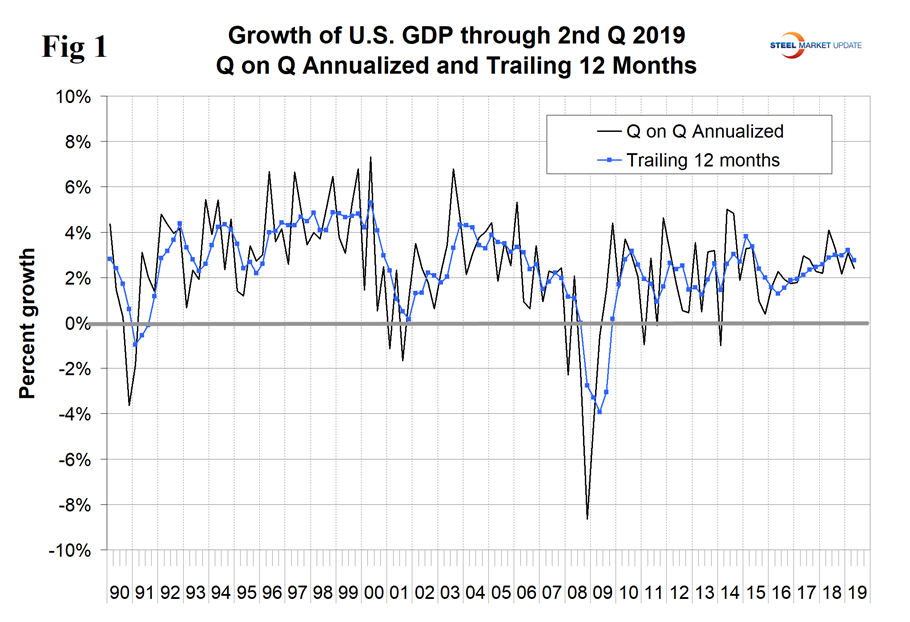
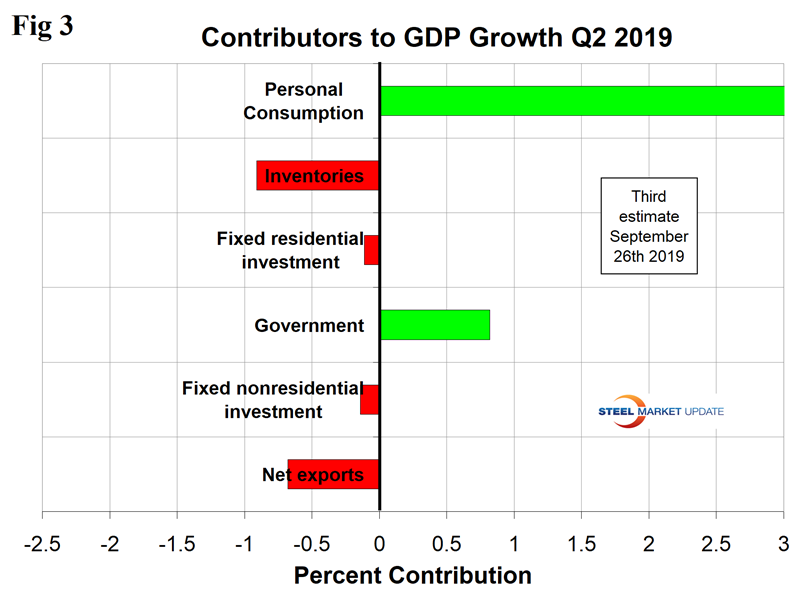
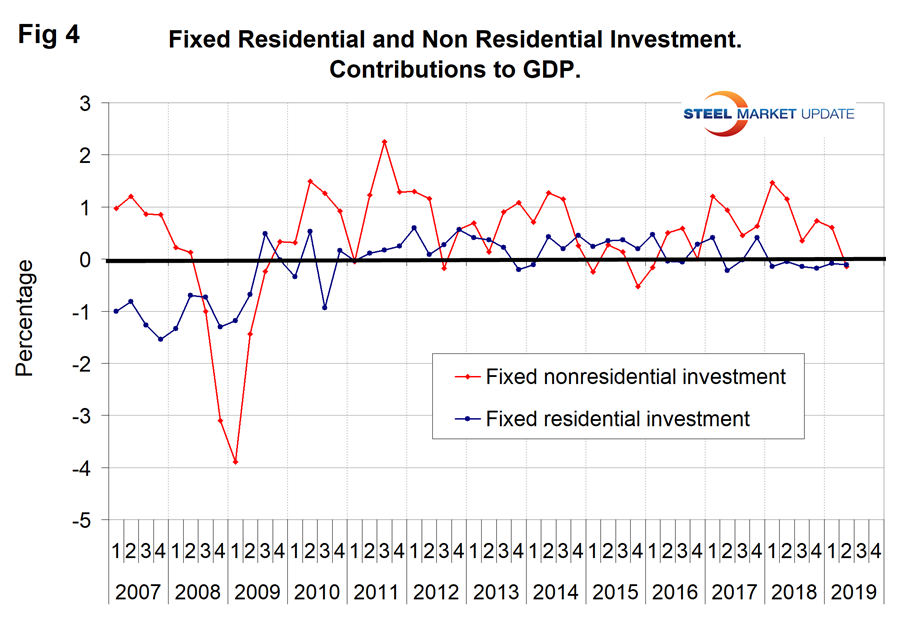
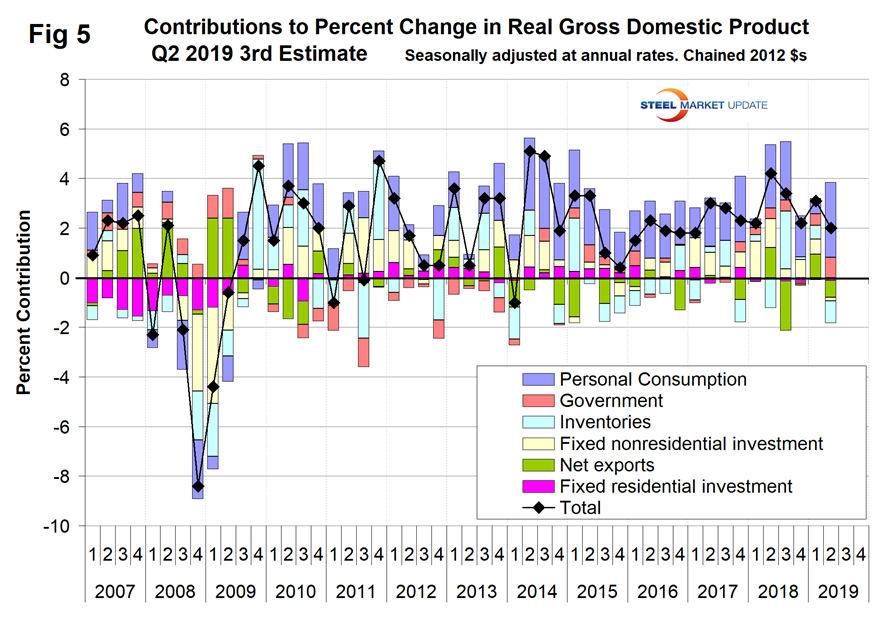
SMU Comment: Personal consumption expenditures bounced back in the second quarter from an unusually low result in the first. The slight decline in both residential and nonresidential construction is supportive of other construction data that we report. The trailing 12-month growth rate shown in Figure 1, which we think is the best way to look at this data, declined in the second quarter for the first time since the second quarter of 2016. (Fourth-quarter 2018 was also down, but only very slightly).
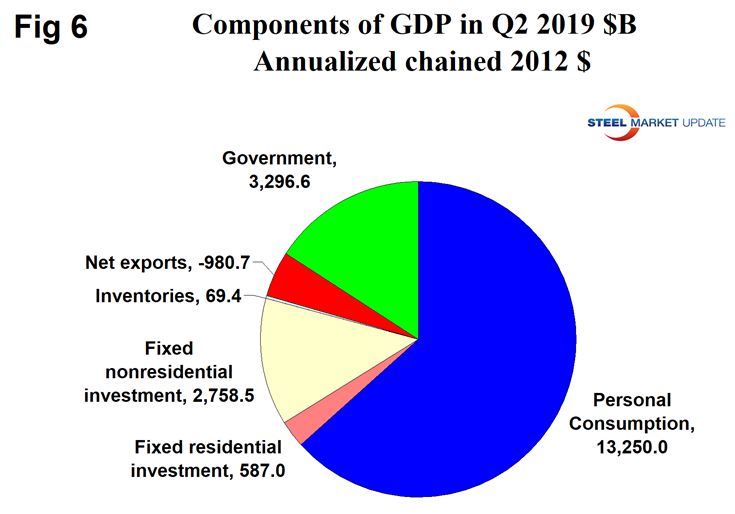
GDP is defined as Consumption (C) plus Investment (I) plus Government Spending (G) plus [Exports (E) minus Imports (I)] or: GDP = C + I + G + (E-I)
This equation is known as an identity. An identity is an equality that remains true regardless of the values of any variables that appear within it. That means it is not a guess or an approximation. It is simple reality.
Another definition of GDP states that it equals the growth in working population multiplied by their productivity.


