Prices

September 26, 2019
Hot Rolled Futures Prices Continue their Slide
Written by Jack Marshall
The following article on the hot rolled coil (HRC) steel and financial futures markets was written by Jack Marshall of Crunch Risk LLC. Here is how Jack saw trading over the past week:
Steel
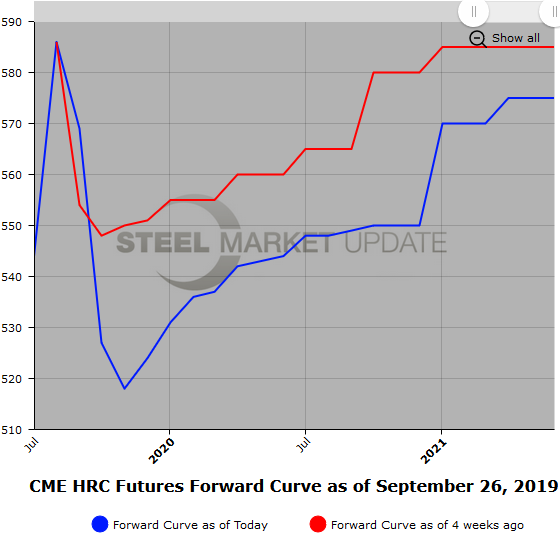
A $17/ST drop in Midwest HR spot prices as reflected in the decline of the CME August HR average and the September HR average ($586/ST and $569/ST) is overshadowed by a bigger slide in HR futures prices. Since the end of August, settlement values for the HR forward curve have on average declined by about $25/ST. The biggest declines have come further out the forward curve. For the period 30 Aug’19 to 25 Sep’19, Q4’19 HR futures have declined $21/ST, Q1’20 HR futures have declined $15/ST, Q2’20 HR futures have declined $23/ST, Q3’20 HR futures have declined $27/ST, and Q4’20 HR futures have declined $40/ST. In the most active trading months out to Sep’20, the HR forward curve shape is only slightly steeper at $27/ST contango (Nov’19 $548/ST to Sep’20 $575/ST).
We have observed a healthy selling interest in the Q4’19 months recently with some pickup in inquiries for offers in the Q1 and Q2’20 HR futures. Earlier today, Nov’19 HR futures traded as low as $512/ST.
Many participants are sidelined as they wait for clearer signals to enter hedges due to growing concerns: Too much HR capacity, steady to weakening demand, weakening business indicators, soft mill lead times, slackening transport price indicies, declining scrap prices. Hopefully, lower interest rates will start to bite and give this market some much needed support.
Below is a graph showing the history of the CME Group hot rolled futures forward curve. You will need to view the graph on our website to use its interactive features; you can do so by clicking here. If you need assistance with either logging in or navigating the website, please contact us at info@SteelMarketUpdate.com.
Scrap
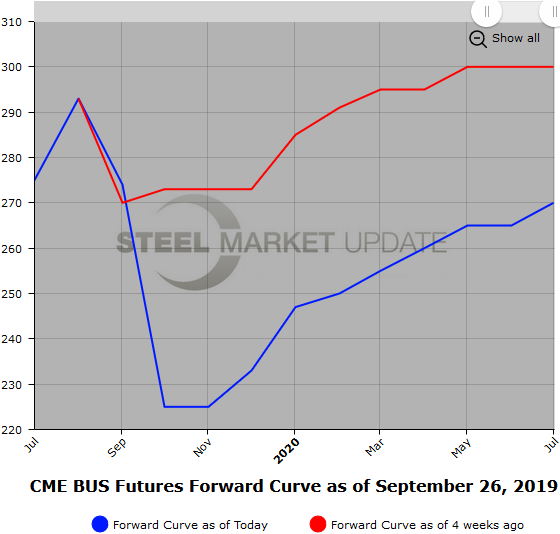
Early chatter has Oct’19 BUS spot declining by at least $20/GT, which puts it in the mid $230/GT area. This expected softness in prices is reflected in near date BUS futures, which have come under some selling pressure of late. The average BUS futures price drop between 30 Aug’19 and 25 Sep’19 was just shy of $41/GT. The futures curve has gotten steeper with Oct’19 BUS futures valued at a $52/GT discount to the Sep’20 BUS future.
Q4’19 BUS futures were last trading below $235/GT. Volumes have been modest with many potential buyers of paper sidelined given the low current prices as participants wait for a clear sign the market is ready to turn.
Below is another graph showing the history of the CME Group busheling scrap futures forward curve. You will need to view the graph on our website to use its interactive features; you can do so by clicking here.