

Market Data

June 13, 2019
Shipments and Supply of Steel Products Through April
Written by Peter Wright
Steel Market Update is pleased to share this Premium content with Executive-level members. For more information on how to upgrade to a Premium-level subscription, email Info@SteelMarketUpdate.com.
Demand for long products is strong, driven by construction, while demand for sheet is declining, according to this SMU analysis of the latest data from the American Iron and Steel Institute (AISI) and the U.S. Department of Commerce (DoC). The analysis summarizes total steel supply by product from 2003 through April 2019 and year-on-year changes. The supply data is a proxy for market demand, which does not take into consideration inventory changes in the supply chain. Our analysis compares domestic mill shipments with total supply to the market. It quantifies market direction by product and enables a side-by-side comparison of the degree to which imports have absorbed demand.
Figure 1 shows that last year’s robust growth in U.S. raw steel production has slowed in 2019, but is still positive 4.4 percent year over year through June 8. This is a four-week moving average and is based on weekly data from the AISI.
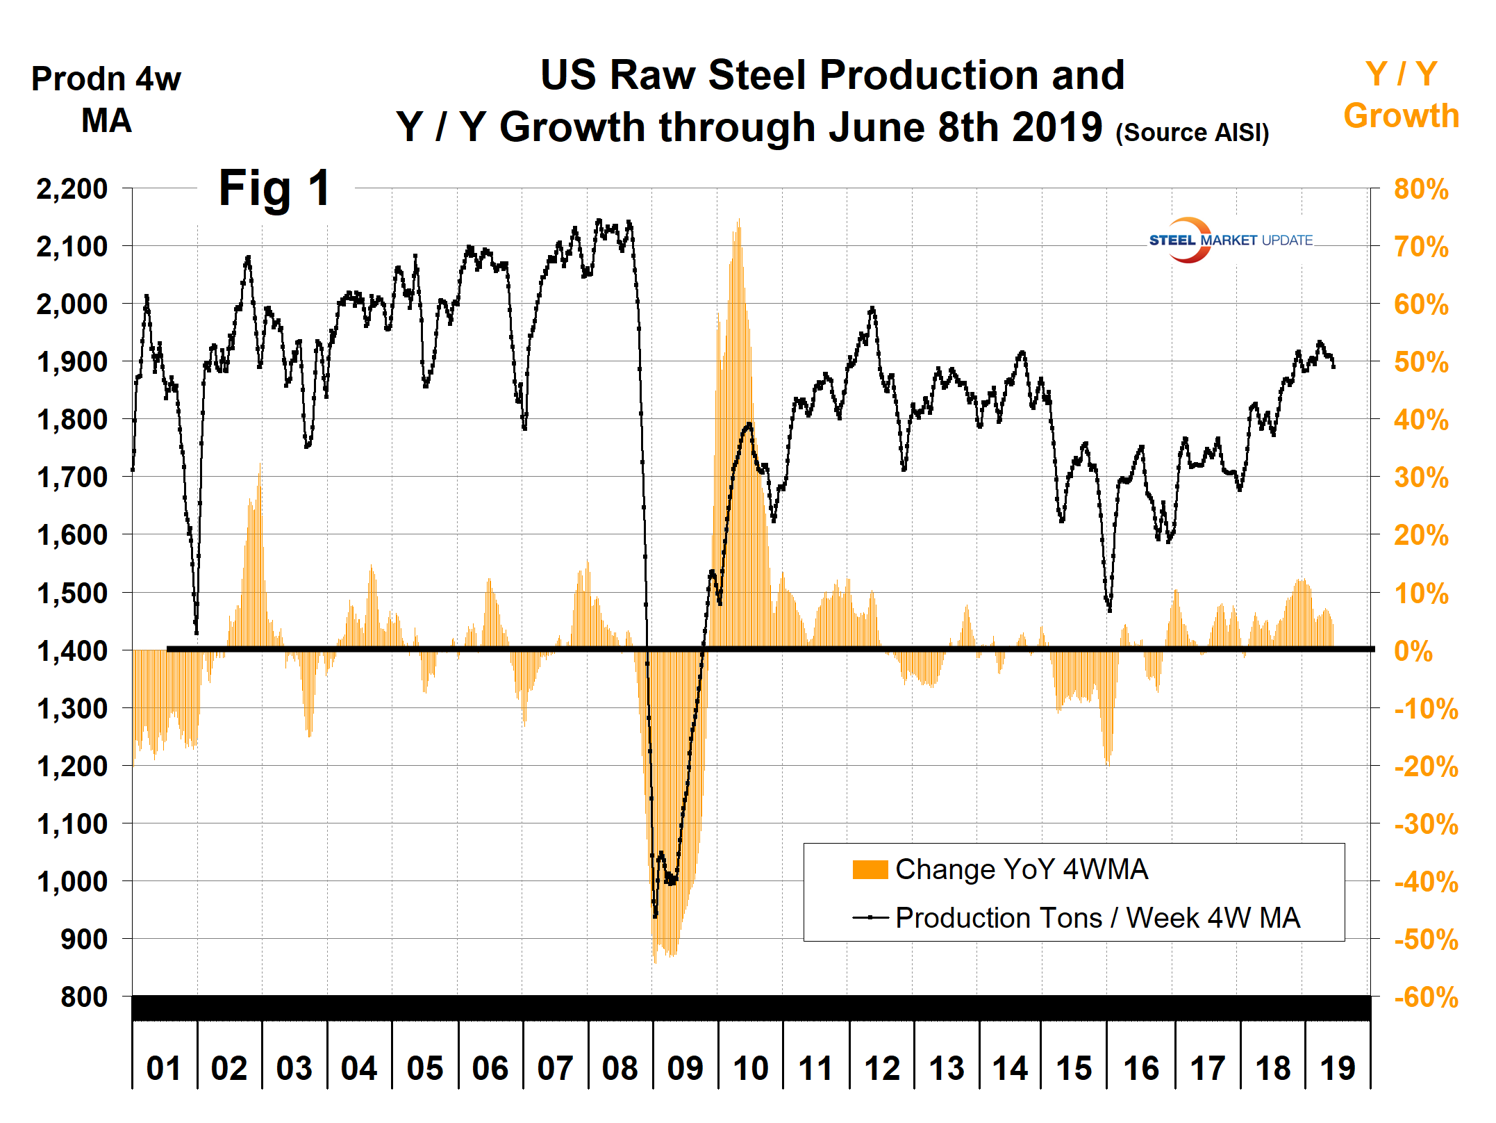
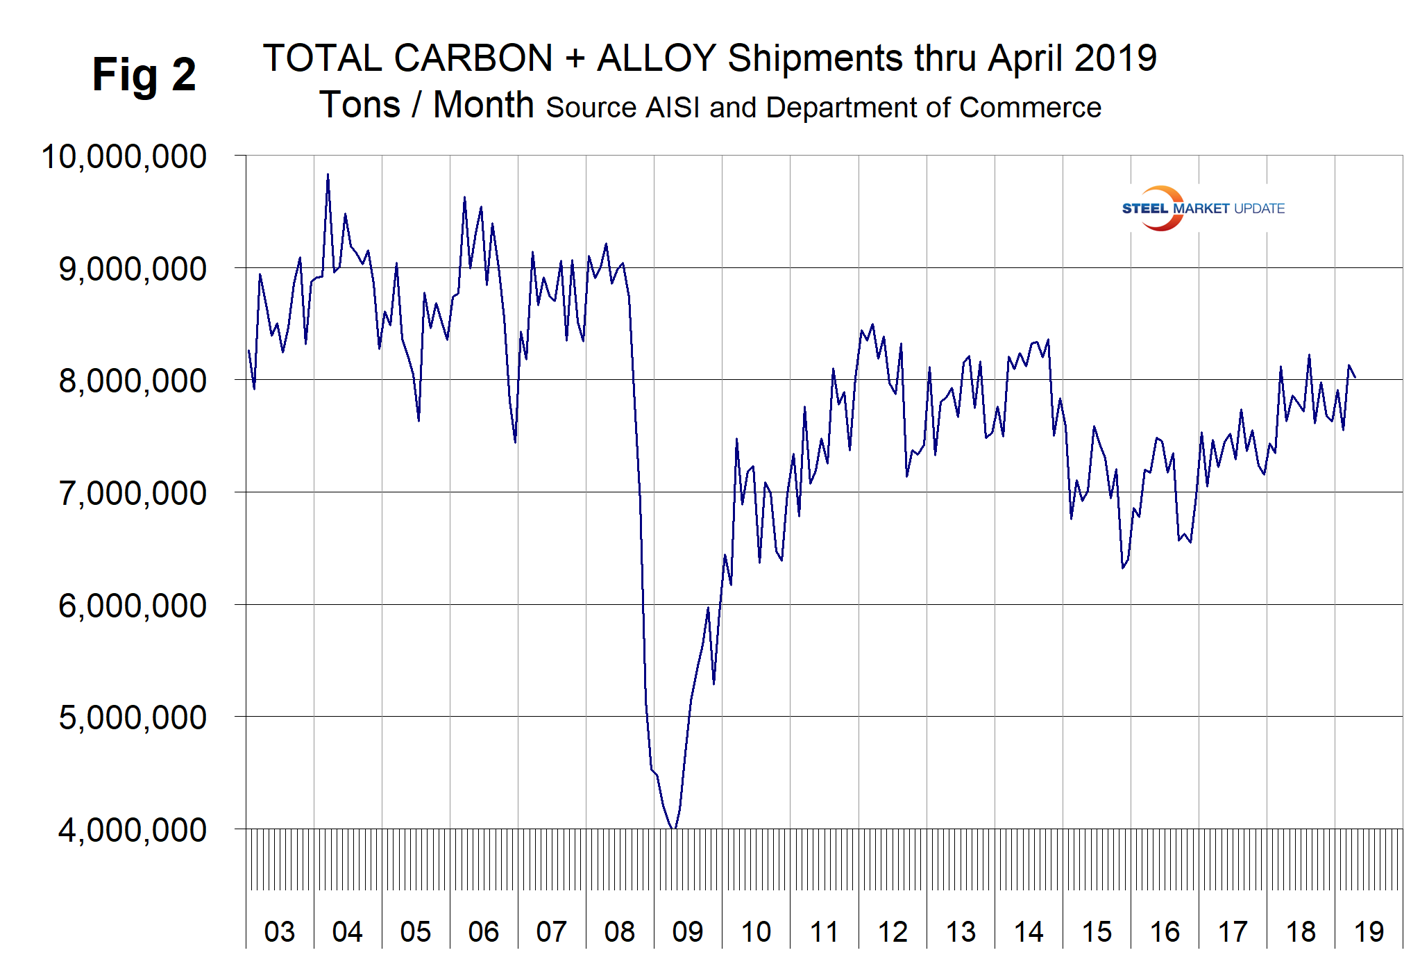
The shipments and supply report you are reading now is based on monthly shipments by product as reported by the AISI, plus import and export data from the Department of Commerce. Figure 2 shows the monthly shipment data for all rolled steel products. In the long run, the trajectories of growth in Figures 1 and 2 are basically the same.
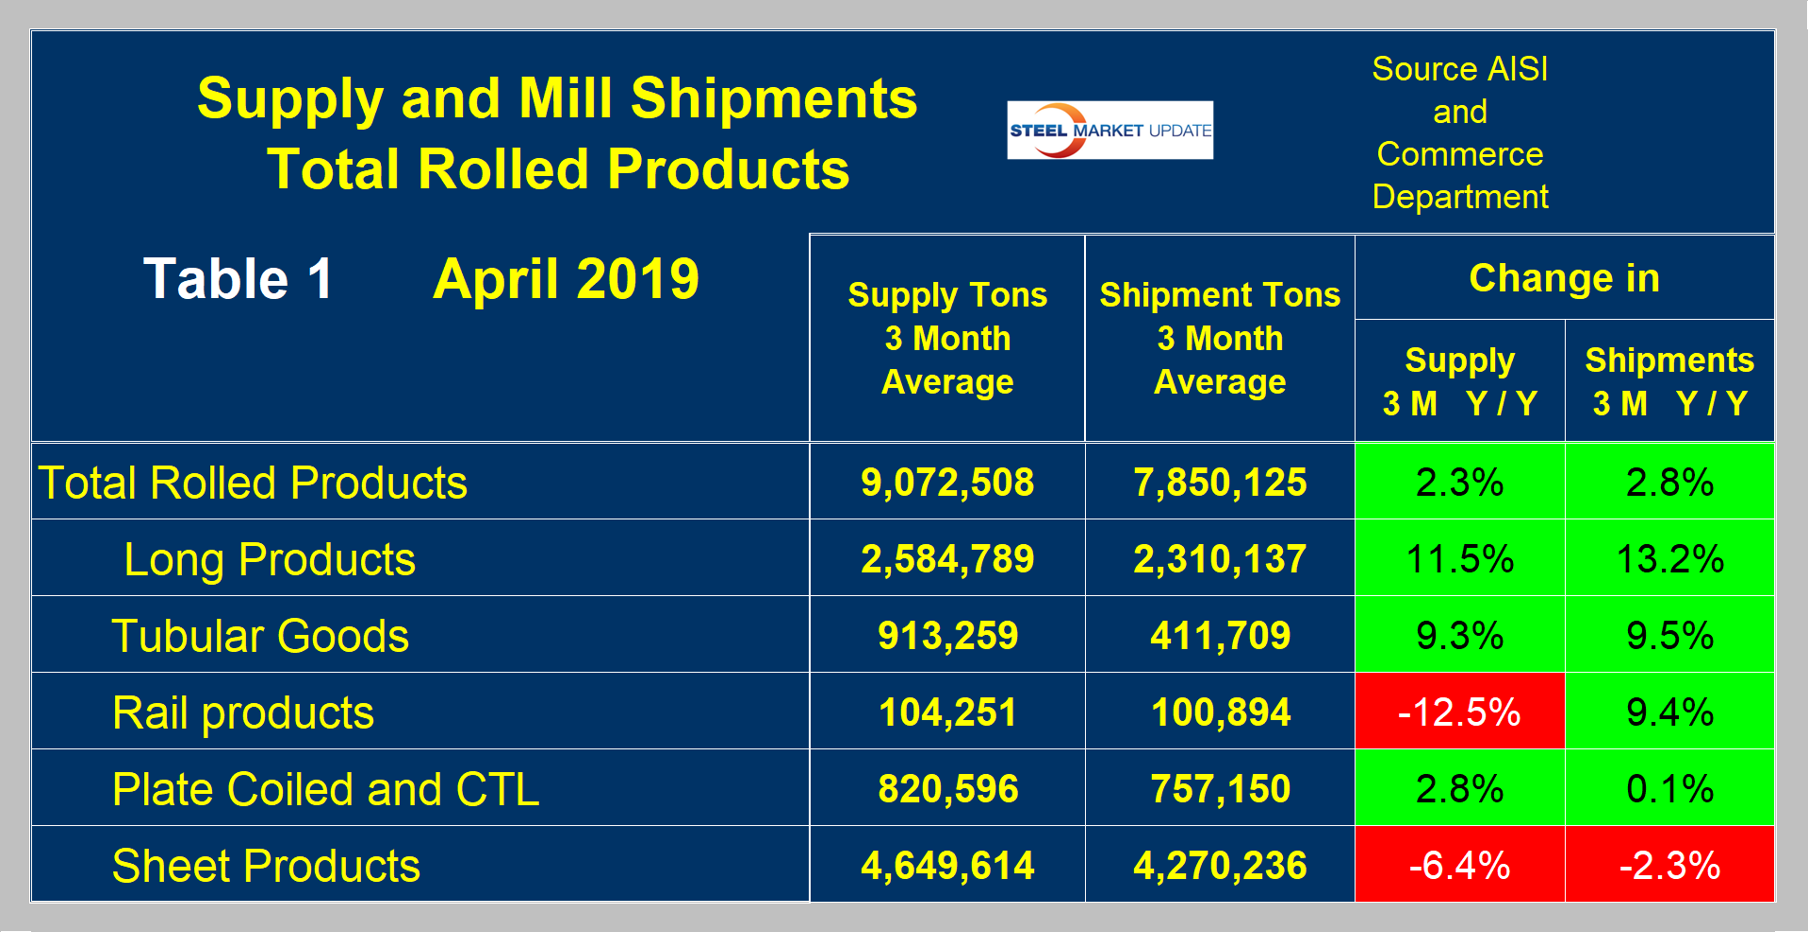
First, though, we will look at the shipment and supply situation for all product groups to see how much difference there is between them. Table 1 is this compilation. Total supply (proxy for market demand) as a three-month moving average (3MMA) was up by 2.3 percent, and mill shipments were up by 2.8 percent, meaning that imports took a smaller slice of the pie in the three months through April year-over-year. There is a big difference between products. Sheet products had a year-over-year decline in both shipments and supply. Long products had double-digit growth in both shipments and supply, and tubular goods shipments and supply were both higher than 9 percent. The domestic plate producers lost ground to imports and eked out a very small year-over-year growth in shipments.
Now let’s look at sheet products in detail. One consideration is that demand in April has on a 10-year historical average been down by 2.1 percent from March. This year, April was up by 1.3 percent, therefore better than normal. Figure 3 shows the seasonality that has existed since January 2010.
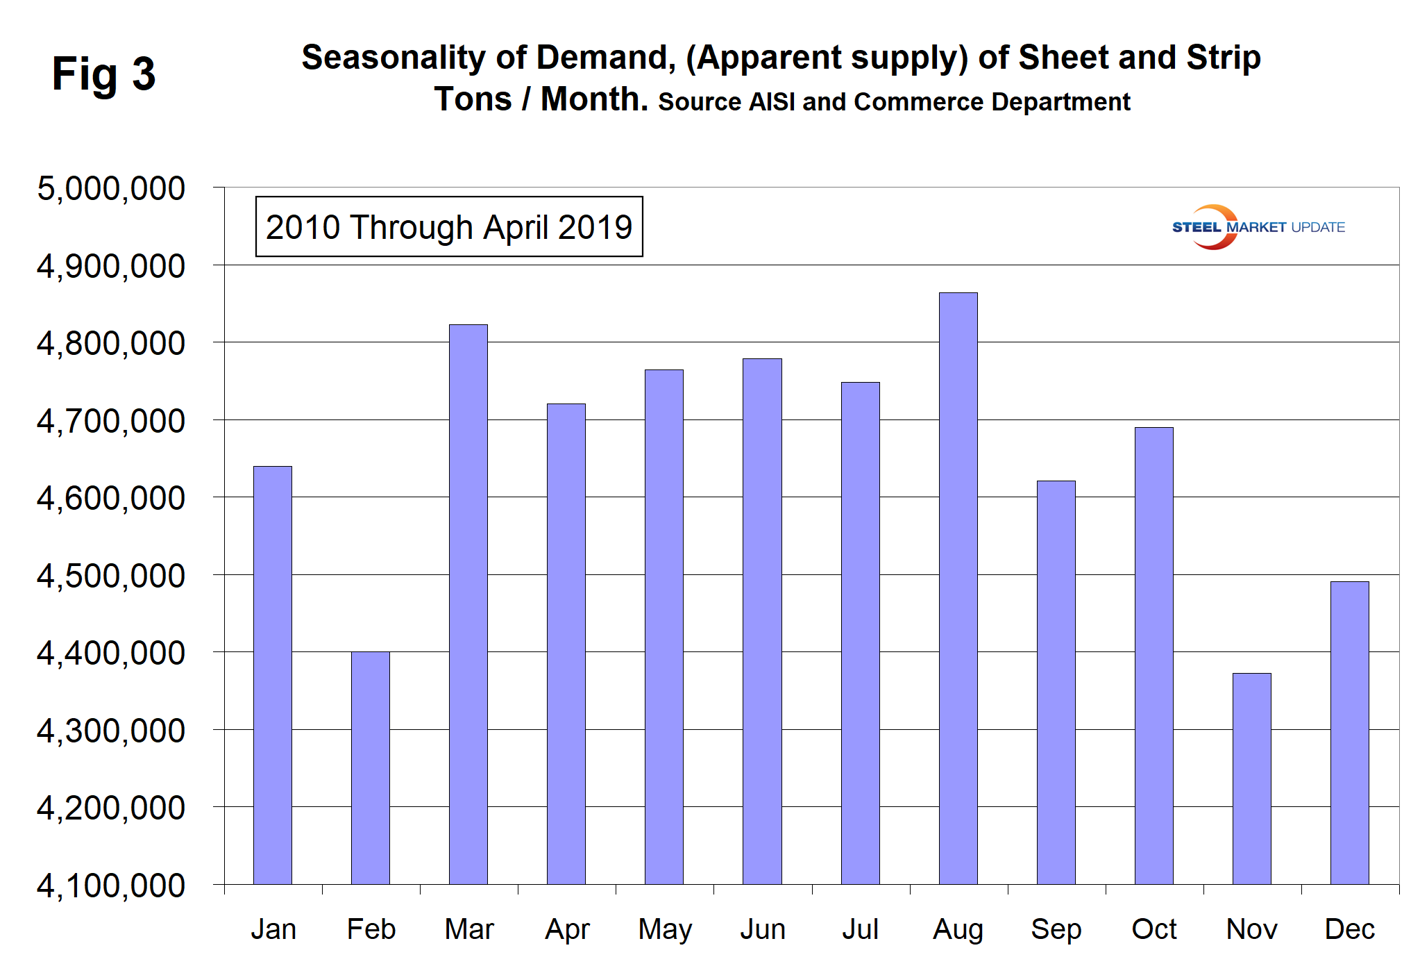
Table 2 describes both apparent supply and mill shipments of sheet products (shipments includes exports) side by side as three-month averages through April with year-over-year growth rates for each. Comparing the year-over-year time periods, total supply of sheet products to the market decreased by 6.4 percent and mill shipments decreased by 2.3 percent. Table 2 breaks down the total into product detail and shows that supply was down for all five sheet products considered in this report. Domestic mill shipments were down year-over-year for cold rolled and galvanized, but hot rolled and other metallic coated had positive growth. Apparent supply is defined as domestic mill shipments to domestic locations plus imports. In the three months through April 2019, the average monthly supply of sheet and strip was 4.649 million tons. There is no seasonal manipulation of any of these numbers. By definition, year-over-year comparisons have seasonality removed. Table 2 shows the change in supply by product on this basis through April.
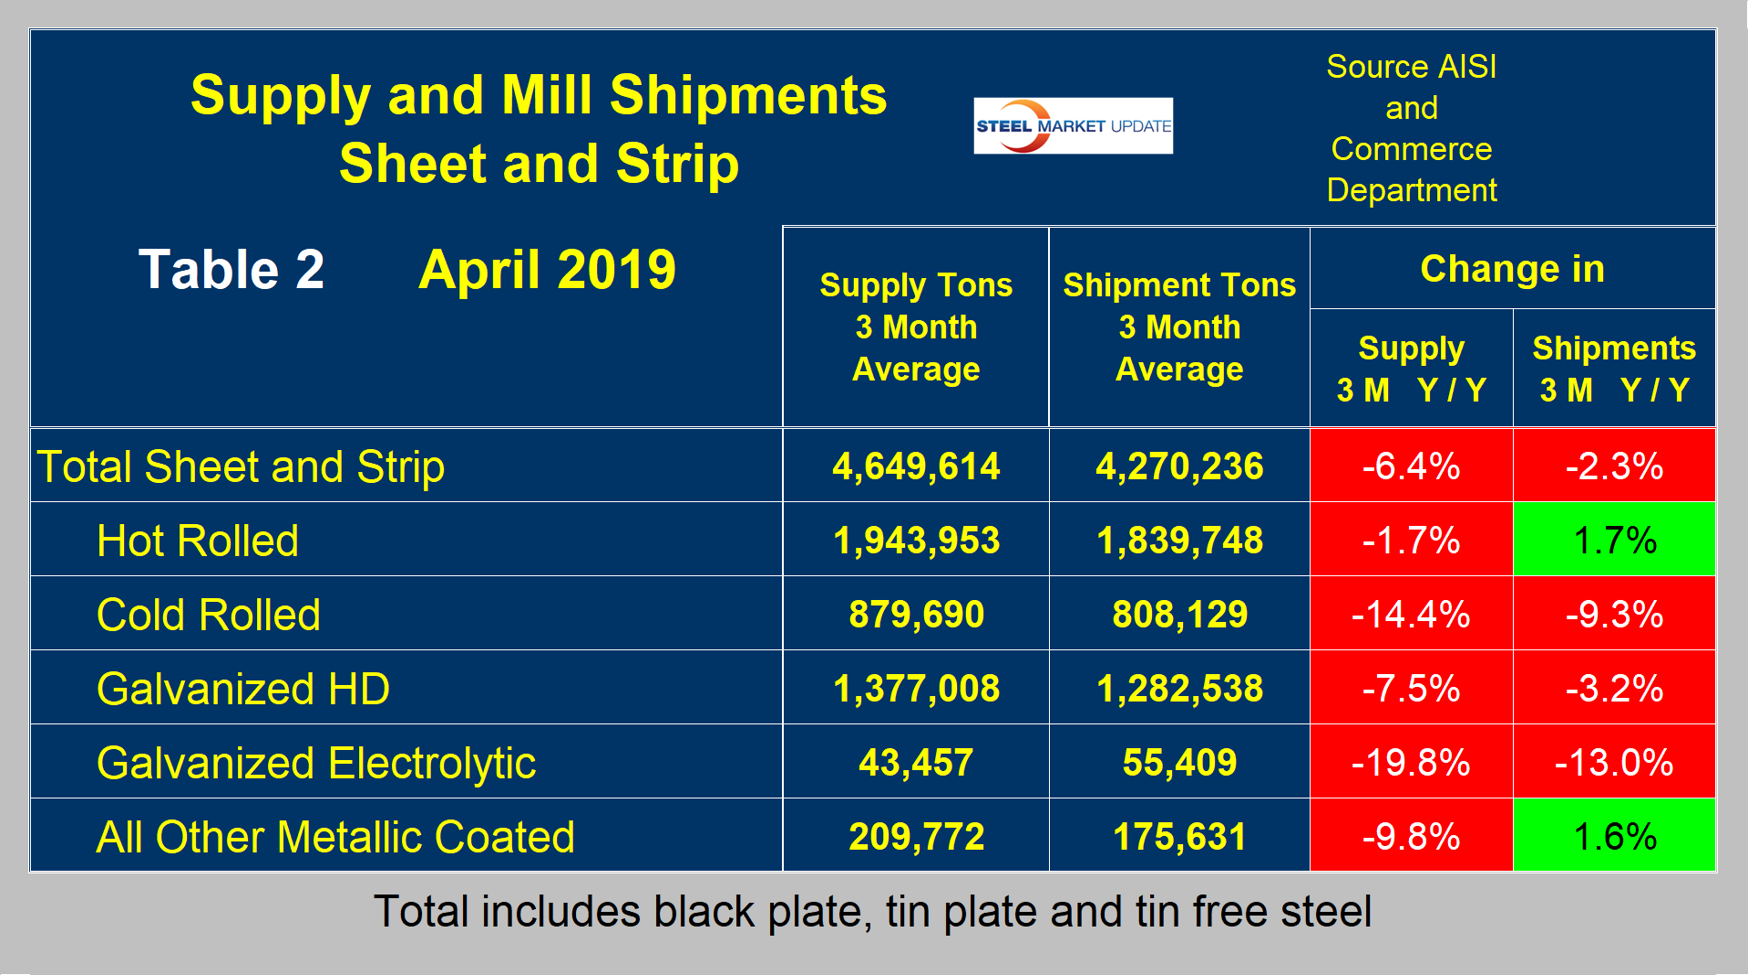
Figure 4 shows the long-term supply picture for the three major sheet and strip products, HRC, CRC and HDG, since January 2003 as three-month moving averages.
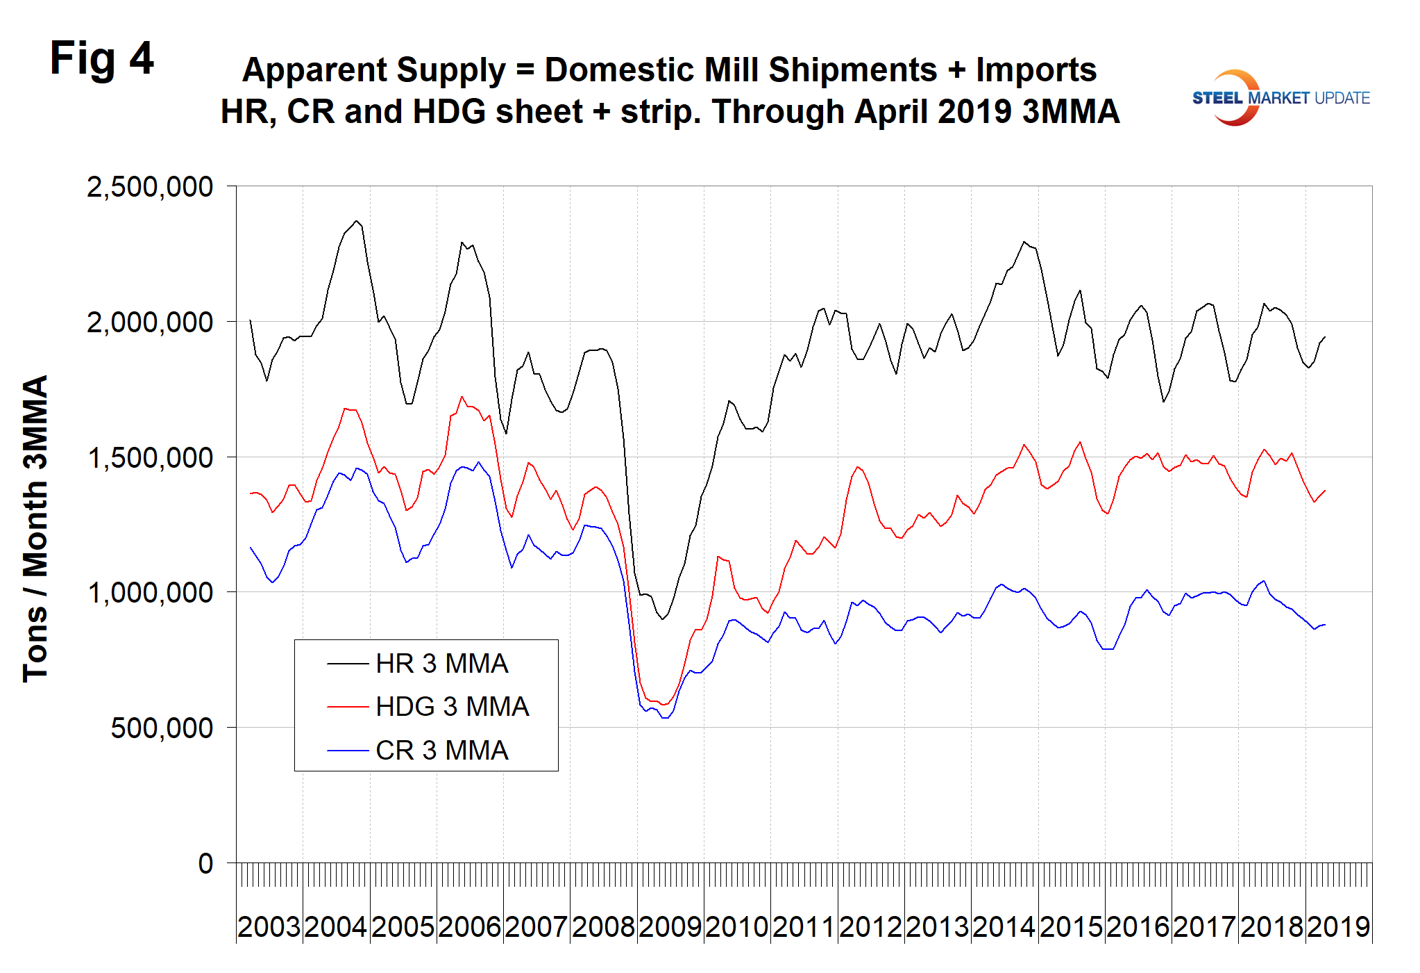
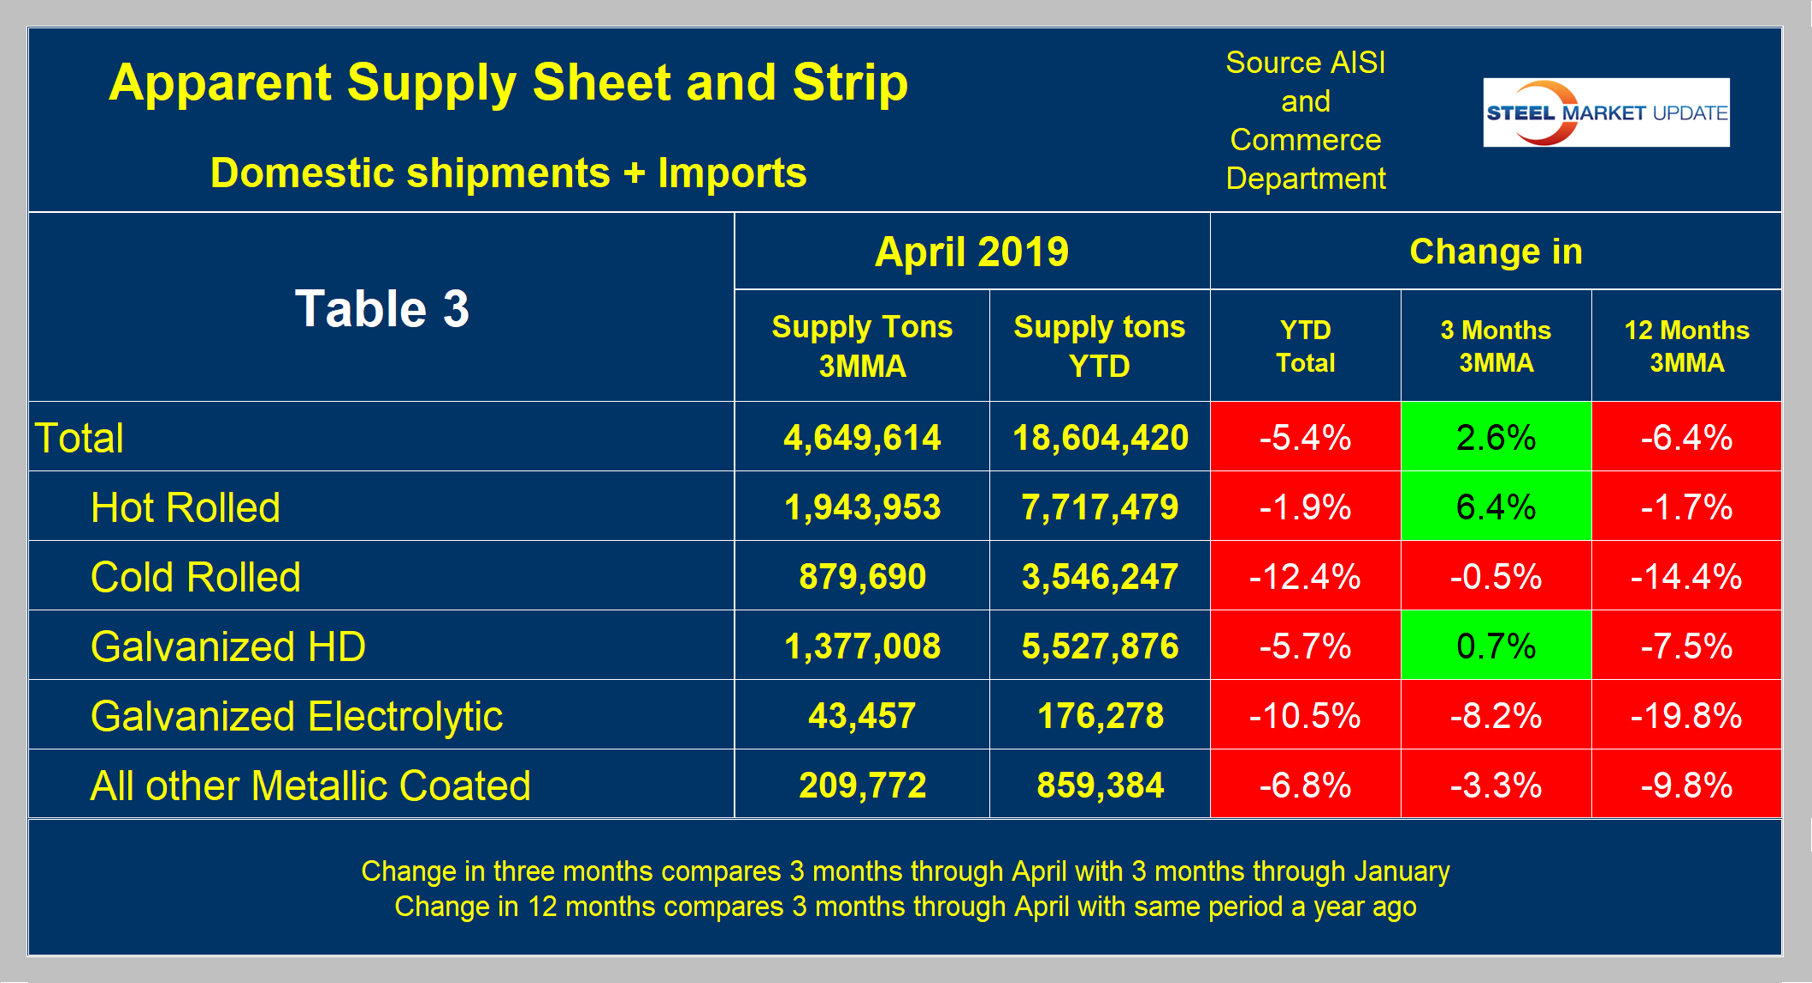
Table 3 shows that total supply of sheet and strip products including hot rolled, cold rolled and all coated products decreased by 5.4 percent year-to-date and increased by 2.6 percent comparing three months through April with three months through January.
SMU Comment: Long products are experiencing very strong demand and mill shipments, driven by the booming construction industry. Since last November, the long product mills have had higher capacity utilization than the flat rolled mills for the first time since October 2012. In the last six months, total steel production in the U.S. has been higher than at any time since September 2014, as shown in Figure 1, but is still well below the pre-recession level. Year-over-year through April, total demand for sheet products was down by 5.4 percent. All five products detailed in this report were down, ranging from 1.9 percent for hot rolled to 12.4 percent for cold rolled.


