Prices

April 25, 2019
Hot Rolled Futures: Finally Some Follow Through
Written by Jack Marshall
The following article on the hot rolled coil (HRC) steel and financial futures markets was written by Jack Marshall of Crunch Risk LLC. Here is how Jack saw trading over the past week:
Finally some follow through lower in both steel and scrap futures prices. Should flattish forward curves be a concern?
Steel
The latest HR index pulled the CME HR April 2019 average for the month below $690/ST. Most of the HR indexes are now under $680/ST, which has put some selling pressure on the HR futures, especially in this last week. As you might expect with a bigger move lower, we have had increased HR futures trading activity with over 90,000 ST trading just since the Easter weekend. The prices for the whole forward curve have dropped on average about $30/ST since the beginning of April with most of the decline in the last week. The nearby months prices have declined about $40/ST since the beginning of April.
Despite concerns of lower import prices and potential adjustments to the tariffs, the forward curve while backwardated remains relatively flat but at a good discount to the settling month (April 2019 $688/ST). For example, spot month future (May 2019) settlement value is $655/ST versus Dec’19 settlement value of $638/ST. The forward discount is below $1.50/ST per month out 12 months. For comparison of the forward curve, last year on April 24, 2018, May’18 HR was valued at $864/ST versus Apr’19 HR which was valued at $741/ST, a $123/ST discount or average monthly $10.25 discount. Given that the HR prices were at loftier levels, the curve reflected an expectation that prices needed to retrace. At the current lower trading prices the forward curve reflects a fairly neutral bias for prices going forward. However, this week’s selling pressure on prices and the increased activity in time spreads suggests we could be reaching some price equilibrium at least for the near term.
Below is a graph showing the history of the CME Group hot rolled futures forward curve. You will need to view the graph on our website to use its interactive features; you can do so by clicking here. If you need assistance with either logging in or navigating the website, please contact us at info@SteelMarketUpdate.com.

Scrap
The market chatter has May’19 BUS declining about $20/GT. So the market is looking for it to be around $330/GT. Scrap trading activity has also picked up this month on the back of an increase in market inquiries. In the last two weeks over 27,000 GT of BUS futures have been traded.
Jun’19 BUS through Sep’19 BUS futures are currently $340/GT bid with about $10/GT of backwardation out 12 months. We have also been getting a number of inquiries for the 1H’20 BUS, which given that the HR minus BUS spread for 1H’20 is right around $320 bid implies a $320 offer for 1H’20 BUS basis a $640/ST offer in HR for the same period.
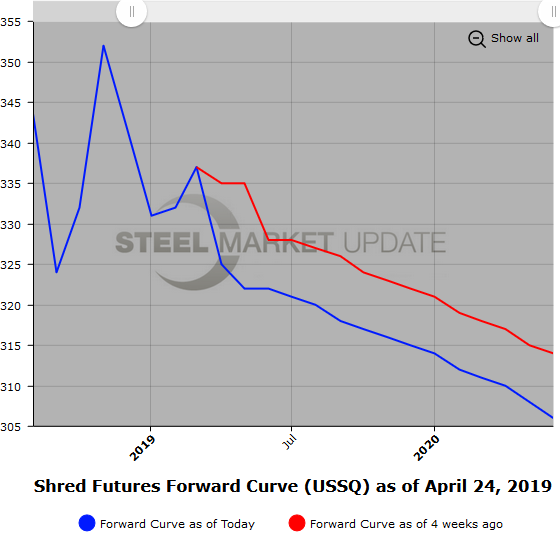
There’s some discussion that the May’19 USSQ price will fall by $20-$25/GT. Jun’19 Shred selling interests have been hovering around $315/GT, which seems a bit rich with May’19 expected to come in near $300/GT. So, given today’s push lower in prices in both HR and BUS, we could see the Jun’19 USSQ offers move lower.
Below is another graph showing the history of the CME Group busheling scrap futures forward curve. You will need to view the graph on our website to use its interactive features; you can do so by clicking here.

We have started tracking USSQ shredded scrap futures, shown below. Once we have built a sizable database, we will add this data to our website.


