Market Data

April 23, 2019
SMU Currency Analysis: U.S. Dollar Weakens
Written by Peter Wright
In the last three months, the dollar weakened against seven of the 16 steel trading currencies that Steel Market Update tracks and strengthened against the other nine. At the one-month level, the dollar weakened against five of the 16, and strengthened against the other 11. At the seven-day level, the dollar strengthened against 12 of the 16. Please see the end of this report for an explanation of data sources.
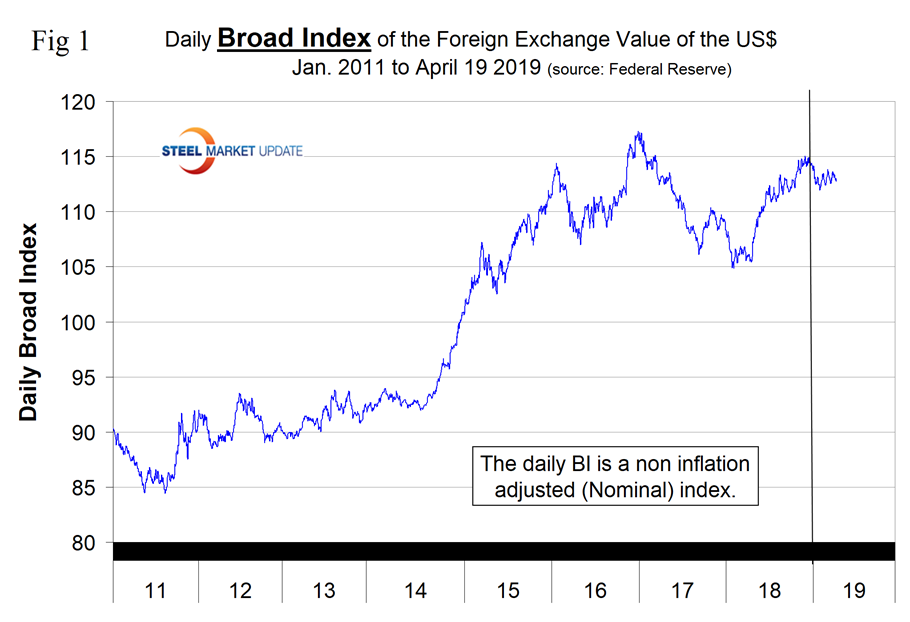
![]() The Broad Index value of the U.S. dollar is reported several days in arrears by the Federal Reserve; the latest value published was for April 15. Figure 1 shows the index value since January 2011. On April 15, the index value was 112.74, down from 113.73 on Jan. 1. The index is based on January 2006 = 100. The dollar had a recent low of 84.48 on May 2, 2011, and a recent high of 117.31 on Dec. 28, 2016. One of the primary drivers of the value of the U.S. dollar is the differential between U.S. interest rates and those of our major trading partners. Another is the fear index that causes a flight to a safe haven (the U.S. dollar) when traders are nervous.
The Broad Index value of the U.S. dollar is reported several days in arrears by the Federal Reserve; the latest value published was for April 15. Figure 1 shows the index value since January 2011. On April 15, the index value was 112.74, down from 113.73 on Jan. 1. The index is based on January 2006 = 100. The dollar had a recent low of 84.48 on May 2, 2011, and a recent high of 117.31 on Dec. 28, 2016. One of the primary drivers of the value of the U.S. dollar is the differential between U.S. interest rates and those of our major trading partners. Another is the fear index that causes a flight to a safe haven (the U.S. dollar) when traders are nervous.
Each month, SMU publishes an update of Table 1. Table 1 shows the number of currency units it takes to buy one U.S. dollar and the percent change in the last year, three months, one month and seven days for 16 major global steel and iron ore trading nations. The table shows the change in value through April 19. Currencies that weakened against the U.S. dollar are color coded in red. Green indicates currencies that strengthened against the U.S. dollar. The currencies of these 16 don’t necessarily follow the broad index and in fact at any given time some are always moving in the opposite direction.
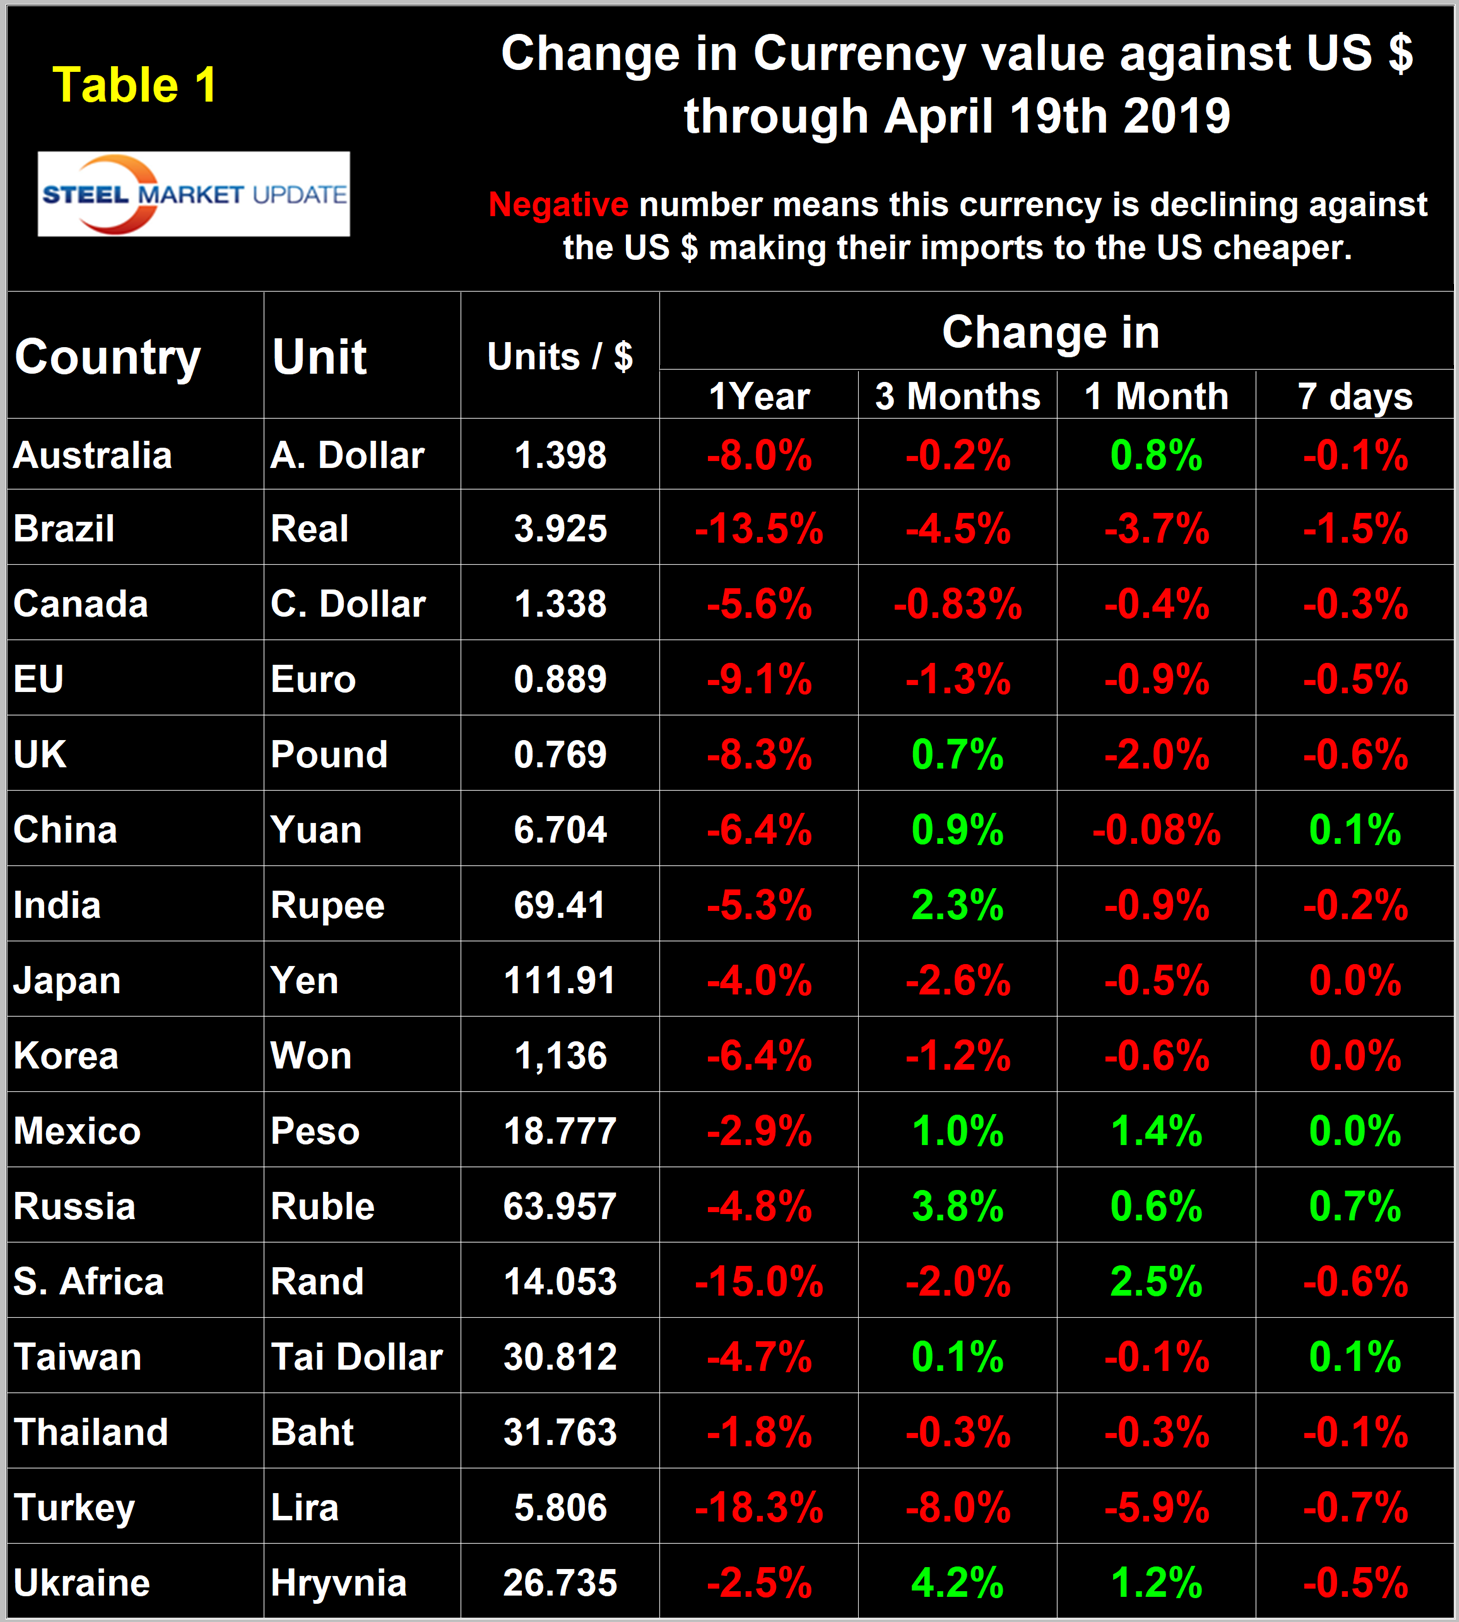
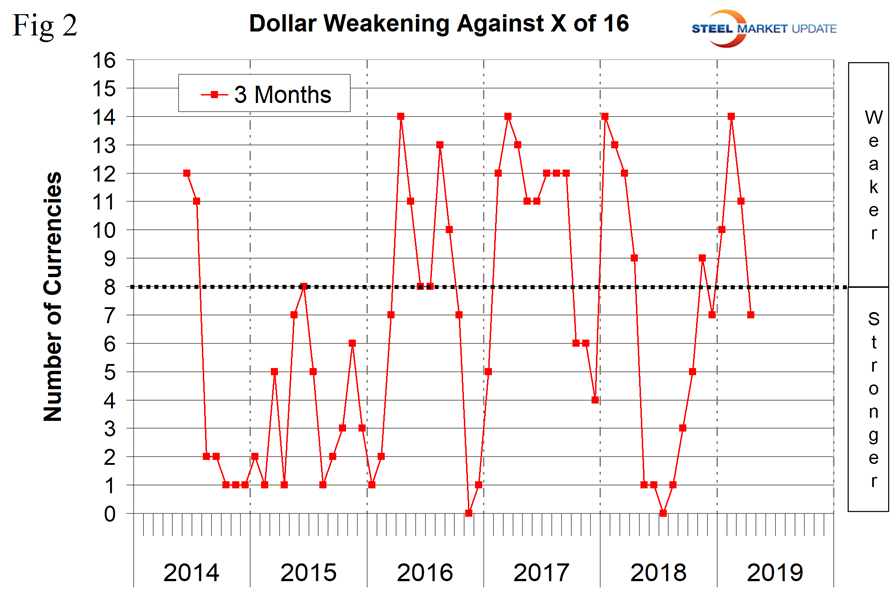
Figure 2 gives a longer-range perspective and shows the extreme gyrations that have occurred in the last three years at the three-month level.
A falling dollar puts upward pressure on commodity prices that are greenback denominated. We regard strengthening of the U.S. dollar as negative and weakening as positive because of the effect on the trade balance of all commodities and on the total national trade deficit.
In each of these reports, we describe the history of several of the 16 steel and iron ore trading currencies listed in Table 1 and over a period of several months will give details on all of them. Charts for each of the 16 currencies are available through April 22 for any premium subscriber who requests them.
The Australian Dollar
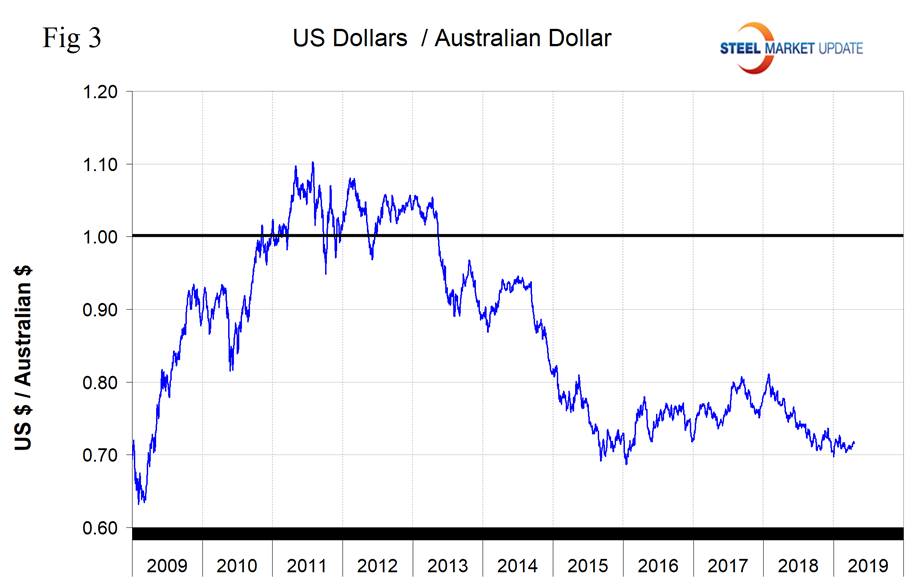
On April 19, it required 1.4 Australian dollars to buy one U.S. dollar. The Aussie has lost 8.0 percent in the last year, but has gained back 0.8 percent in the last month (Figure 3).
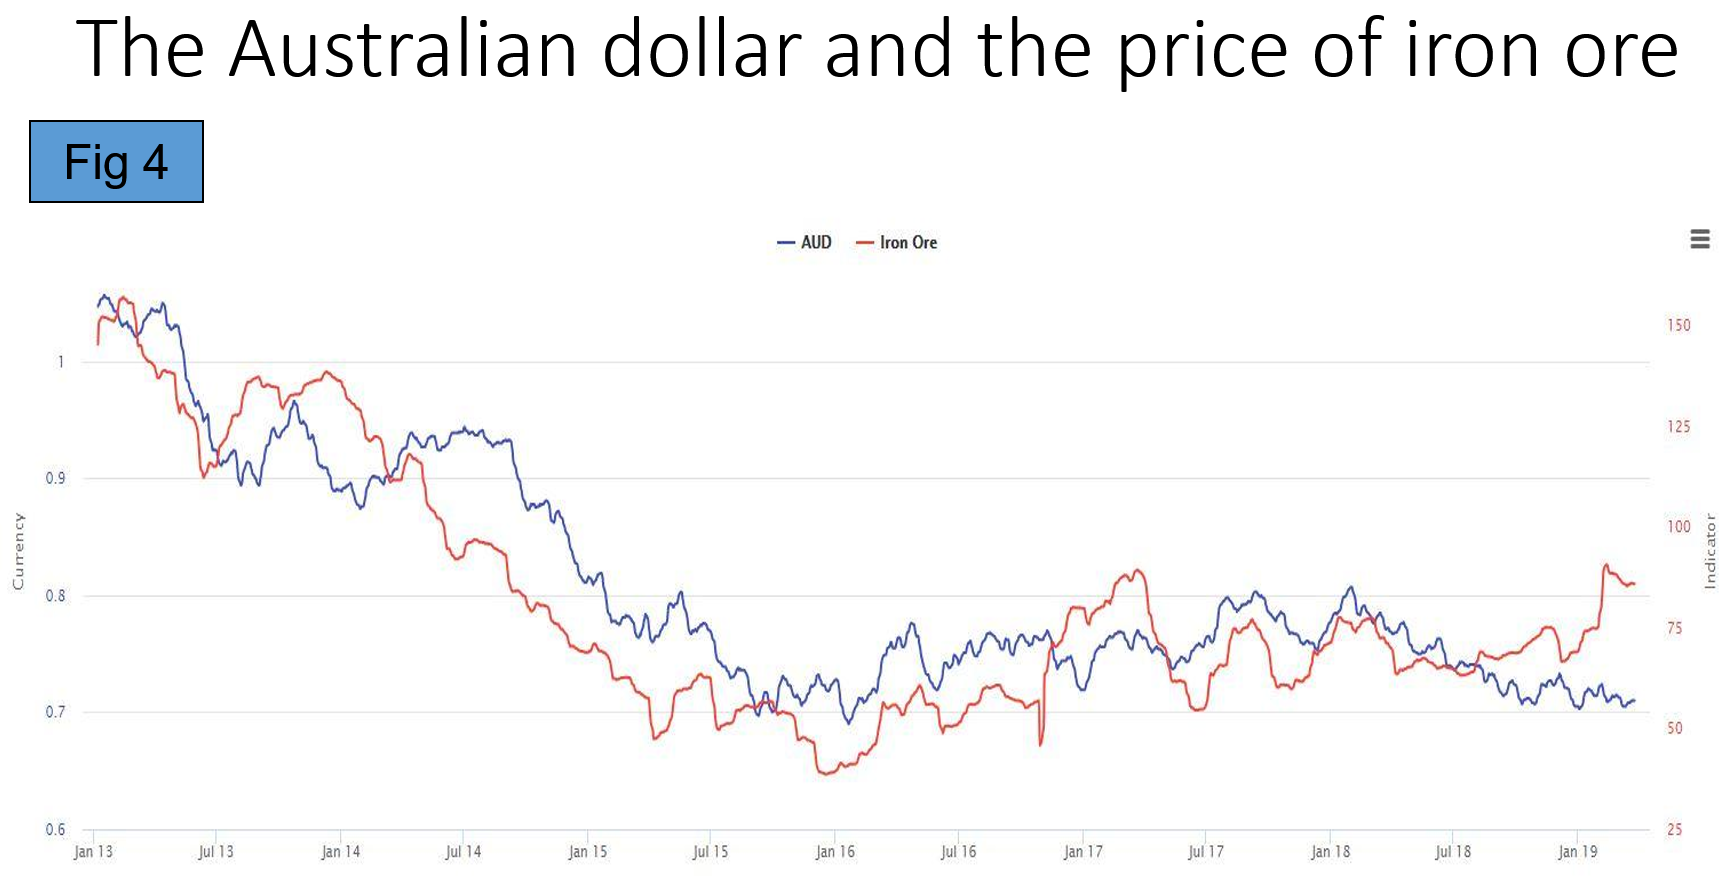
On April 27, Splendid Exchange, a currency analyst, wrote: “The long-term chart of the Australian dollar suggests that significant declines from current levels are unlikely. Since 2004, the only time the Aussie stayed below US70¢ for any length of time was in the depths of the global financial crisis. Dips below US70¢ since then are shallow and short in time span. The most recent drop below US70¢, early this year, lasted just 36 hours. It was the strength in the commodities that eventually pulled the Australian dollar higher. And indeed, we are already seeing a bullish divergence between the AUD/USD exchange rate and the price of iron ore.” Figure 4 was extracted from the Splendid Exchange article. It’s difficult to read, but the red line represents the price of iron ore.
The Euro
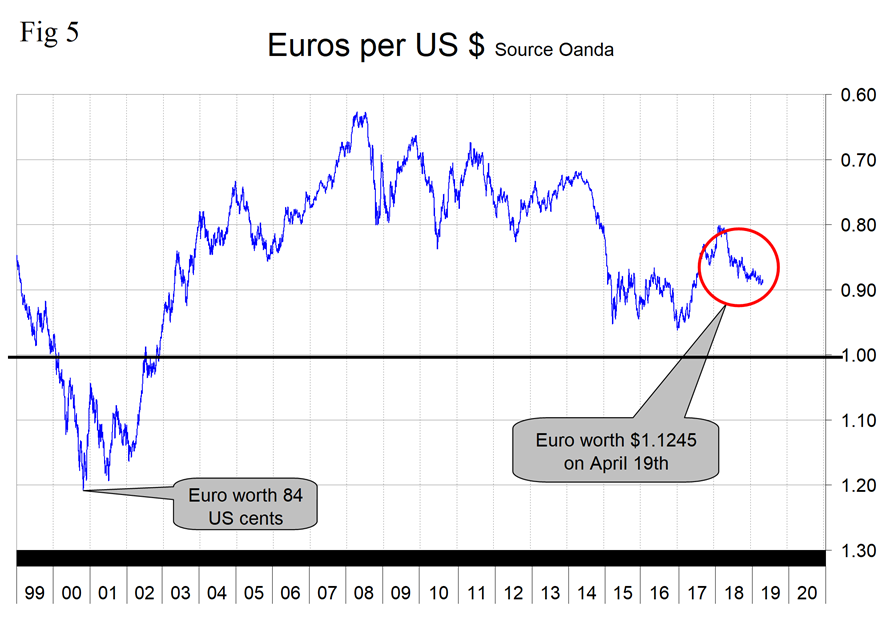
On April 19, it required 1.1245 U.S. dollars to buy one euro. The euro has declined against the dollar in all four time frames in Table 1. By 0.9 percent in one month and by 1.3 percent in three months (Figure 5).
The Indian Rupee
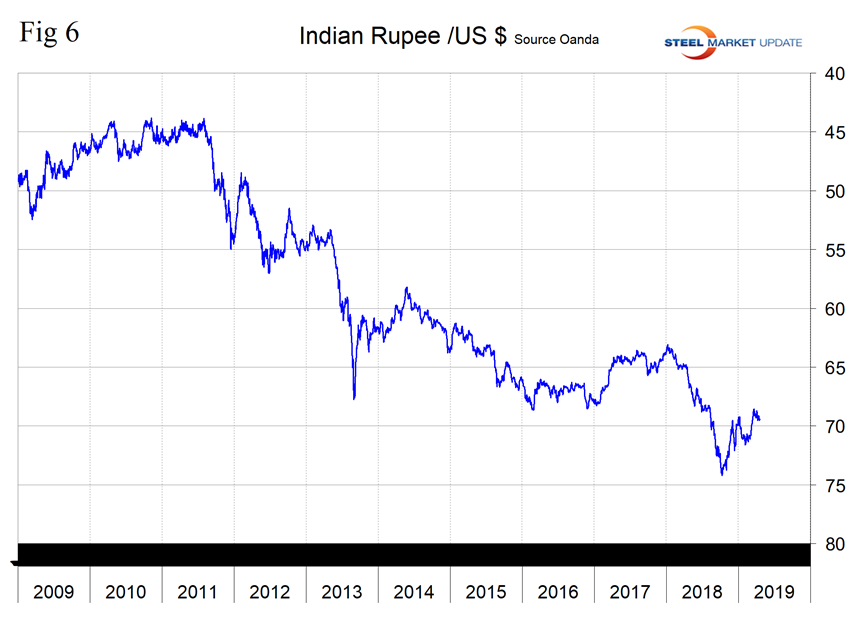
On April 19, it required 69.4 rupees to purchase one U.S. dollar. The rupee strengthened by 2.3 percent in the last three months, but gave back 0.9 percent in one month (Figure 6).
The Turkish Lira
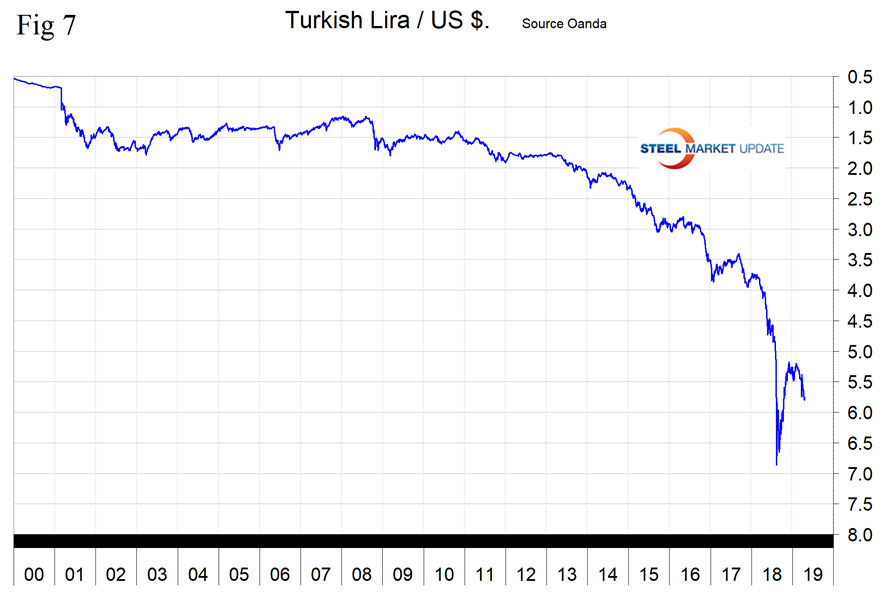
On April 19, it required 5.8 liras to buy one U.S. dollar. The lira has declined by 5.9 percent in one month and by 8.0 percent in three months (Figure 7). On April 15, currency analyst Max Loh wrote: “Turkey’s rotten fundamentals have not improved one bit since last year’s massive sell-off in the lira, which threatened the viability of the Turkish economy as a whole. The lira has been steadily weakening since the start of the year, and Erdogan has been at his autocratic best in trying to stem weakness in the lira again. Watch Turkey closely, as I believe last year’s saga is about the repeat itself. Turkey remains trapped in an unenviable position. How can the central bank continue to raise interest rates to fight off inflation (close to 20% year-on-year) if that would directly raise borrowing costs for businesses to refinance their steep levels of debt? If interest rates are not raised to an attractive enough level above inflation, why would foreign investors choose to invest in Turkey and lend to Turkish businesses? Already in April, there were signs that Erdogan’s government has been acting to stem lira weakness, and I am certain that the lira continues to live on borrowed time.”
Explanation of Data Sources: The Broad Index is published by the Federal Reserve on both a daily and monthly basis. It is a weighted average of the foreign exchange values of the U.S. dollar against the currencies of a large group of major U.S. trading partners. The index weights, which change over time, are derived from U.S. export shares and from U.S. and foreign import shares. The data are noon buying rates in New York for cable transfers payable in the listed currencies. At SMU, we use the historical exchange rates published in the Oanda Forex trading platform to track the currency value of the U.S. dollar against that of 16 steel and iron ore trading nations. Oanda operates within the guidelines of six major regulatory authorities around the world and provides access to over 70 currency pairs. Approximately $4 trillion U.S. dollars are traded every day on foreign exchange markets.


