Market Data

April 9, 2019
Global Scrap Market: U.S. Continues to Increase Share
Written by Peter Wright
Steel Market Update is pleased to share this Premium content with Executive-level members. For more information on how to upgrade to a Premium-level subscription, email info@SteelMarketUpdate.com.
This is a quarterly analysis that SMU performs using data from the Iron and Steel Statistics Bureau in the UK. We believe that to improve our understanding of the gyrations of the domestic scrap market we should be aware of where the U.S. stands as a global player. Some nations are slow to report, which results in our analysis being a quarter in arrears, but we believe it gives a valuable perspective of global trends and is the foundation of where we are today. All tonnages in this report are metric.
In this analysis of global scrap trade, we have excluded movements within the EU from the global total. Figures 1 and 2 show the total tonnage of global trade since Q1 2000 and the volume of the top five suppliers. These five are the U.S., the EU, the UK, Japan and Russia and they accounted for over two-thirds of the total in Q4 2018. Figure 2 is the same as Figure 1 with the total removed. Total global trade in ferrous scrap has been increasing since Q1 2016 and the U.S. export tonnage has increased disproportionally in the same time frame.
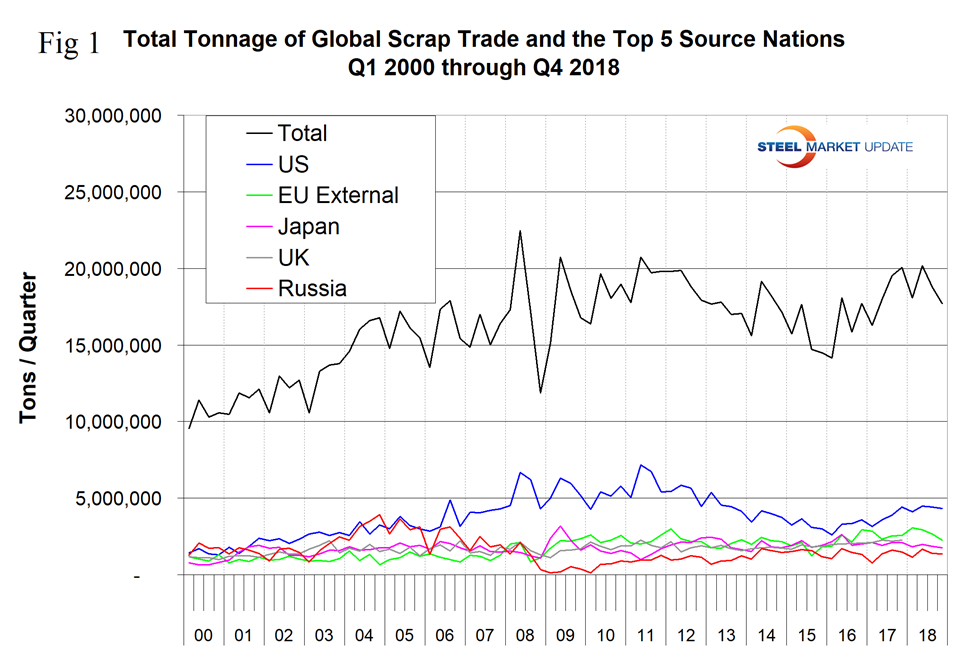
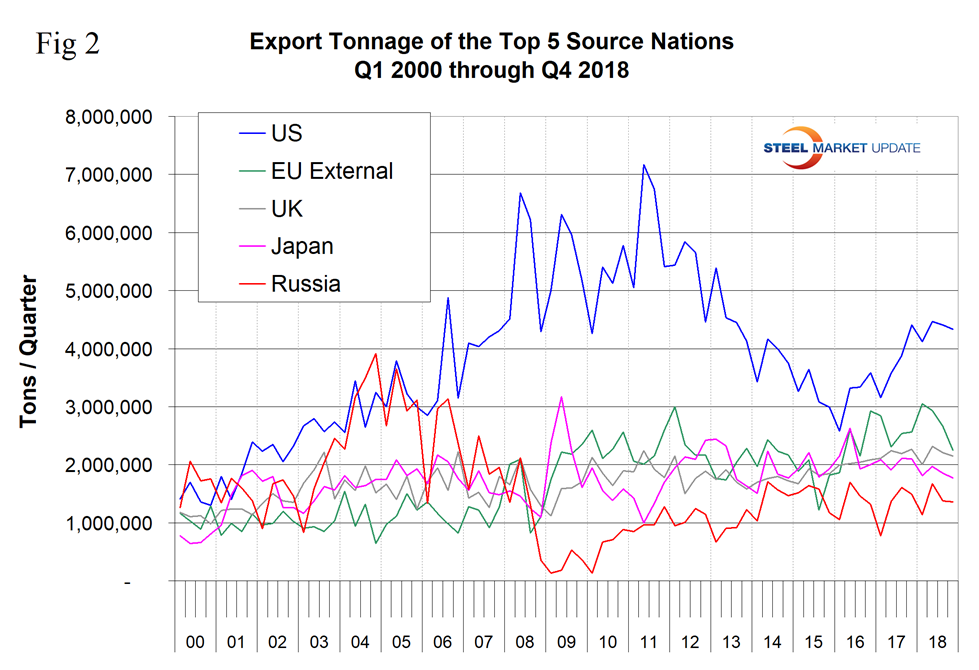
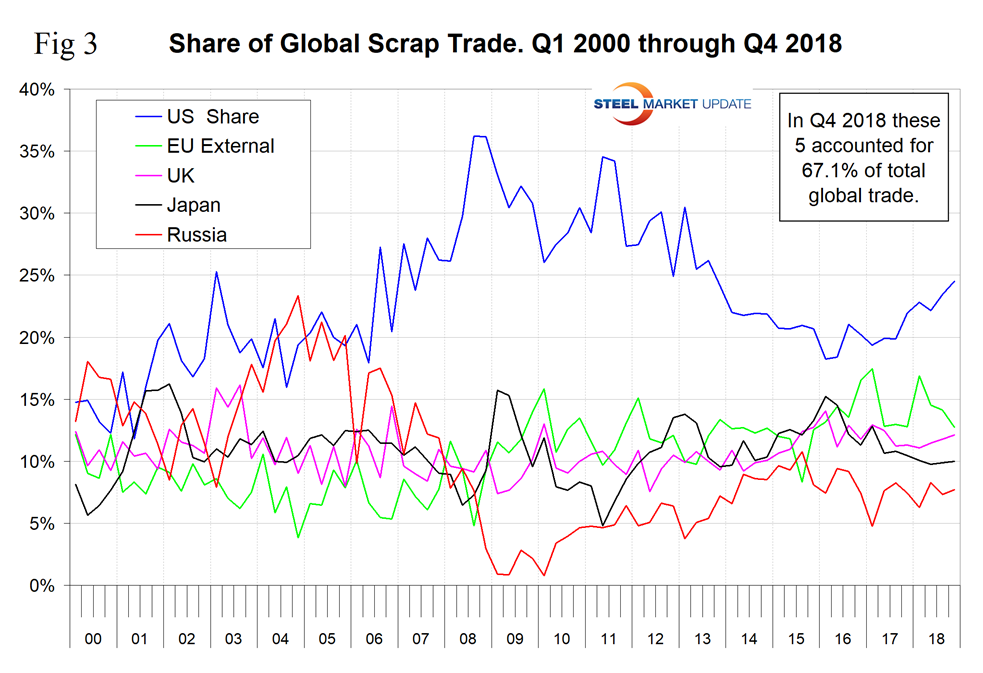
Figure 3 shows the global market share of the top five exporters. After declining for seven years from 2008 through 2015, the U.S. share increased in the three years 2016 through 2018. The U.S. has been the highest volume exporter every quarter since Q4 2005.
There seem to be two big mysteries in the global scrap trade data. Figure 4 shows the correlation of 77.2 percent since 2010 between the U.S. share of global scrap trade and the domestic scrap price. This makes sense and tells us that export demand is the major driver of the domestic scrap price. Figure 5 shows a negative correlation of 76.1 percent between the Broad Index value of the U.S. dollar and the U.S. share of global trade. This is a causal relationship; when the dollar strengthens, U.S. scrap on the global market becomes more expensive and the U.S. share declines. Makes perfect sense. What makes no sense and in the first mystery is why this relationship has broken down in the last two years, particularly in 2018. We at SMU don’t have the street cred of many of our subscribers, therefore would appreciate external input.
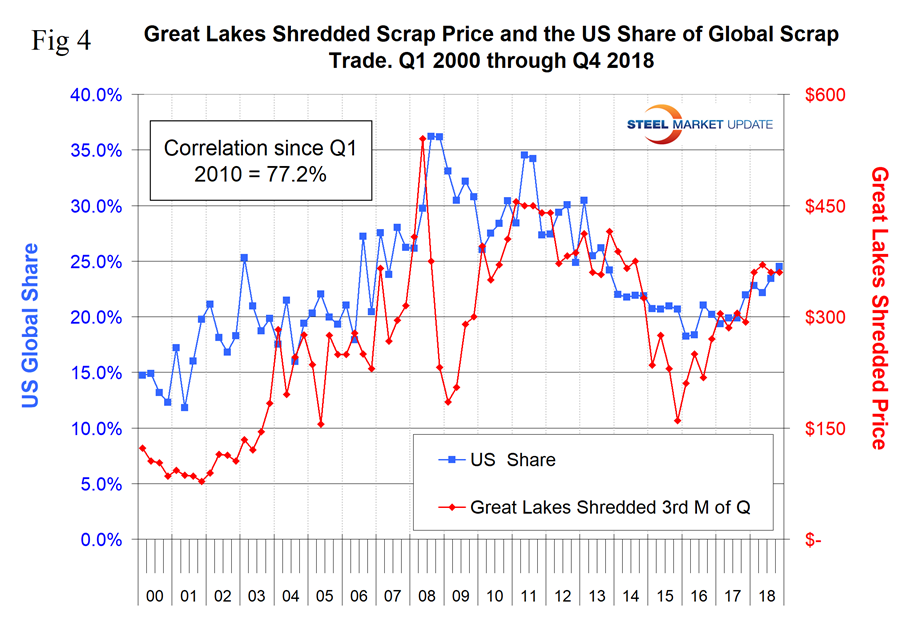
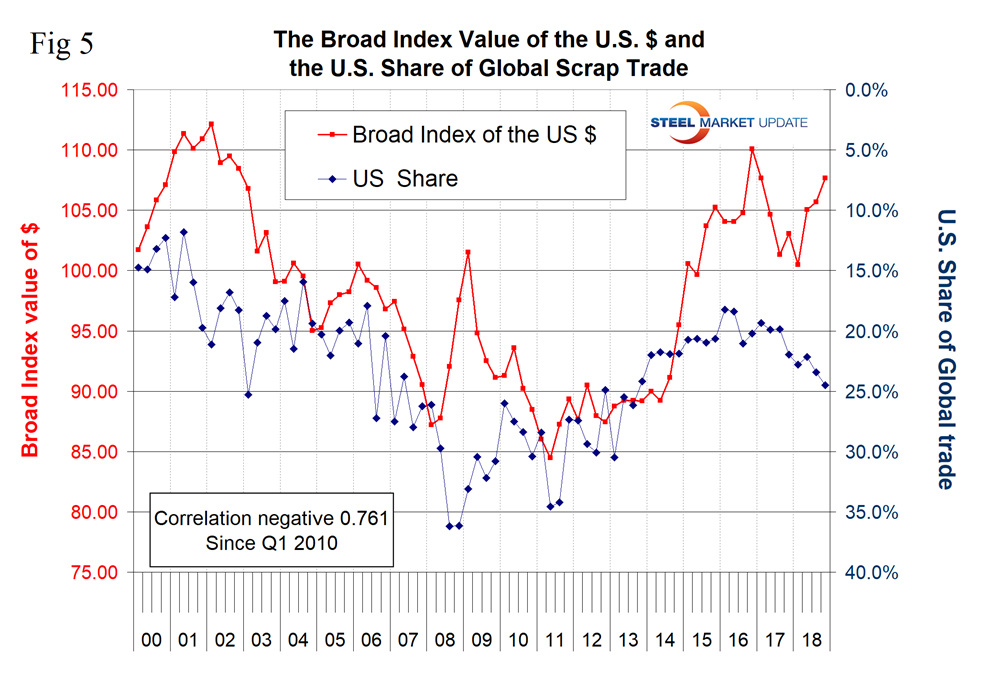
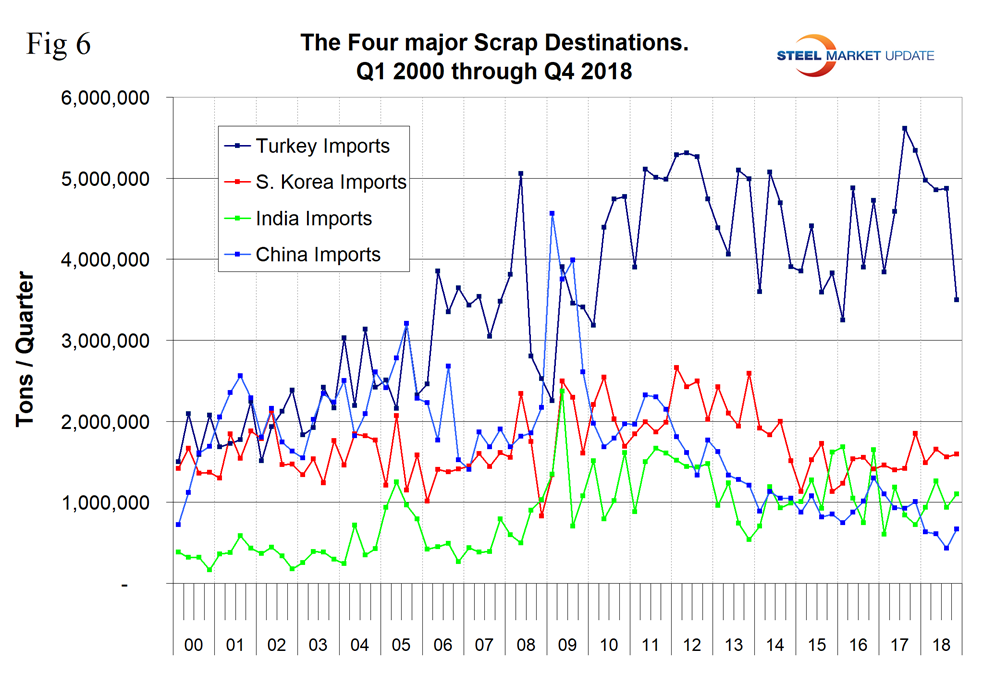
Figure 6 shows the tonnage received by the four major importing nations. Turkey is by far the largest global scrap buyer, but imports into Turkey declined acutely in Q4 2018 and their share of global trade at 19.8 percent was the lowest since Q3 2009. Even so, Turkey imported more than the other three combined in Q4 2018.
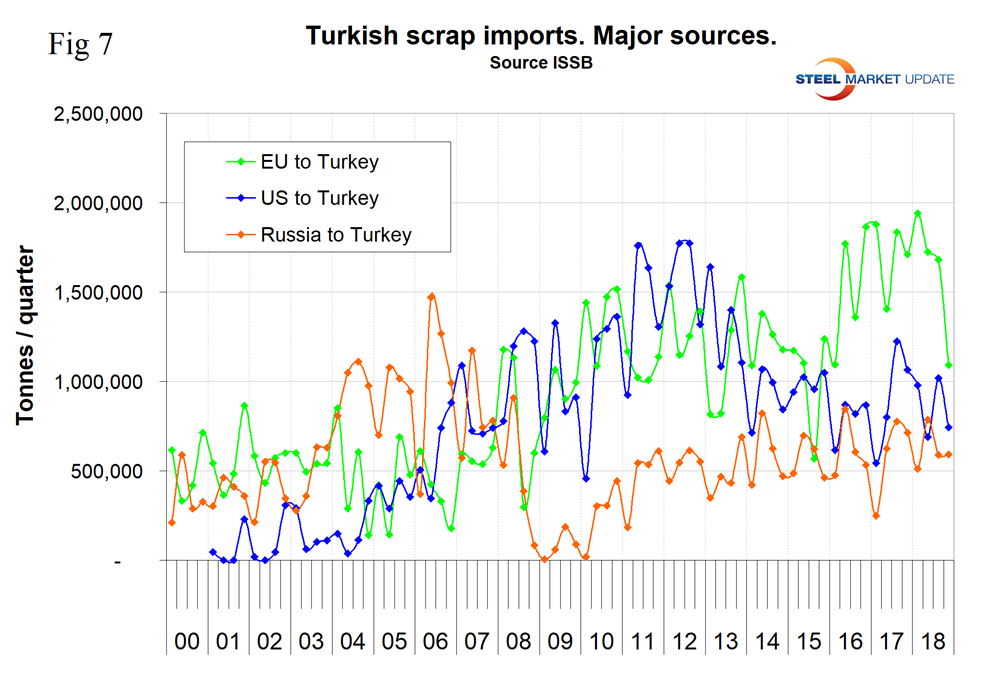
Turkey’s import tonnage has declined by 38 percent since the all-time high of Q3 2017 with the biggest decline in Q4 2018. Almost all of the decline has been at the expense of the EU (Figure 7).
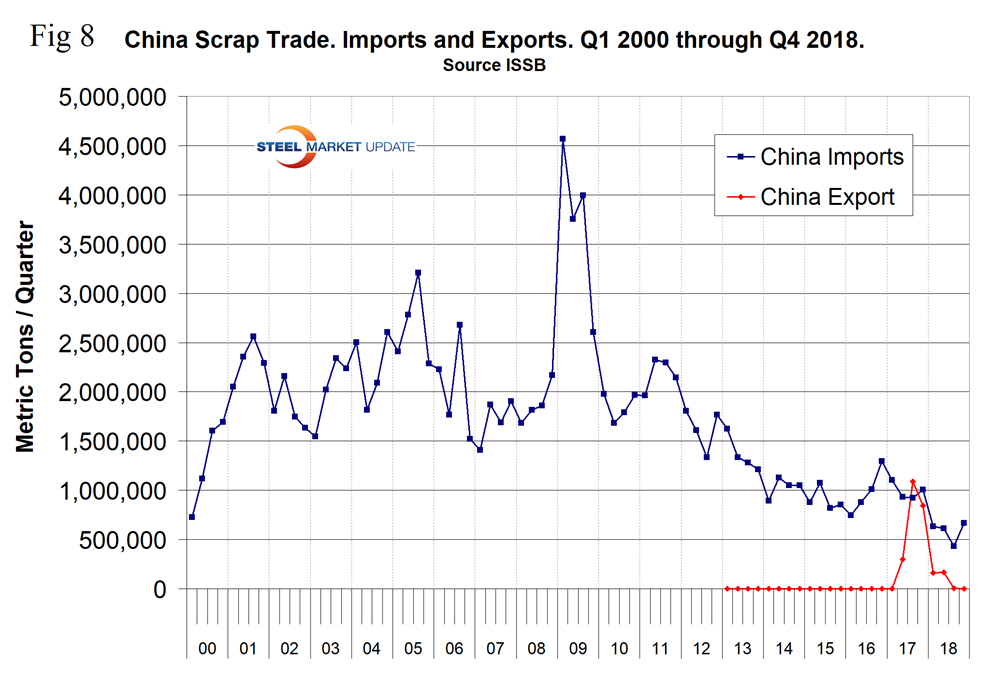
The second mystery is what is going on in China. In the third quarter of 2017, China became a net scrap exporter, according to data published by their trade administration (Figure 8). In our global scrap trade analysis for Q3 2017 we stated: “By the end of this decade we expect a huge disruption of the global scrap market as China’s scrap collection industry catches up with the rate of scrap generation. About 93 percent of China’s steel is currently manufactured in basic oxygen furnaces, therefore until they evolve an appropriate mix of BOF/EAF capacity, scrap will be exported in huge volumes. This is not happening, and in the second half of 2018 Chinese scrap exports were reported as zero. We understand from one of our subscribers who has feet on the ground in China that a few months ago almost all scrap exporters were fined or jailed for evading taxes on the value of the material. There was no sign of this industry coming back to life through Q4 2018, but our belief that disruption of the global scrap market is inevitable still stands. The only question is when.”
SMU Comment: According to the OECD Steel Committee report on global steel capacity and investments published in September, almost all the new capacity under construction or starting up in China is based on the BOF process. If so, the situation of scrap generation and scrap consumption must be becoming untenable. We still believe that sooner rather than later this volume must appear in the global market with negative consequences for scrap prices worldwide.


