

Market Data

March 29, 2019
SMU Energy Analysis: Rig Count's Down
Written by Peter Wright
The spot price of West Texas Intermediate FOB Cushing, Okla., had a recent peak on Oct. 3 of $76.40/barrel. The price declined to $44.48 on Dec. 27, but recovered to $59.09 on March 15. The total number of operating rigs exploring for oil has declined by 61 since Jan. 4.
The prices of oil and natural gas drive the consumption of energy-related steel products including oil country tubular goods, pipe fittings and well head equipment, among others. Welded tubular goods (not including OCTG) consumed about 5.5 million tons of hot rolled sheet in 2018.
Figure 1 shows historical oil and gas prices from January 2000 through March 15, 2019. Our price and inventory data come from the EIA (Energy Information Administration). On March 15, the WTI priced in Cushing, Okla., was $59.09/barrel and on the same date natural gas at the Henry Hub in Oklahoma was priced at $2.859/MMBtu.
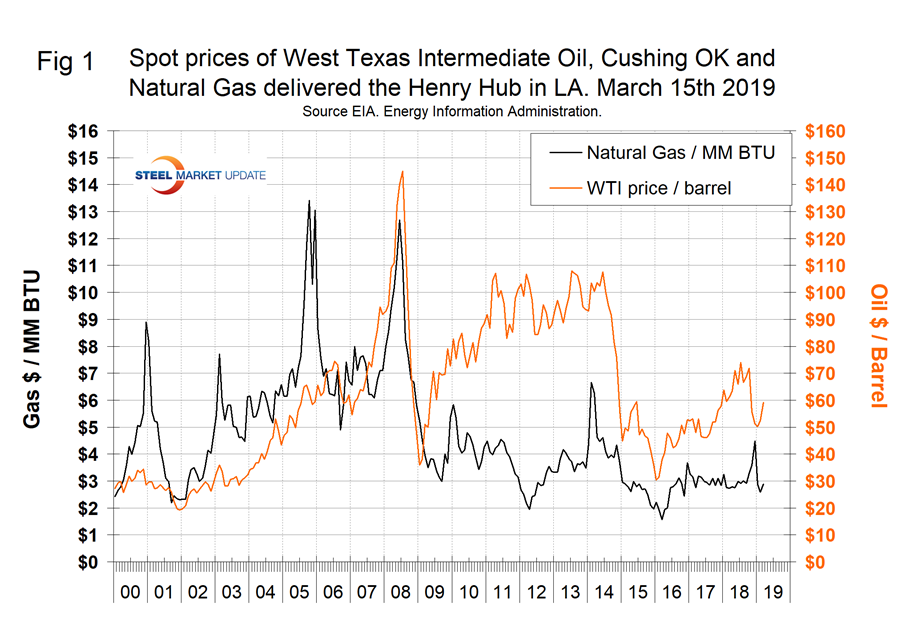
In its latest short-term outlook on March 12, the EIA forecasts Brent crude oil spot prices will average $63/b in 2019 and $62/b in 2020, compared with an average of $71/b in 2018. EIA expects that West Texas Intermediate (WTI) crude oil prices will average $9/b lower than Brent prices in the first half of 2019 before the discount gradually falls to $4/b in the fourth quarter of 2019 and throughout 2020. EIA expects strong growth in U.S. natural gas production to put downward pressure on prices in 2019. EIA expects Henry Hub natural gas spot prices will average $2.85/MMBtu in 2019, down 30 cents/MMBtu from 2018. NYMEX futures and options contract values for June 2019 delivery traded during the five-day period ending March 7, 2019, suggest a range of $2.40/MMBtu to $3.51/MMBtu, which encompasses the market expectation for June 2019 Henry Hub natural gas prices at the 95 percent confidence level.
On March 15, the EIA reported that U.S. commercial crude oil inventories (excluding those in the Strategic Petroleum Reserve) declined by 9.6 million barrels from the previous week, but were up by 11.2 million barrels year over year. Figure 2 shows the inventory level, including the strategic petroleum reserve and the year-over-year change.
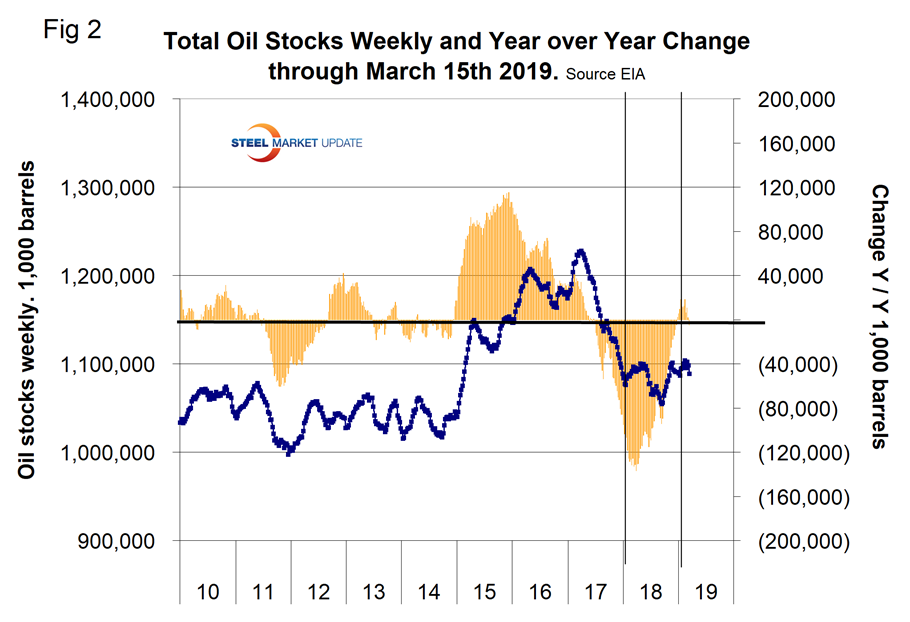
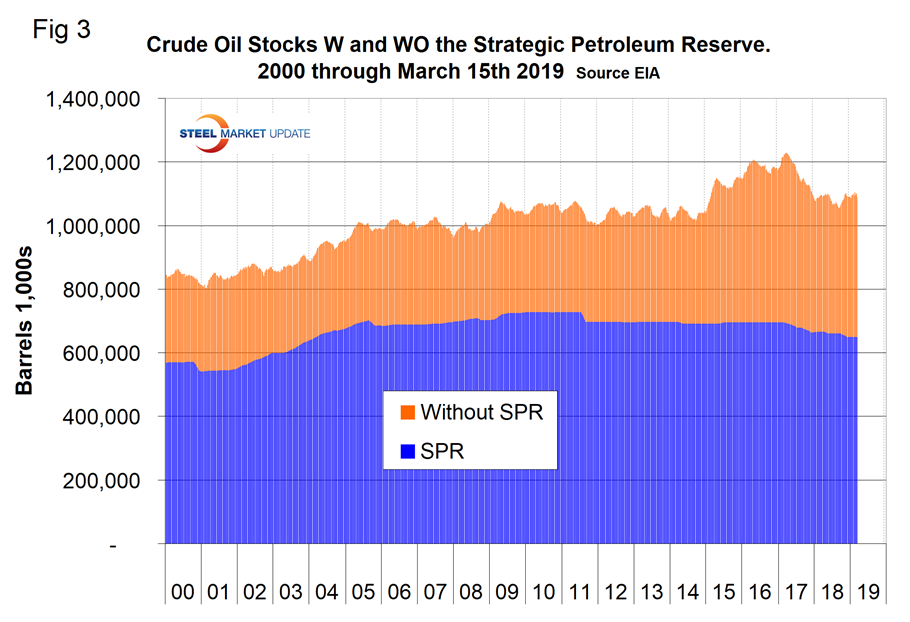
Figure 3 breaks total crude inventory into the working portion and the strategic petroleum reserve.
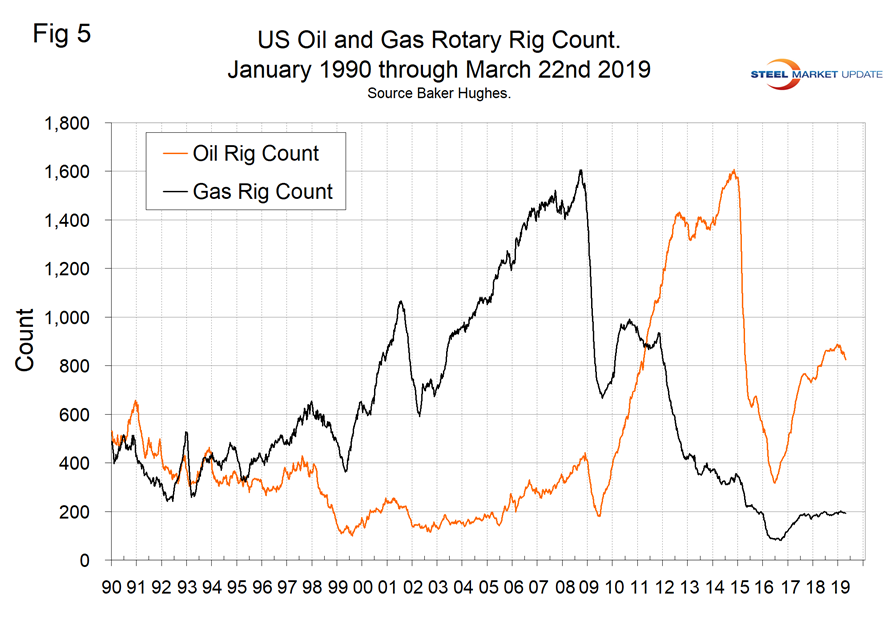
The total number of operating rigs in the U.S. on March 22 was 1,016, which was down by 61 since Jan. 4. Oil rigs were down by 53 and gas by 8. Figure 4 shows the total number of operating rigs in the U.S. and the weekly change.
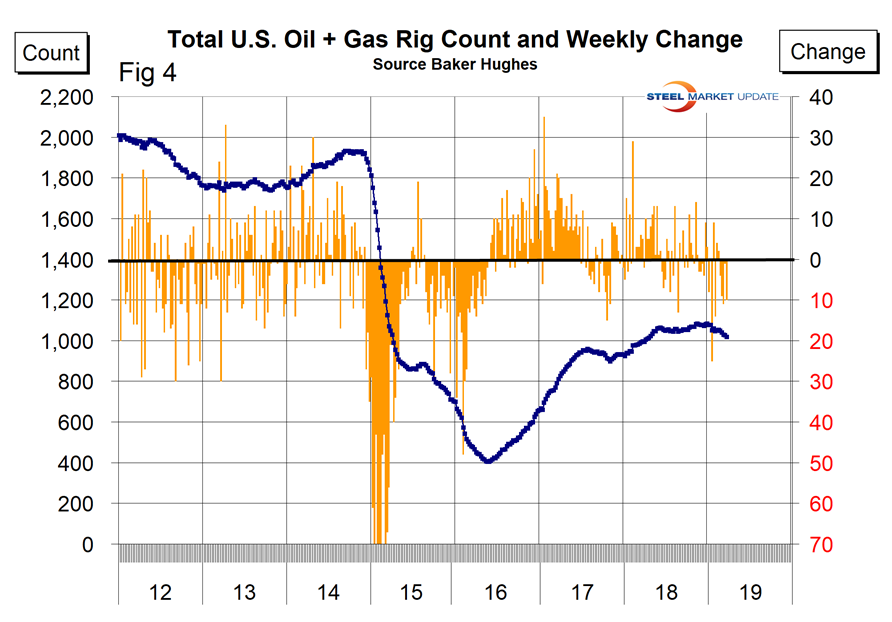
The oil rig count had a low point of 316 on June 27, 2016, and stood at 824 on March 15, 2019. The count has increased by 82 since Jan. 5 last year.
The U.S. gas rig count rose from its low point of 81 on Aug. 5, 2016, to 192 on March 15. The year-over-year growth rate of total U.S. operating rigs was 2.1 percent in the latest data with oil up by 2.5 percent and gas up by 1.1 percent. Figure 5 shows the Baker Hughes U.S. Rotary Rig Counts for oil and gas equipment in the U.S. (explanation below).
On a regional basis in the U.S., the big three states for operating rigs are Texas, Oklahoma and North Dakota. Figure 6 shows the land rig count in those states since 2000.
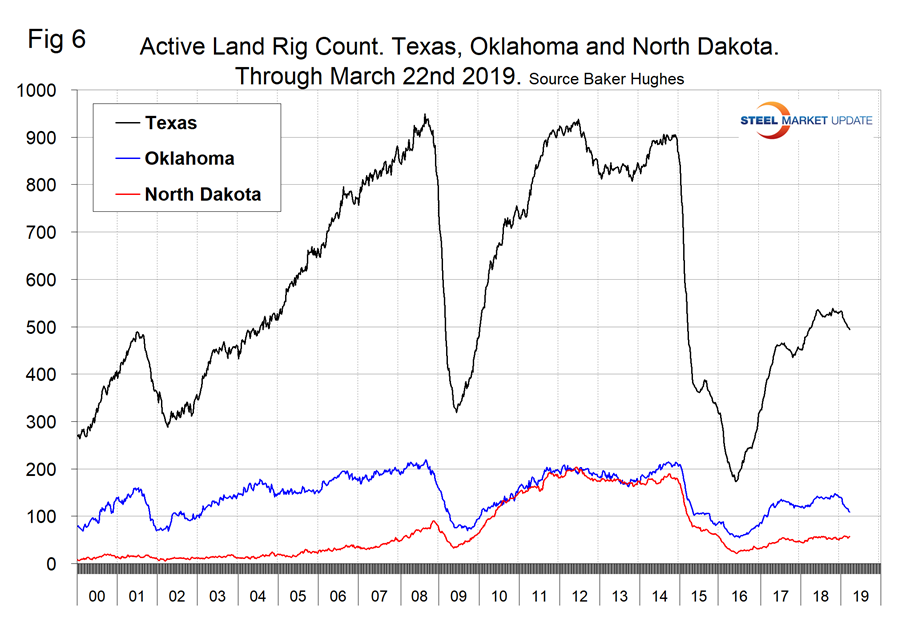
Figure 7 illustrates the monthly U.S. oilfield production of crude from January 1970 through December 2018 (latest data available) in thousands of barrels per month. The historical high was October 1970 at 310.4 million barrels. Production steadily declined to half that level in the late 2000s before the fracking revolution. December 2017 broke the record that had stood for 47 years with 310.7 million barrels produced and December 2018 set a new record at 367.3 million barrels. EIA estimates that U.S. crude oil production averaged 11.9 million barrels per day (b/d) in February, down slightly from the January average. EIA forecasts that U.S. crude oil production will average 12.3 million b/d in 2019 and 13.0 million b/d in 2020, with most of the growth coming from the Permian region of Texas and New Mexico.
Net imports of U.S. crude oil and petroleum products fell from an average of 3.8 million b/d in 2017 to an average of 2.3 million b/d in 2018. EIA forecasts that net imports will continue to fall to an average of 1.0 million b/d in 2019 and to an average net export level of 0.1 million b/d in 2020. In the fourth quarter of 2020, EIA forecasts that the United States will be a net exporter of crude oil and petroleum products by about 0.9 million b/d.
On March 8, value analyst Daniel Jones wrote: “When it comes to production in the Permian Basin, Exxon Mobil Corporation wants its investors to know that it means business. The company, in a recent press release, announced plans to significantly ramp up its exposure to the Permian basin in an attempt to grow output by leaps and bounds over the next several years. This move, while a long-term one in nature, should illustrate for investors just how important the Permian is, not just for America’s energy production and consumption, but for Exxon Mobil itself. And if management is correct in its assumptions, the ultimate impact for shareholders, so long as energy prices remain elevated, should be remarkably positive.”
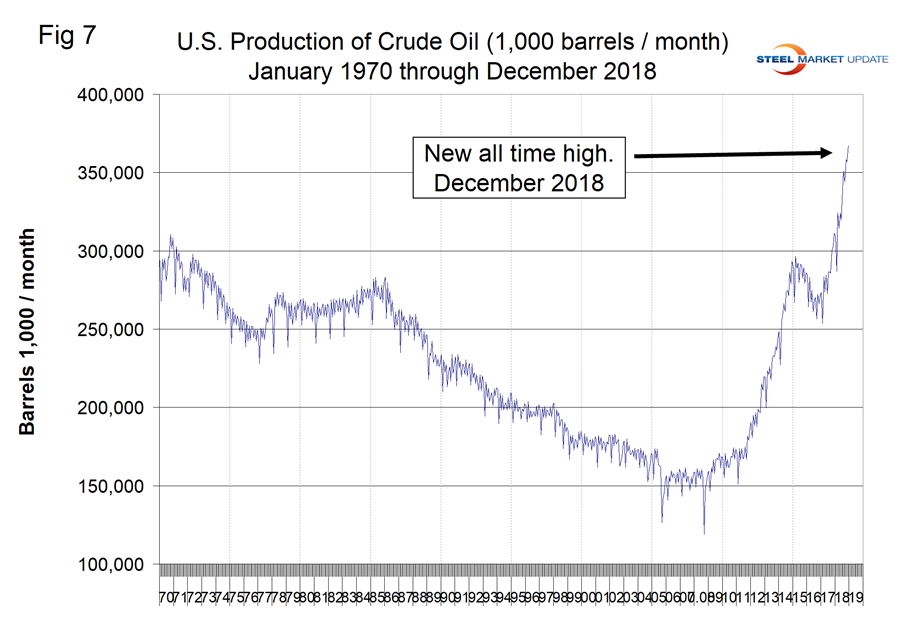
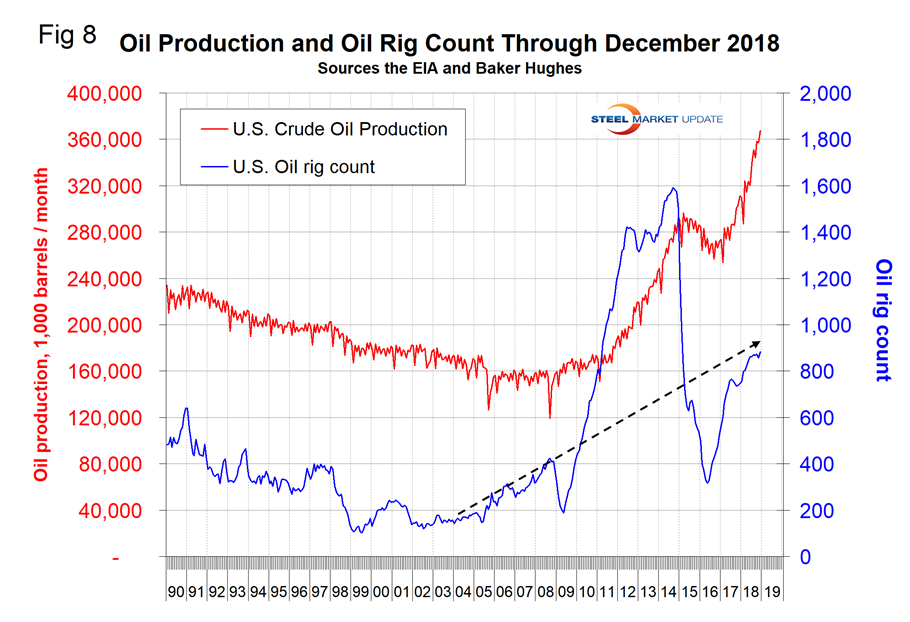
Figure 8 compares oil production and the oil rig count and shows how the increase in exploratory wells drove production from 2009 through late 2014 when the oil price collapsed. The subsequent decline in production was much less marked and is again setting new records. Our take on this is that the huge increase in exploratory oil rigs beginning in 2009 may have been an anomaly and that we won’t see a repeat of the number operating in 2014 for a very long time.
Baker Hughes Rotary Rig Count: This is a weekly census of the number of drilling rigs actively exploring for or developing oil or natural gas in the United States. Rigs are considered active from the time they break ground until the time they reach their target depth and may be establishing a new well or sidetracking an existing one. The Baker Hughes Rotary Rig count includes only those rigs that are significant consumers of oilfield services and supplies.


