Prices

March 7, 2019
HRC Futures: Flattening?
Written by Gaurav Chhibbar
Gaurav Chhibbar is a partner at Metal Edge Partners, a firm engaged in Risk Management and Strategic Advisory. In this role, he and his firm design and execute risk management strategies for clients along with providing process and analytical support. In Gaurav’s previous role, he was a trader at Cargill spending time in Metal and Freight markets in Singapore before moving to the U.S. You can learn more about Metal Edge a www.metaledgepartners.com. Gaurav can be reached at gaurav@metaledgepartners.com for queries/comments/questions.
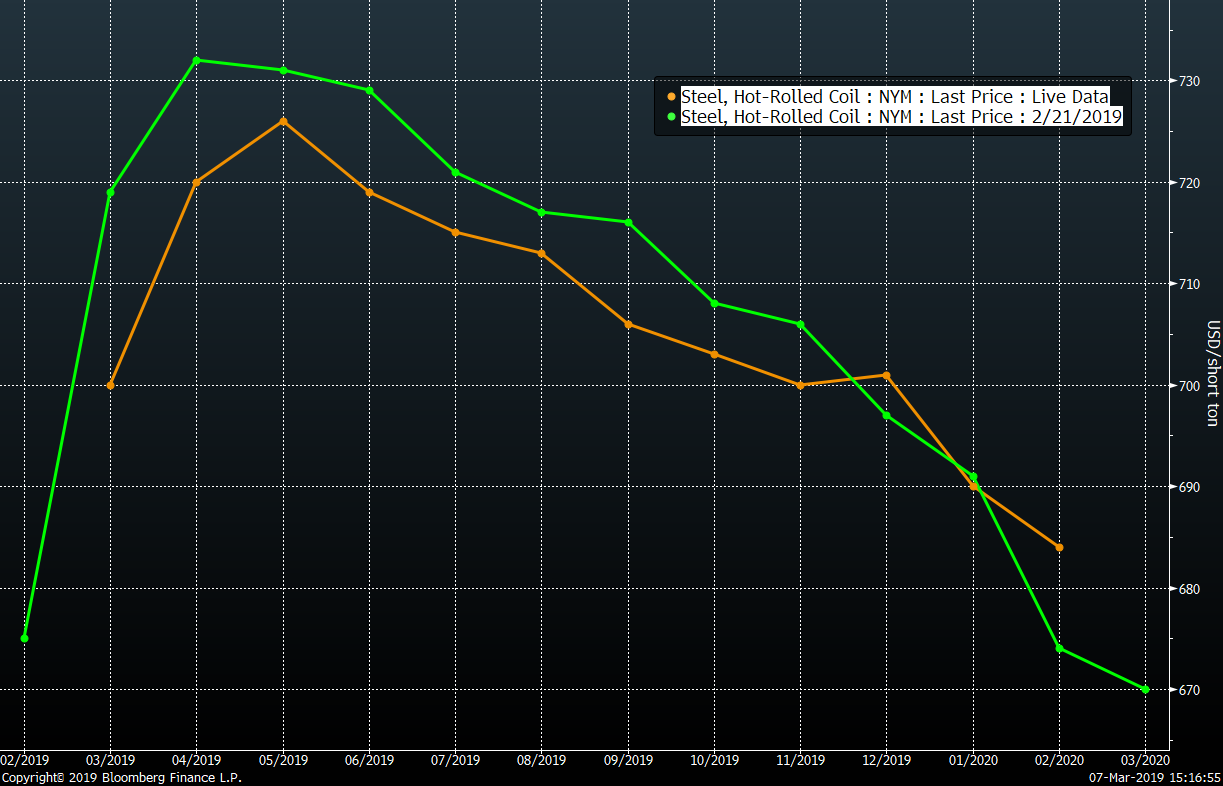
“Don’t you think a donnybrook would have erupted if someone had suggested just a few weeks ago that we will see the HRC curve flatten before the end of the first quarter,” said a friend of mine who is also in the industry. I couldn’t agree more. The green line below shows the curve from two weeks ago versus the orange line (Chart 1) that shows the curve from today (3:00 p.m. CST).
What my friend was referring to is the resilience of the back end of the curve despite the nearby months coming off. Wednesday trading saw the curve move sharply lower in the front months as many felt the benchmark steel price index missed expectations.
Chart 1: HRC Forward Curve

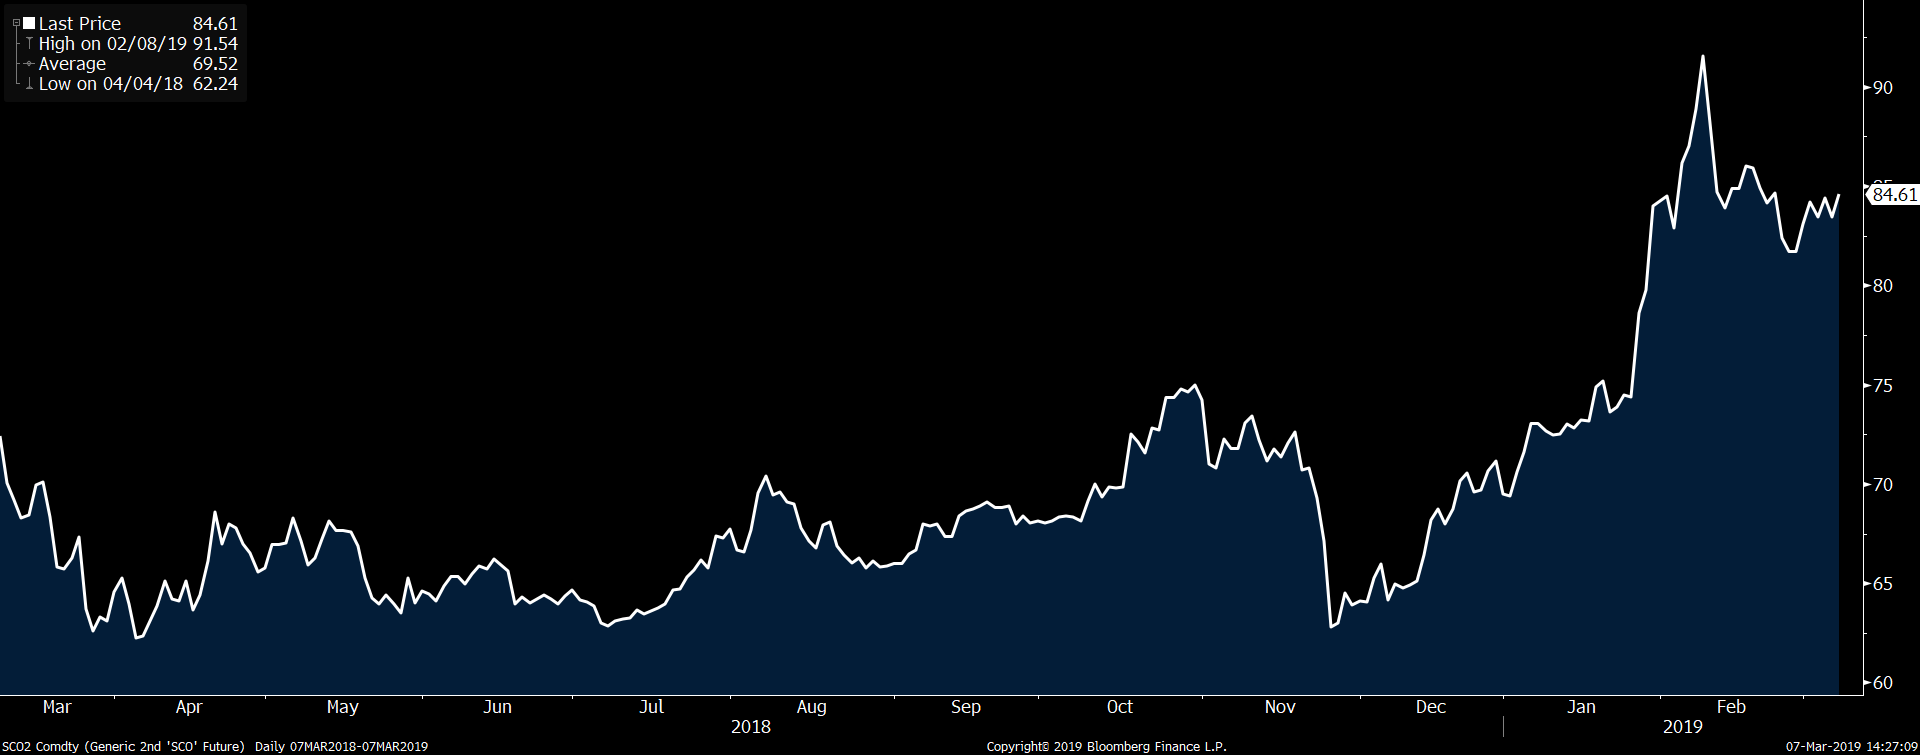
As traders digested the print and assessed the broader market sentiment, the macro data points further caused some to be worried about the direction of steel prices. Internationally, iron ore prices (Chart 2) held their level despite China lowering its growth target and the European Central Bank indicating a need to continue to stimulate the economy. It is evident that supply disruptions that were kickstarted by the Vale dam collapse have pushed ore higher.
Chart 2: Iron Ore 2nd Month

This brings me back to the discussion on the back end of the curve not moving lower (for now?!). With U.S. mills having announced two price increases, there is an explanation for a carry in the front months of the HRC curve, but I found the following two arguments interesting from the point of explaining why we don’t see a steeper backwardation or decline in prices.
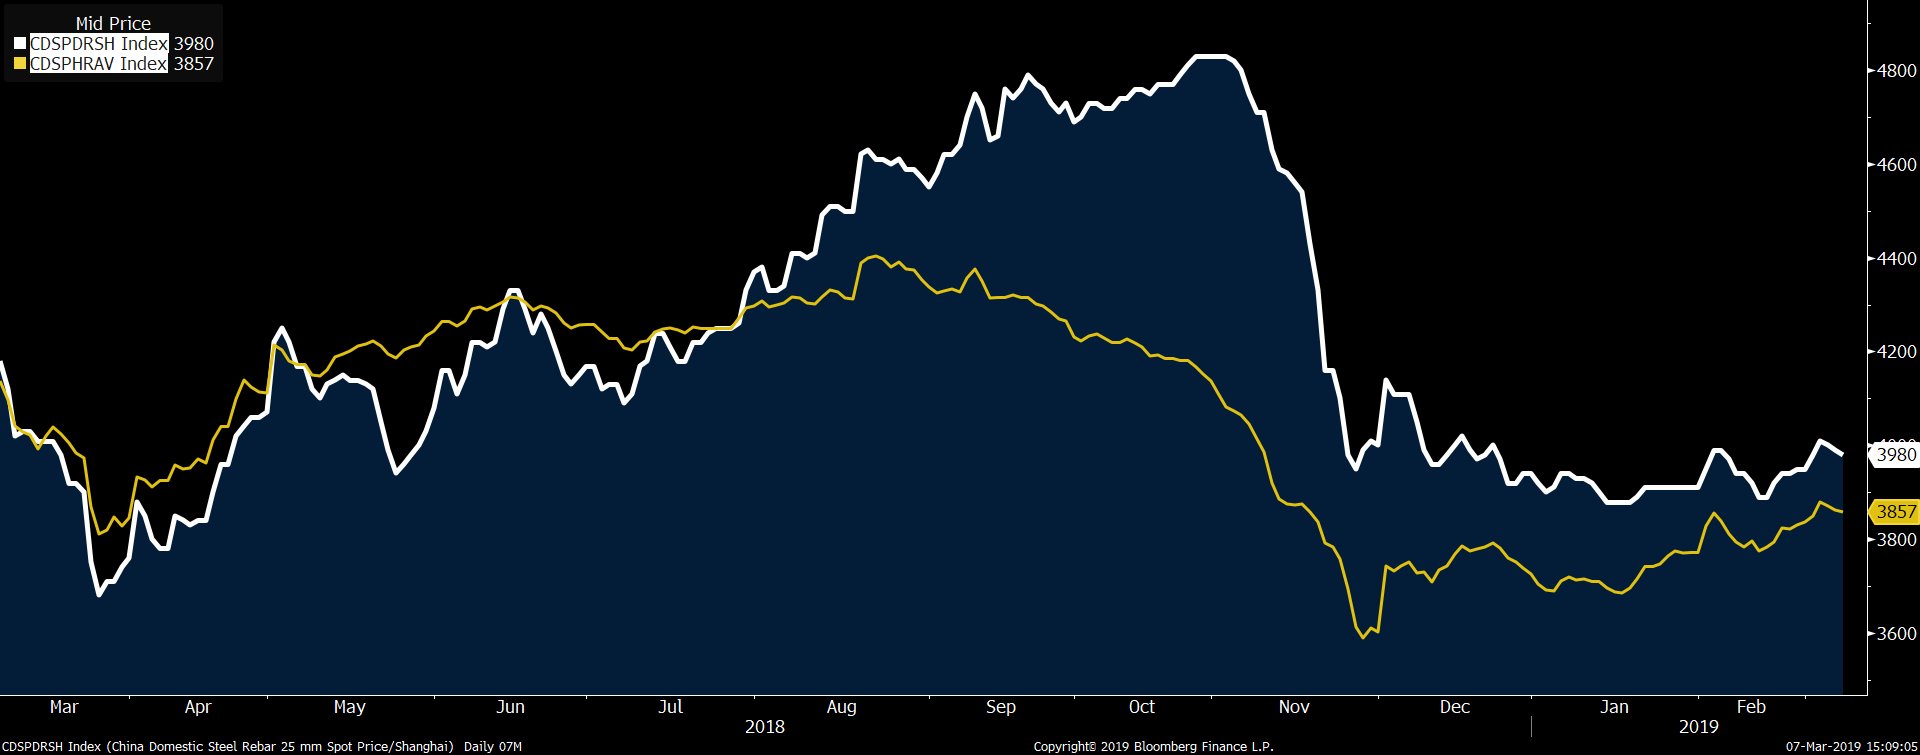
First, with iron ore prices sticking at higher levels there are market players who expect that Chinese steel prices will finally reflect efforts of the Chinese government to stimulate demand. This, they reckon, will lift global steel prices. As the chart below highlights (Chart 3), the mill margins have been under squeeze and with recent production cuts (pollution driven!) steel pricing is likely to find positive drivers.
Chart 3: China Rebar Spot (White) China HRC Spot (Yellow)

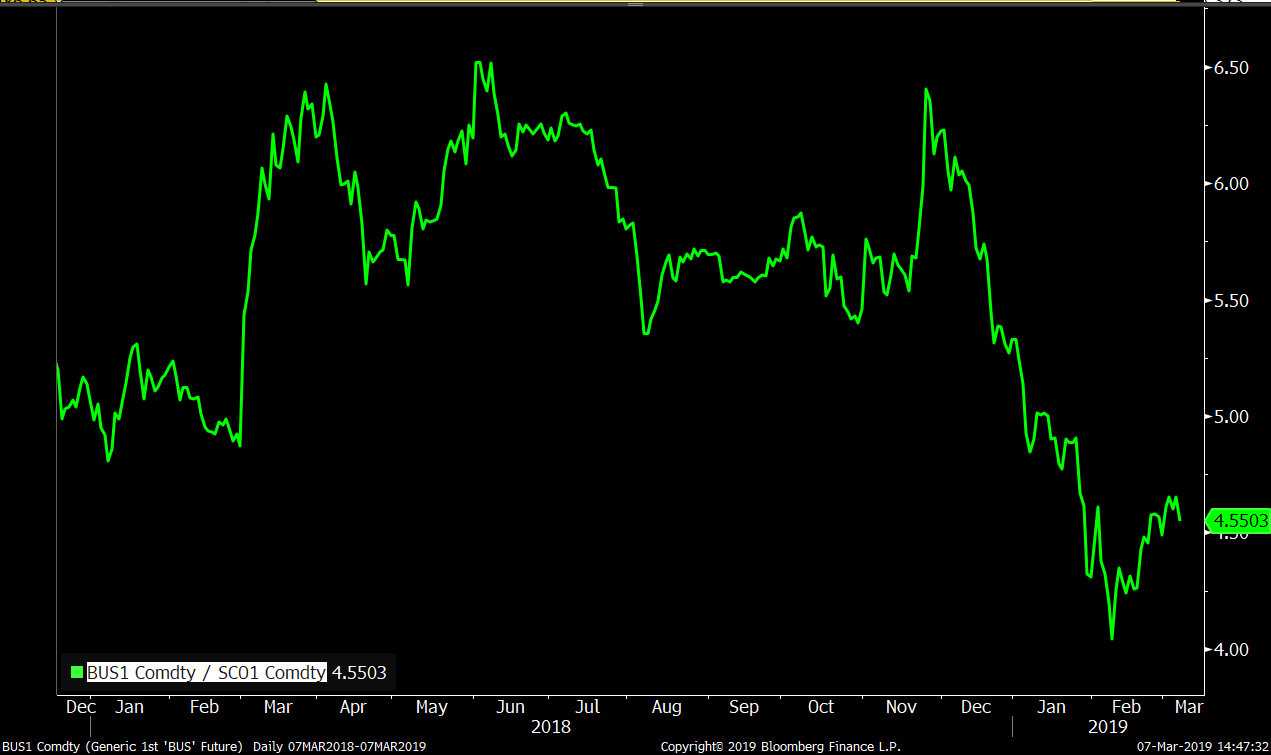
Second, at current levels of iron ore pricing, the relative U.S. pricing looks cheap. The U.S HRC to Iron Ore price ratio chart below (Chart 4: HRC/Iron Ore Ratio), as well as the Busheling Scrap and the Iron Ore Ratio chart (Chart 5: Busheling/Iron Ore Ratio & Chart 6: Turkish HMS 80/20 to Iron Ore Ratio) highlight the basis of the argument presented by those who contend that the U.S. pricing is cheap relative to international markets. Lack of import offers would also point in this direction.
My answer to those presenting both of the above arguments are:
1) Look at the broader Chinese demand landscape to make an assessment on which way the steel pricing moves. Chinese mills have in the past proven immune to a negative bottom-line.
2) The U.S. domestic production ramp-up is not insignificant (Chart 7). With increased domestic production and weaker domestic manufacturing forecasts from players, relative “cheapness” of the U.S. HR can persist as we saw in 2013-2014.
Chart 4: HRC/Iron Ore Ratio:

Chart 5: Busheling/Iron Ore Ratio:

Chart 6: Turkish HMS 80/20 to Iron Ore Ratio:

Chart 7: Weekly Production Rate:

In any case, I don’t think I’d call this “flattening of the curve,” but rather the market exercising caution!
Disclaimer: The information in this write-up does not constitute “investment service,” “investment advice” or “financial product advice” as defined by laws and/or regulations in any jurisdiction. Neither does it constitute nor should be considered as any form of financial opinion or recommendation. The views expressed in the above article by Metal Edge Partners are subject to change based on market and other conditions. The information given above must be independently verified and Metal Edge Partners does not assume responsibility for the accuracy of the information.


