Prices

February 25, 2019
Raw Material Prices: Iron Ore, Coking Coal, Pig Iron, Scrap and Zinc
Written by Peter Wright
In the last month, there has been a positive turnaround of raw materials prices.
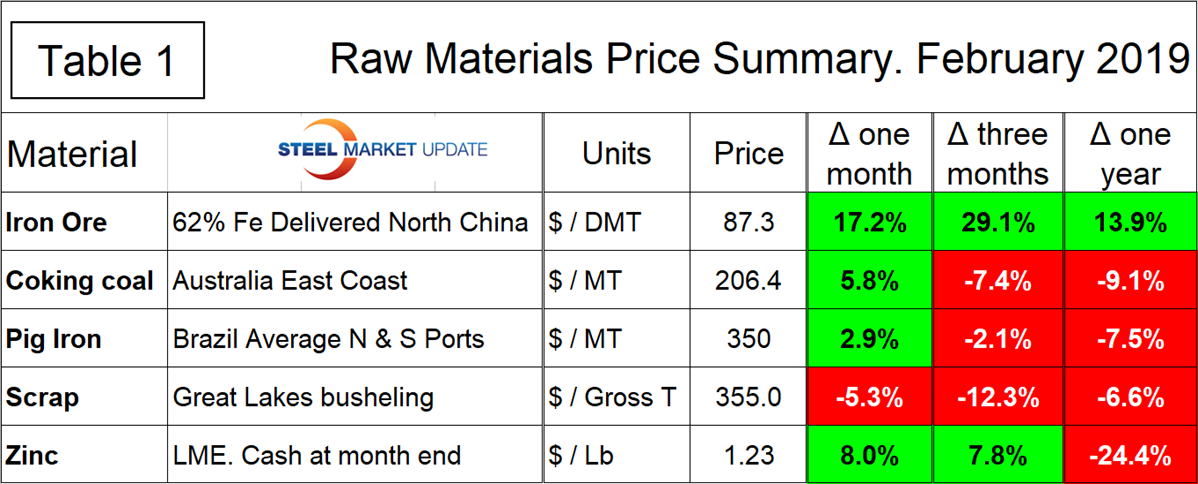
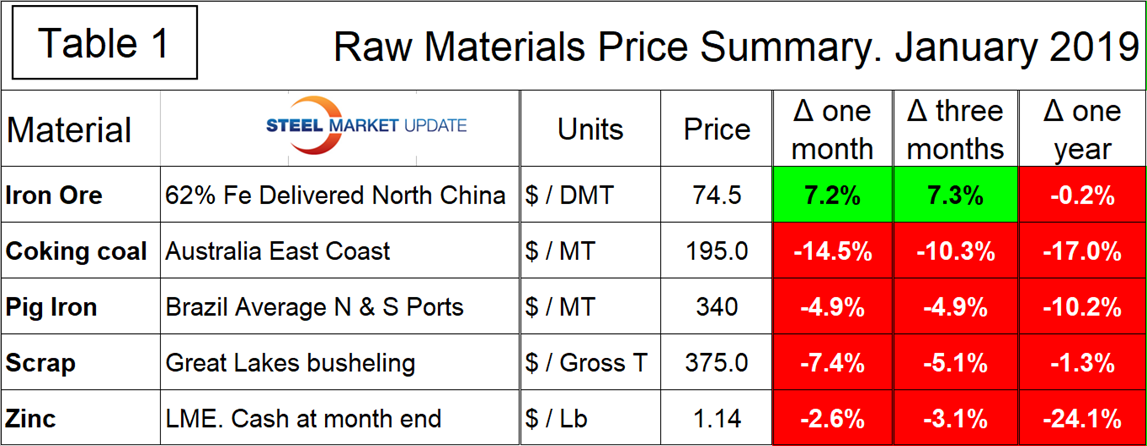
Table 1 summarizes the price changes through February of the five materials considered in this analysis. It reports the month/month, 3 month/3 month and 12 month/12 month changes and tells us that price movements with the exception of busheling have been positive in the last month. To illustrate the magnitude of the change in the last month we have included Table 1 January edition.
Iron Ore
Based on CRU’s data, the weekly average spot price of 62% fines delivered North China was $87.30 per dry metric ton on Feb. 20. The price was up in all three time periods shown in Table 1. Figure 1 shows the price of 62% Fe delivered North China since January 2009. The price of ore has broken out of the $20 range that has existed for a year and a half.
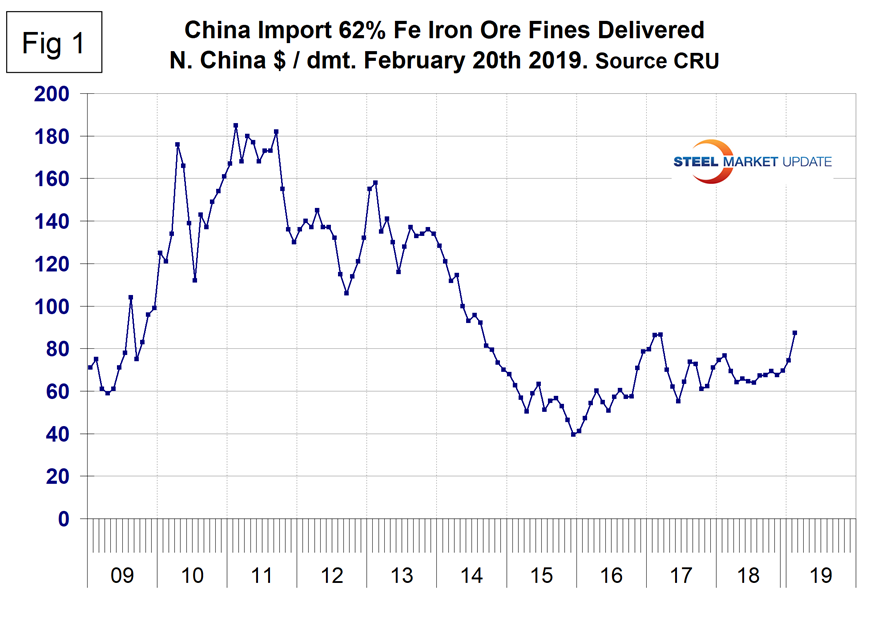
Last week Mining.com reported: “The spot price of iron ore spiked after the Vale mining disaster in late January. With a capacity of over 30 million metric tons, Brucutu is Brazil’s second largest mine. A Brazilian court has ordered mining giant Vale to halt operations at its Brucutu iron ore mine, the largest in Minas Gerais state, following last month’s tailings dam disaster at Brumadinho. Should the company fail in its appeal of the court decision on the Brucutu mine, Barclays Plc analyst Ian Littlewood said closing the operation could ‘wipe out almost all the global production growth’ forecast by the bank this year. Littlewood had earlier predicted mine supply around the world will expand by 34 million metric tons in 2019. On Jan. 29, Vale said it would take as much as 10% of its ore output offline in order to decommission of all its upstream dams, such as the one that burst in Brumadinho. Brucutu, which has an annual capacity of 30 million tonnes of iron ore and has been in operations for 13 years is the second largest mine in the country, behind Vale’s Carajás.”
Coking Coal
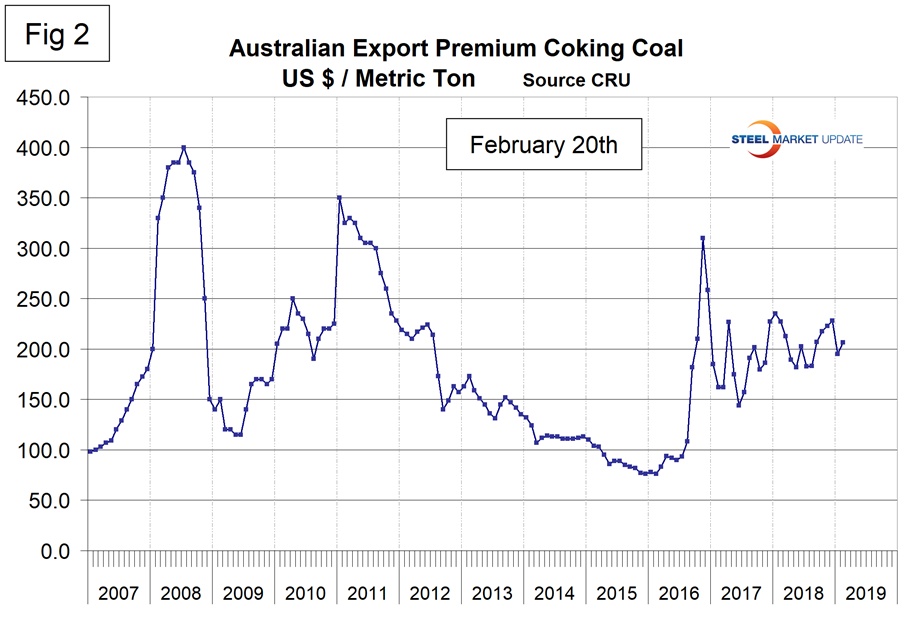
The price of premium low volatile coking coal FOB east coast of Australia declined in January after rising for four straight months. In February, the price bounced back $11 to $206.40 / mt The price has ranged between $179.50 and $235 / mt since October 2017 (Figure 2).
Pig Iron
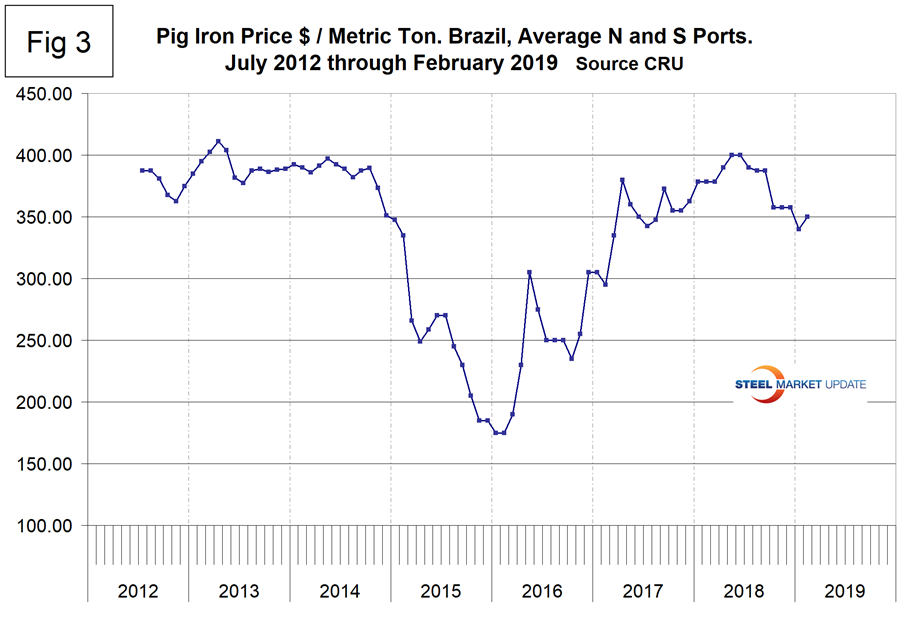
Most of the pig iron imported to the U.S. currently comes from Russia, Ukraine and Brazil with additional material from South Africa and Latvia. In this report, we summarize prices out of Brazil and average the FOB value from the north and south ports. The price steadily increased from the $175 low point in January and February 2016 to $400 in May and June 2018 before declining to $340 in January 2019. There was a $10 recovery in February. The average price in February was 7.5 percent lower than in February last year.
Scrap
To put this raw materials commentary into perspective, we include here Figure 4, which shows the spread between busheling in the Great Lakes region and hot rolled coil Mid West U.S. through mid-February 2019, both in dollars per net ton. The spread has collapsed from $564 in August last year to $363 in February and is approaching a more historically normal range.
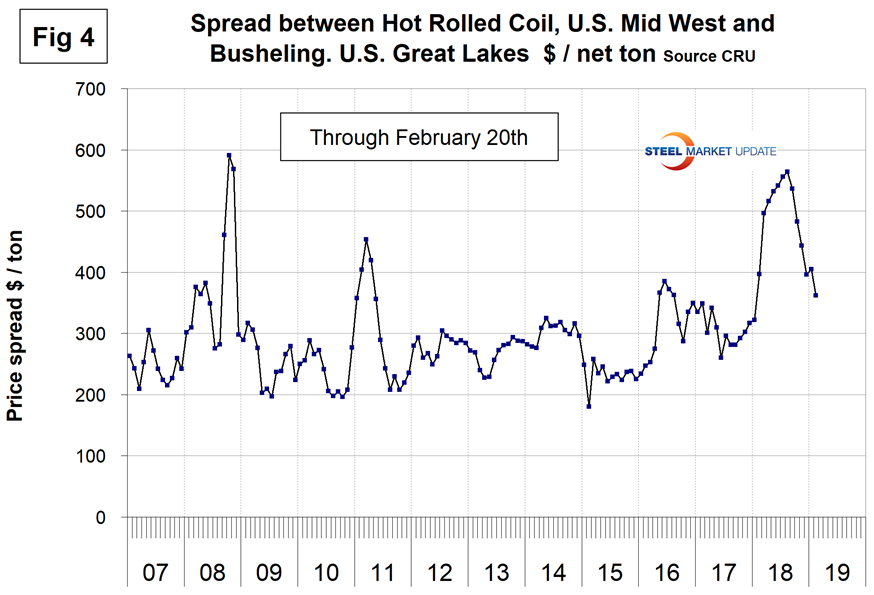
Figure 5 shows the relationship between shredded and busheling both priced in dollars per gross ton in the Great Lakes region. This spread was in the $40 to $70 range for six months prior to February when it declined to $25.
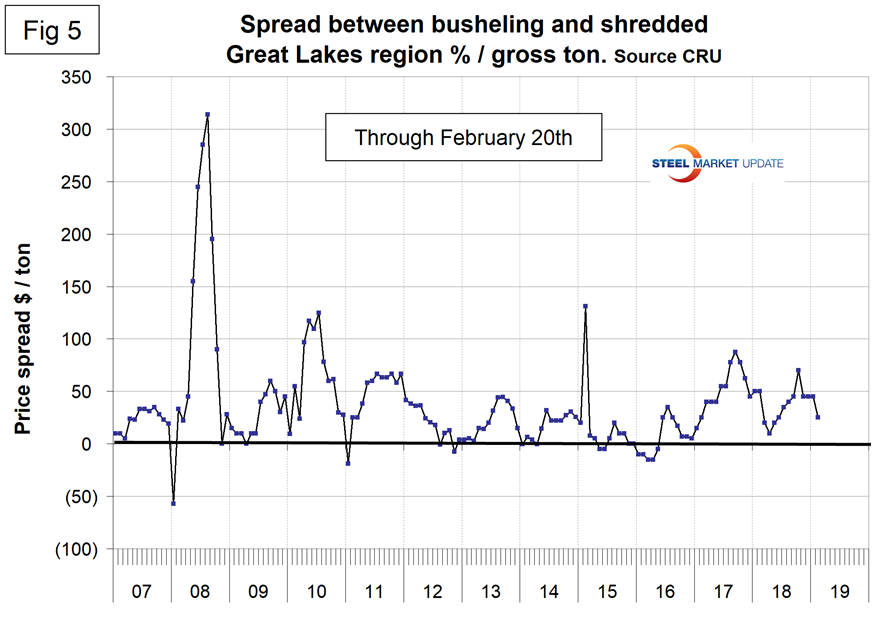
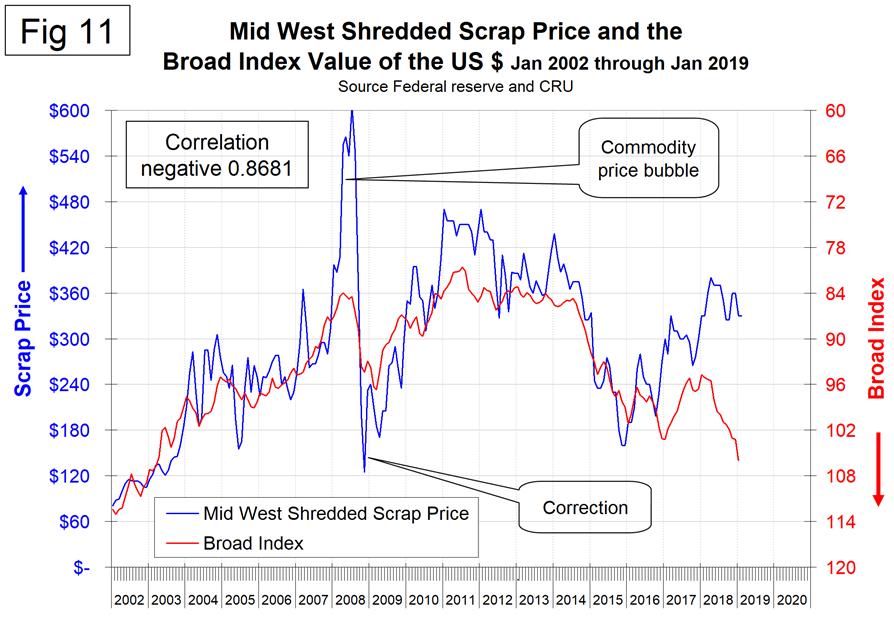
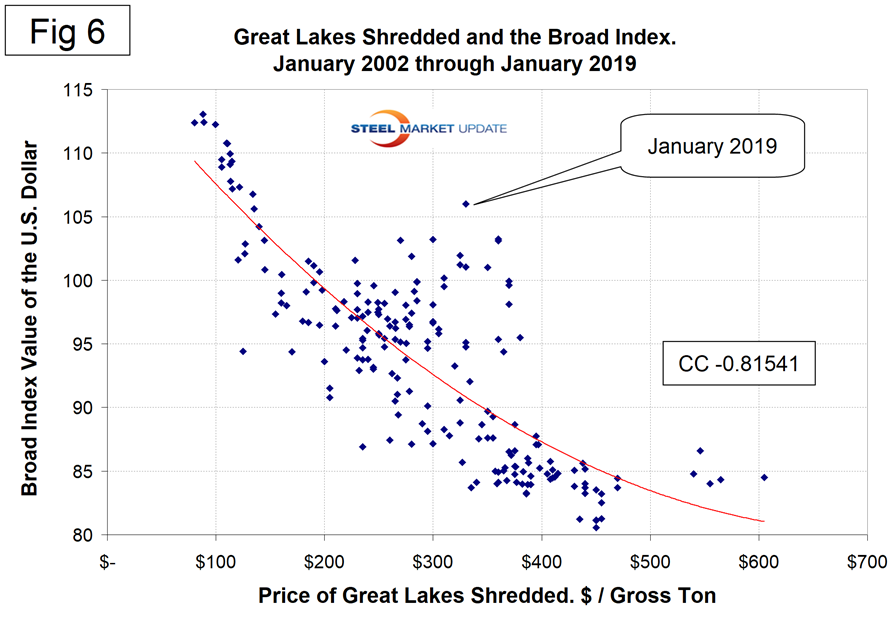
Figure 6 is a scatter gram of the price of Chicago shredded and the monthly Broad Index value of the U.S. dollar as reported by the Federal Reserve. The latest data for the monthly Broad Index was January. This is a causal relationship with a negative correlation of over 81 percent, but the latest data is further from the norm than at any time in the last 17 years.
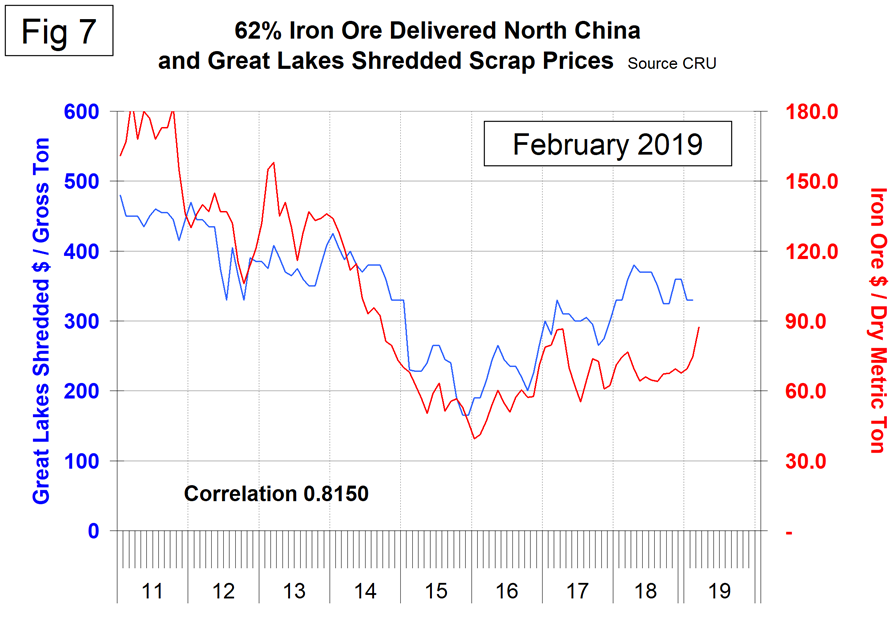
There is a long-term relationship between the prices of iron ore and scrap. Figure 7 shows the prices of 62% iron ore fines delivered N. China and the price of shredded scrap in the Great Lakes region through mid-February 2019. The correlation since February 2006 has been 81.5 percent. There has been a very unusual divergence in these prices since Q2 2017.
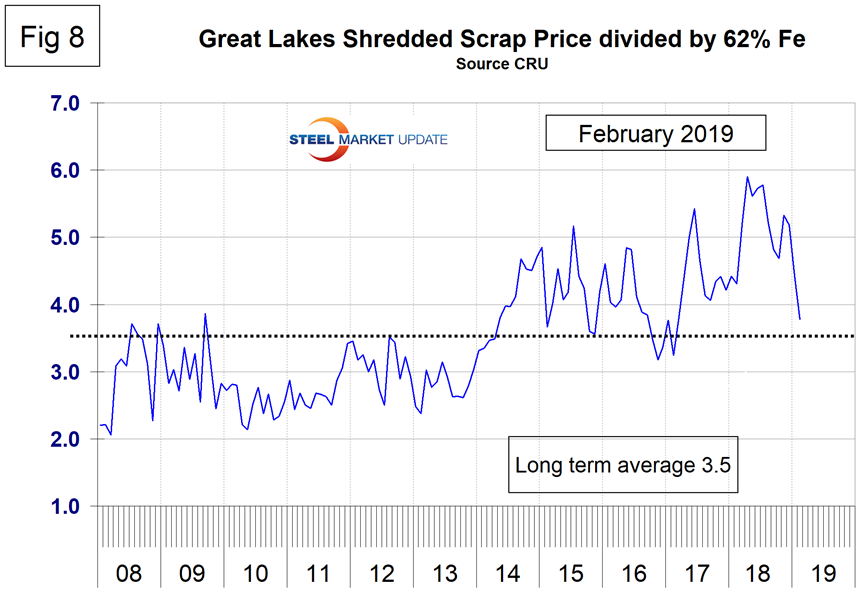
In the last 10 years, scrap in dollars per gross ton has been on average 3.4 times as expensive as ore in dollars per dry metric ton (dmt). The ratio has been erratic since mid-2014, but at 3.8 in February is coming back in line (Figure 8). Since Chinese steel manufacture is 95 percent BOF, when this ratio is high it allows them to be more competitive on the global steel market. In the last four years, there have been times when China could supply semi-finished to the global market at prices competitive with scrap.
Zinc
The LME cash price for zinc mid-month is shown in Figure 9. The latest data is for Feb. 20 when the price was 1.23 per pound and little changed in six months.
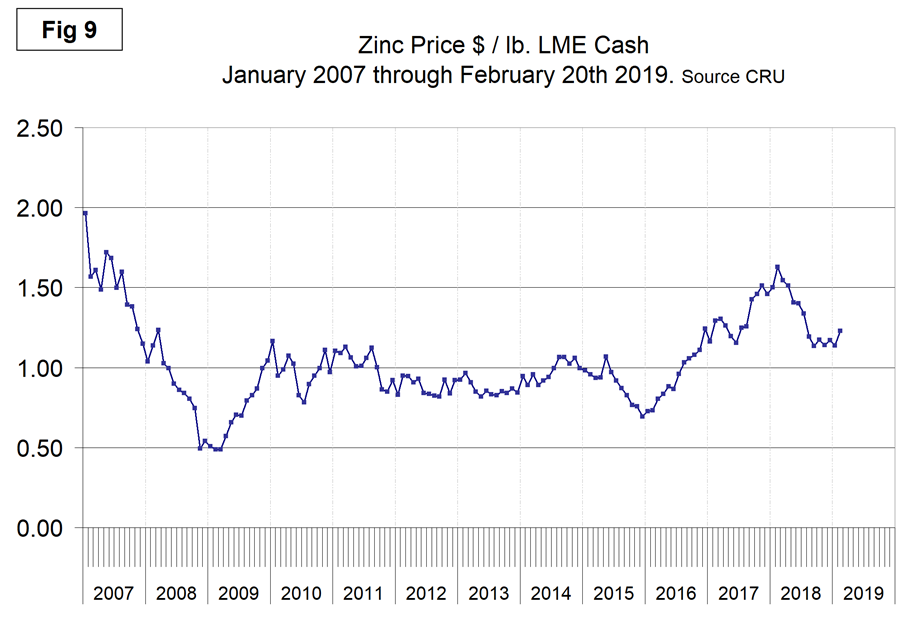
Zinc is the fourth most widely used metal in the world after iron, aluminum and copper. Its primary uses are 60 percent for galvanizing steel, 15 percent for zinc-based die castings and about 14 percent in the production of brass and bronze alloys.
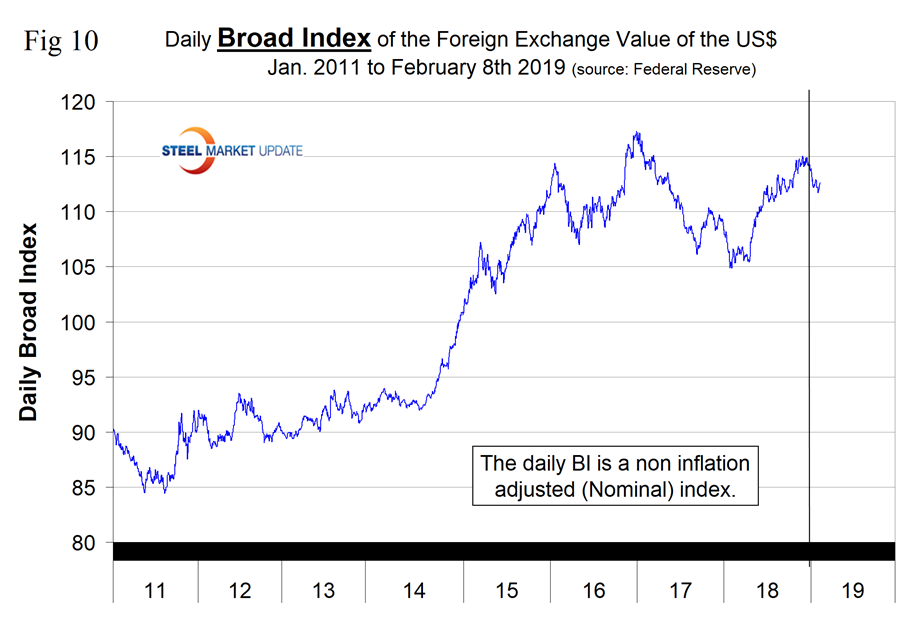
SMU Comment: After appreciating steadily throughout 2018, the dollar has declined in 2019 (Figure 10). There is an inverse relationship between commodity prices and the value of the U.S. dollar on the global currency markets, an example of which is shown for shredded scrap in Figure 6. However, the price of scrap has been completely out of whack for two years now as shown in Figure 11. Long-time subscribers will remember how proud we used to be of our scrap to oil relationship that had a correlation of 93 percent for over 25 years. This has also broken down in the last two years, also with the scrap price currently being too high. Supply and demand fundamentals are the primary drivers of raw materials prices, but a rising dollar acts as a headwind on the price of those global commodities that are priced in dollars. In the case of scrap, something significant must be occurring below our radar screen. We would love to hear from our scrap industry subscribers on why they think long-term price relationships have broken down.
