Overseas
February 7, 2019
CRU: Turkey Cannot Maintain Current Margins on Long Product Exports
Written by Tim Triplett
By CRU Australia Analyst Ryan Smith
China has traditionally dominated long product exports to the South East Asia (SEA) region. However, a change in market dynamics has reduced Chinese export volumes and created an opportunity for exporters from further afield.
In Turkey, economic challenges, in combination with rising trade barriers such as EU safeguards and the doubling of U.S. tariffs on steel and aluminium exports from 25 percent to 50 percent, have left Turkey’s mills with little option but to cut prices and export further afield to reroute volumes that would typically be placed domestically or to these now “safeguarded” regions.
Using historical data, back 10 years for cost data, this insight uses CRU’s Steel Cost Model to investigate the link between production costs in China and Turkey with steel trade flows and Asian steel price dynamics and how both countries influence price in the Asia region depending on the market conditions.
Turkish steelmakers were, for most of 2018, the marginal supplier to the SEA region. However, since China has re-entered the market, Turkish steel is now competing against Chinese steel that has both a lower cost base and a proximity advantage, and prices have dropped to levels below the cost of Turkish EAF production.
Lower Levels of Chinese Exports Put Turkey in the Menu
In late-2016, China began carrying out large-scale supply-side reforms to their steel industry at the same time that domestic demand for steel was improving. A combination of supply constraints and increasing domestic demand inflated Chinese domestic prices relative to export. The chart below illustrates this structural shift in the spread between domestic and export prices for reinforcing bar (rebar) within China. Between January 2012 and September 2016, the spread between domestic and export rebar prices averaged ~$31 /t, but from January 2017 onward the price spread increased to an average of $73 /t—this is indicative of a structural change in market.

Due to the higher margins available from selling steel domestically, Chinese steel exports declined significantly, and this had consequences for regional markets.
The chart below highlights the large volumes of long product steel that was being exported to the South East Asia region from China. Towards the end of 2016 export volumes from China began to decline, leaving a gap in the SEA market that was then met with supply from Ukraine and Turkey. This was fortuitous timing for the Turkish producers who were seeing their traditional export markets in the USA and Europe becoming increasingly out of reach due to trade barriers and tariffs.
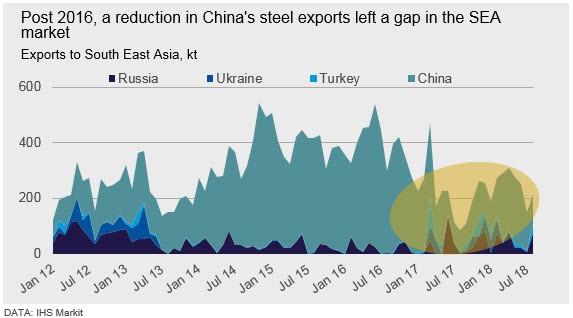
An historical comparison of the Turkey Export FOB price with the Far East Import price clearly demonstrates that, up to end-2016, the Turkey Export FOB price has almost always exhibited a premium to the CFR Asian import price. However, as export volumes from China to the region begin to decline in early-2017, there is a clear switch in the Turkey Export FOB and Asian Import CFR price differential. This is evidence of a change in underlying market dynamics.

Turkey is the Marginal Producer in China’s Absence
Using CRU’s Steel Cost Model, we can analyze steelmakers’ costs to understand which mills are influencing prices at a given point in time.
In China, traders will calculate export FOB steel prices by considering the domestic steel price, target margins, port charges and then remove a portion of the Value Added Tax (VAT) related to rebates. This means that export prices follow domestic prices. As shown in previous charts, China dominated export volumes to the SEA region between 2013 and 2016 and Chinese domestic steel prices influenced Asian import prices via the Chinese export price.
Analysis of the Chinese domestic rebar price relative to the percentile of the Chinese rebar cost curve reveals that, under steady-state market conditions, the domestic price closely follows the 90th percentile of the Chinese rebar cost curve, as illustrated in the chart below. The steel price and cost curve percentile relationship is also evident in other steel products, and an insight on the influence of global HRC costs on Chinese domestic HRC prices can be found here.
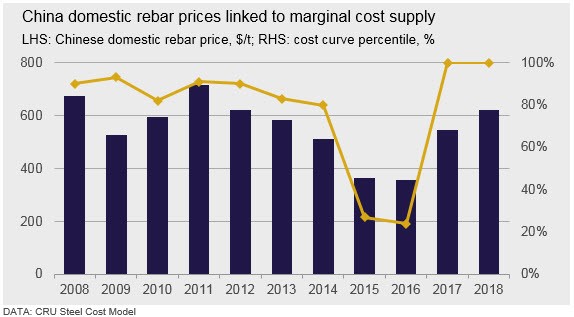
The market was considered to be in a relative steady-state during the years 2011–2012, but from 2013 onwards a number of factors on both the supply and demand side contributed to abnormal market conditions and large price swings relative to the cost curve. These included:
- 2013—Chinese peak steel demand, crude steel production grows 11.9 percent y/y
- 2014—Chinese steel demand declines, crude steel production grows 2.2 percent y/y
- 2015—further declines in Chinese demand, leading to oversupply and price falls
- 2016—Chinese demand subdued in the first half resulted in low prices for most of the year, despite IF and integrated steelmaking capacity eliminations
- 2017—supply constraints combine with demand stimulus to lift prices
- 2018—ongoing supply constraints, margins structurally higher
As domestic prices lifted to a very high level on the cost curve in 2017, Chinese export volumes to SEA declined. At this point the Asian import price began to be less influenced by Chinese export prices, as the marginal cost supplier and price setter had changed.
To demonstrate, the chart below displays the rebar CFR (SEA) cost curve for all major exporting countries to the region. The average Asian import price for rebar for the period January–September 2018 is indicated by the dashed line. As can be seen, the Asian import price intersects the cost curve in the area where the Turkish EAF steelmakers are concentrated. This is evidence that Turkish EAF steelmakers were the marginal suppliers to SEA over this period when export volumes from Turkey and Ukraine had increased.
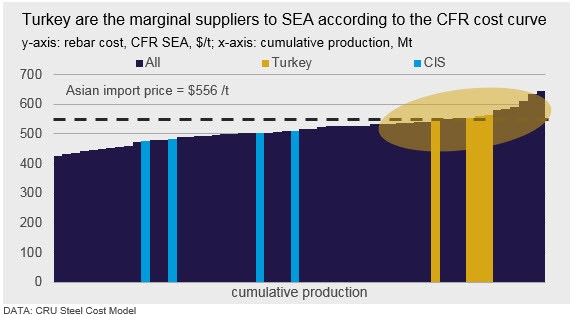
In summary, when China is less present in the Asian market, the price of steel will follow the cost of the marginal producer that, most recently, has been EAF steel producers in Turkey.
At these price levels, Turkish mills are operating at close to breakeven in the export market and margins for EAF long producers are estimated to be in the range of 0–3 percent. In contrast, longs producers in Ukraine and Russia sit in the first and second quartiles of the cost curve. Producers in these countries are still realizing healthy profit margins, estimated in the range of 8–14 percent, and our view is that these producers could withstand further price decreases to levels that would result in Turkey’s producers being forced to rationalize capacity if prices remain close to or below their cost of production for prolonged periods.
Driving Down Prices
In the short-term, as the Chinese economy weakens and steel demand in China experiences a seasonal slowdown, exports from China to SEA have increased, relinking Asian import prices to the Chinese cost base and forcing out Turkish imports for a period. As a result, Asian import prices will remain low in 2019 Q1 when compared y/y to the 2018 Q1 and prices will be sufficiently high to price Turkish producers out of the SEA market. Factors such as Chinese yuan appreciation and a decrease in scrap prices means that the situation will remain dynamic.
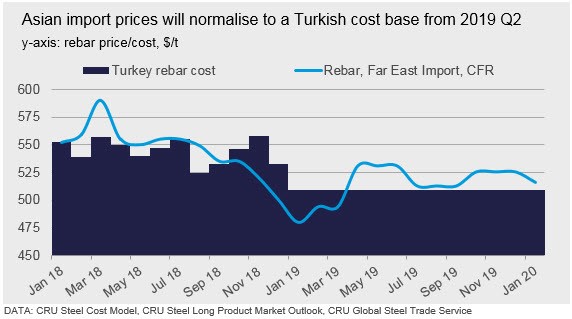
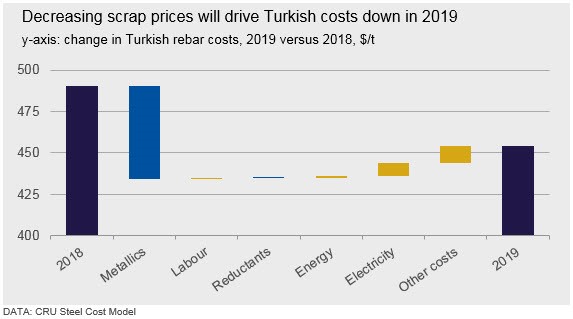
From 2019 Q2, export volumes from China are forecast to decline, creating a gap in the market that, once again, can be met by marginal Turkish supply. Asian import prices will then need to increase to accommodate the higher Turkish cost base, but to a lesser extent than in 2018 due to forecast cost deflation in Turkey.
Using CRU’s Steel Cost Model, we can analyze how costs are forecast to change on a site, country or regional basis up to 2025. In 2019, Turkish rebar production costs are expected to decline, driven primarily by a reduction in scrap prices globally, as shown on the chart below.
Turkey Cannot Compete in the Current Market
Turkish steelmakers are running out of places to export steel. The diversion of Chinese steel away from the SEA market provided some relief to Turkish steelmakers, who were able to re-route volumes to the region.
As China enters a period of seasonally slow demand, export volumes to SEA have increased. Turkish steelmakers are now competing against steel produced in China that has a lower cost base and a proximity advantage to the market. As a result, the marginal supplier to the region has reverted to China and prices have dropped to below the cost of production in Turkey. CRU’s view is that this situation will reverse from 2019 Q2 as domestic demand improves from a seasonal slowdown over winter. When demand improves within China and there is less Chinese steel in export markets, Asian import prices will move higher as they normalize to a Turkish cost base.
For more information about CRU’s products and services, click here.


