Prices

January 31, 2019
HRC Futures: Markets Retrace Some of Their Recent Price Declines
Written by Jack Marshall
The following article on the hot rolled coil (HRC) steel and financial futures markets was written by Jack Marshall of Crunch Risk LLC. Here is how Jack saw trading over the past week:
Steel
The HR futures curve has both flattened and risen versus physical spot HR since its lows on Jan. 7. Optimism is returning to forecasts for U.S. economic growth, which in turn has increased HR hedging activity. Open Interest in HR futures has increased to just shy of 420,000 ST this month on healthy trading volumes, which have passed 370,000 ST traded since the beginning of January. A $40/ST price increase by Nucor this week is also giving the futures market a push, which has led to an increase in hedge inquiries and hedge buy orders.
The price difference between Jan’19 HR and Dec’19 narrowed by $40/ST this past month, reflecting higher ferrous price expectations and a flatter forward curve. Q2’19 HR, which was trading as low as $675/ST in early January, was valued at $712/ST yesterday. A nice $37/ST move higher. We have seen similar price moves in Q3’19 and Q4’19, but on lesser volumes of trading.
To underline the moves going on between spot and physical sales, we can look at where HR spot was the first week of January and compare it to the change in price for Q2’19 HR over the same period. The spot index the CME uses to settle its contract was at $737/ST in the first week of January and it was last reported at $684/ST, a $53/ST decline. During the same period, Q2’19 HR value has gone from $62/ST back (spot $737- Q2’19 HR Future $675) to $28/ST Contango (spot HR $684 – Q2’19 HR $712), which represents an $81 swing in relative value for Q2’19 HR futures. So, yes, we have had some healthy moves in the HR futures curve as well as spot this last month.
Below is a graph showing the history of the CME Group hot rolled futures forward curve. You will need to view the graph on our website to use its interactive features; you can do so by clicking here. If you need assistance with either logging in or navigating the website, please contact Brett at 706-216-2140 or Brett@SteelMarketUpdate.com.

Scrap
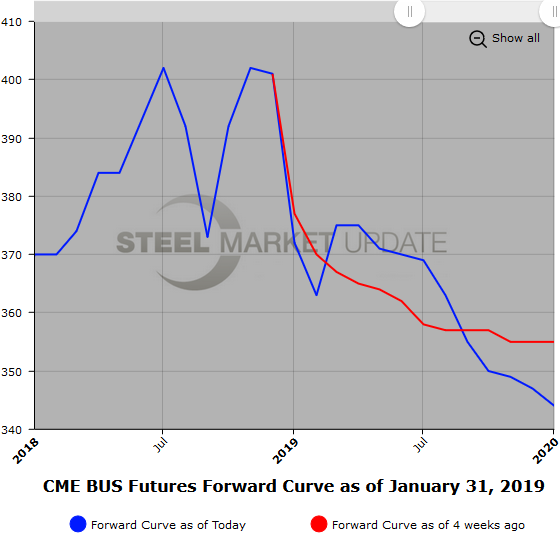
Early chatter had spot Feb’19 BUS declining about $20/GT with expectations of a $350/GT price. However, the latest chatter has seen that price decline narrowing as HR futures firm. The BUS futures curve has moved slightly higher and the backwardation has narrowed. On Jan. 7, the Jan’19 vs Dec’19 BUS futures mid spread was running about $35/GT back ($377-$342) and most recent valuations have that narrowing to $10-15/GT.
Latest bids in 2H’19 BUS were almost $20/GT higher coming in around $365/GT. Early this week, 2H’19 traded at $373/GT, well above the $355-360/GT offer in the broker market at the time. But the latest surge in HR futures and that aggressive 2H’19 BUS buy has left BUS futures sellers backing up their offers. 2H’19 BUS is now offered closer to $385/GT.
We have noticed that BUS futures volumes have been slowing ticking up. We have had over 17,000 GT of BUS futures trade in January. Available volumes to trade are also increasing. You should be able to hedge 500 to 1,000 GT per month without too much difficulty. Clearly that is price dependent.
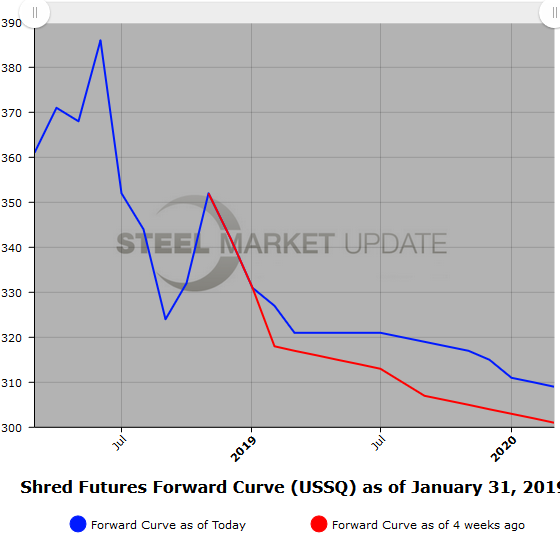
Latest Shred markets (NFX USSQ), we have the balance of calendar 2019 basically $315/GT bid at $325/GT offered. The near Futures months have had the most inquiries so far in this new Futures contract.
Below is another graph showing the history of the CME Group busheling scrap futures forward curve. You will need to view the graph on our website to use its interactive features; you can do so by clicking here.

We have started tracking USSQ shredded scrap futures, shown below. Once we have built a sizable database, we will add this data to our website.


