Market Data

January 25, 2019
Global Steel Production Slows in December
Written by Peter Wright
Global steel production slowed in December, but this was purely a seasonal effect.
Global steel production in December was at an annual rate of 1.765 billion metric tons. Capacity is calculated to be 2.4 billion tons and capacity utilization in December was 74.0 percent, according to the latest Steel Market Update analysis of World Steel Association data. In three months through December, China grew by 9.4 percent year-over-year as the rest of the world grew by 5.3 percent. In 2018, China increased its share of global steel production, which in December was 51.8 percent.
The International Monetary Fund reported Jan. 20: “Last April, the world economy’s broad-based momentum led us to project a 3.9 percent growth rate for both this year and next. Considering developments since then, however, that number appears over-optimistic: rather than rising, growth has plateaued at 3.7 percent. And there are clouds on the horizon. In several key economies, growth is being supported by policies that seem unsustainable over the long term. These concerns raise the urgency for policymakers to act. Growth in the United States, buoyed by a pro-cyclical fiscal package, continues at a robust pace and is driving U.S. interest rates higher. But U.S. growth will decline once parts of its fiscal stimulus go into reverse. Notwithstanding the present demand momentum, we have downgraded our 2019 U.S. growth forecast owing to the recently enacted tariffs on a wide range of imports from China and China’s retaliation. China’s expected 2019 growth is also marked down. Domestic Chinese policies are likely to prevent an even larger growth decline than the one we project, but at the cost of prolonging internal financial imbalances. With their core inflation rates largely quiescent, advanced economies continue to enjoy easy financial conditions. This is not true in emerging and developing economies, where financial conditions have tightened markedly over the past six months.”
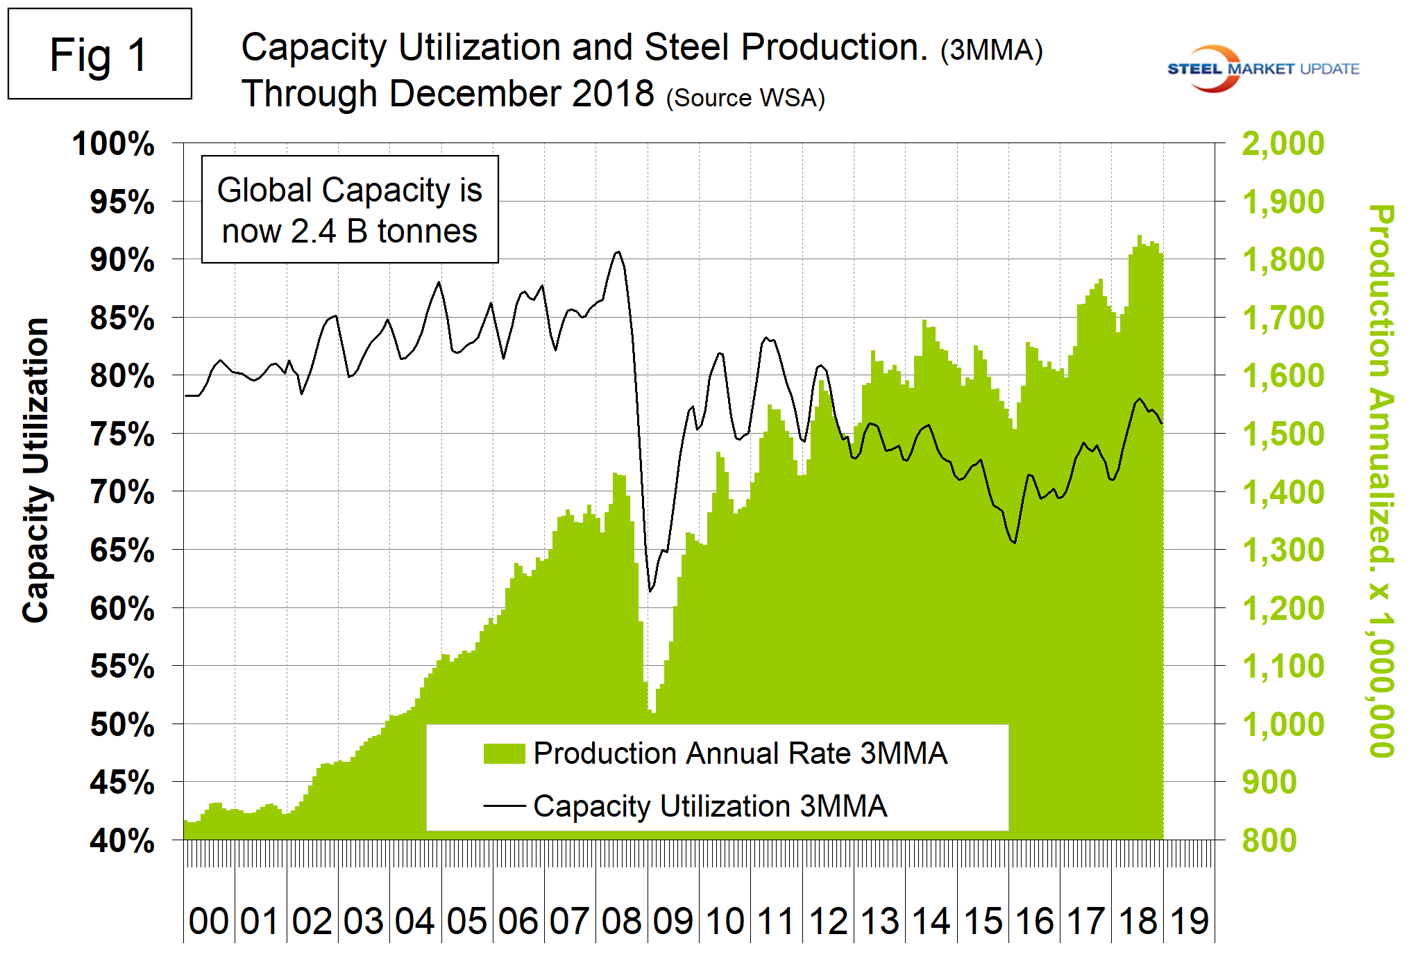
Figure 1 shows annualized monthly production on a 3MMA basis and capacity utilization since January 2000. May through October were the first months for the annualized production rate to exceed 1.8 billion metric tons. Production annualized in December fell back to 1.765 billion metric tons. On a tons-per-day basis, production in December was 4.745 million tons, down from an all-time high in September of 5.040 million metric tons.
On average, global production on a tons-per-day basis peaked in early summer in the years 2010 through 2016, but in 2017 and 2018 the second half downtrend was delayed and in 2018 was barely noticeable on a 3MMA basis. Figure 2 shows the average tons per day of production for each month since 2008. On average, December declined by 3.55 percent. This year, December declined by 4.90 percent.
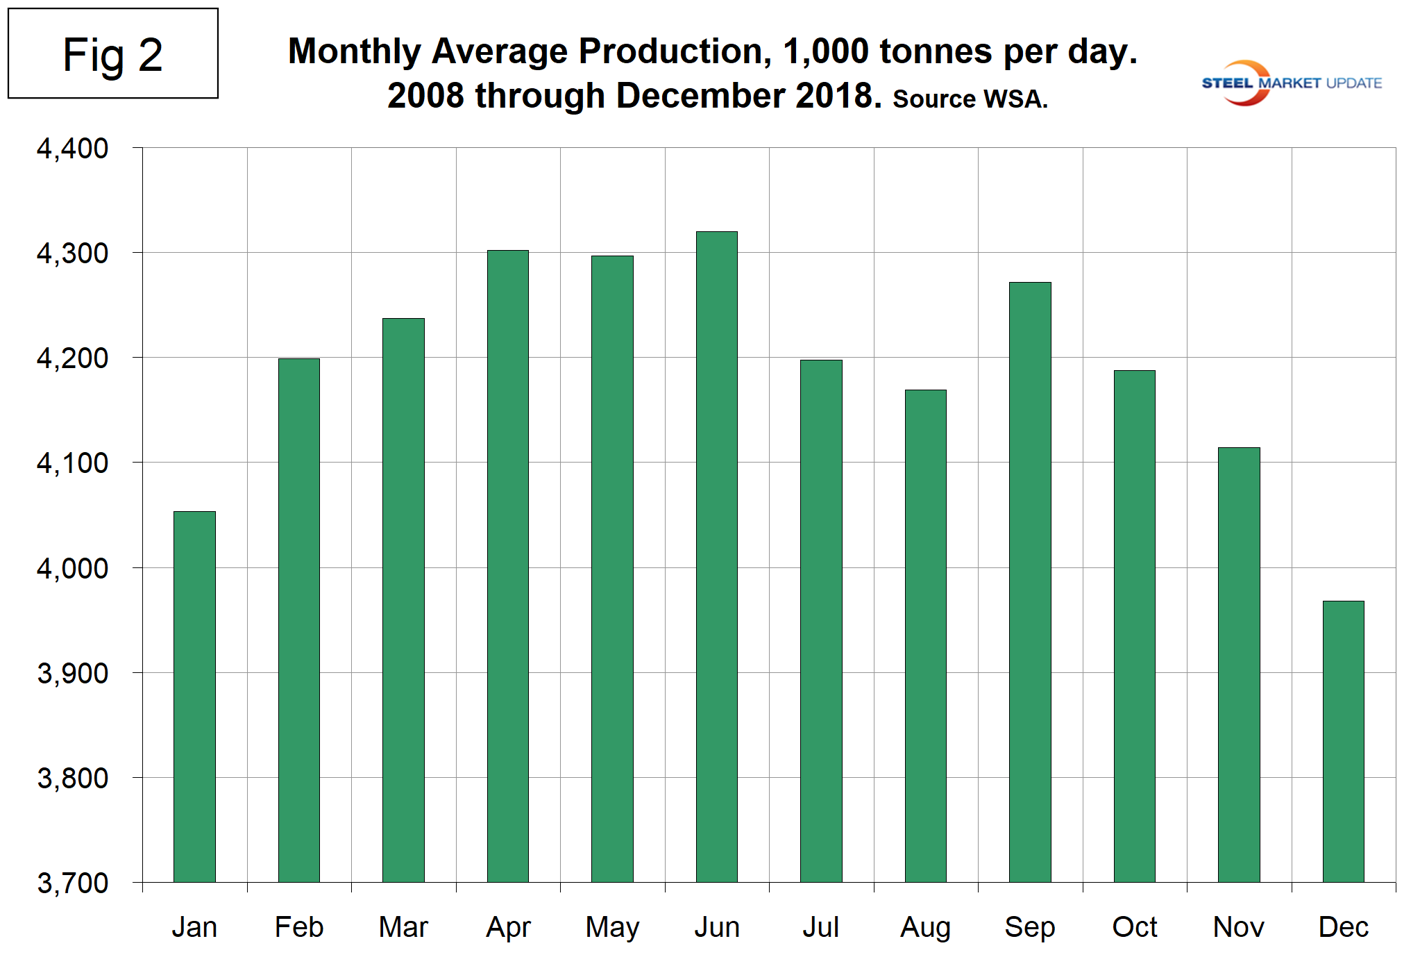
Figure 3 shows the year-over-year growth rate of global production on a 3MMA basis since January 2005. Growth in three months through December was 5.3 percent, up from 5.2 percent in November.
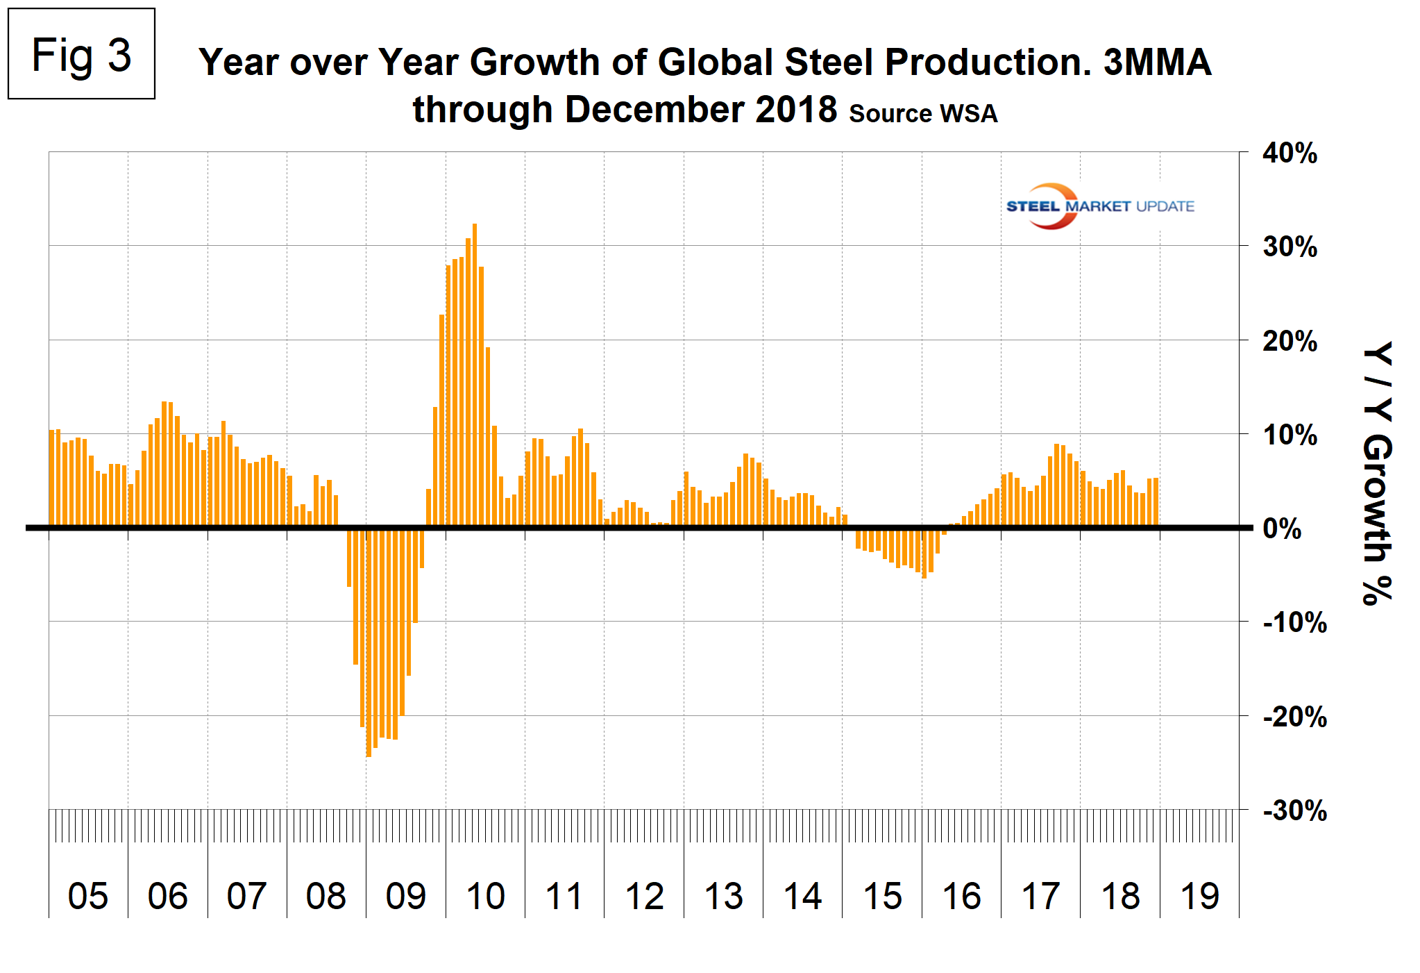
Table 1 shows global production broken down into regions, the production of the top 10 nations in the single month of December, and their share of the global total. It also shows the latest three months and 12 months of production through December with year-over-year growth rates for each period. Regions are shown in white font and individual nations in beige. The world overall had positive growth of 5.3 percent in three months and 4.7 percent in 12 months through December. When the three-month growth rate exceeds the 12-month growth rate, as it did in November and December, we interpret this to be a sign of positive momentum. These were the first months of positive momentum since December last year. On the same basis in December, China grew by 9.4 percent and 6.9 percent. Other Europe, the CIS and South America had negative growth in three months through December year-over-year. The EU was the only region to have negative growth in 12 months year-over-year. Table 1 shows that North America was up by 6.1 percent in three months. Within North America, the U.S. was up by 11.4 percent, Canada was down by 6.4 percent and Mexico was down by 4.9 percent. (Canada and Mexico are not shown in Table 1.)
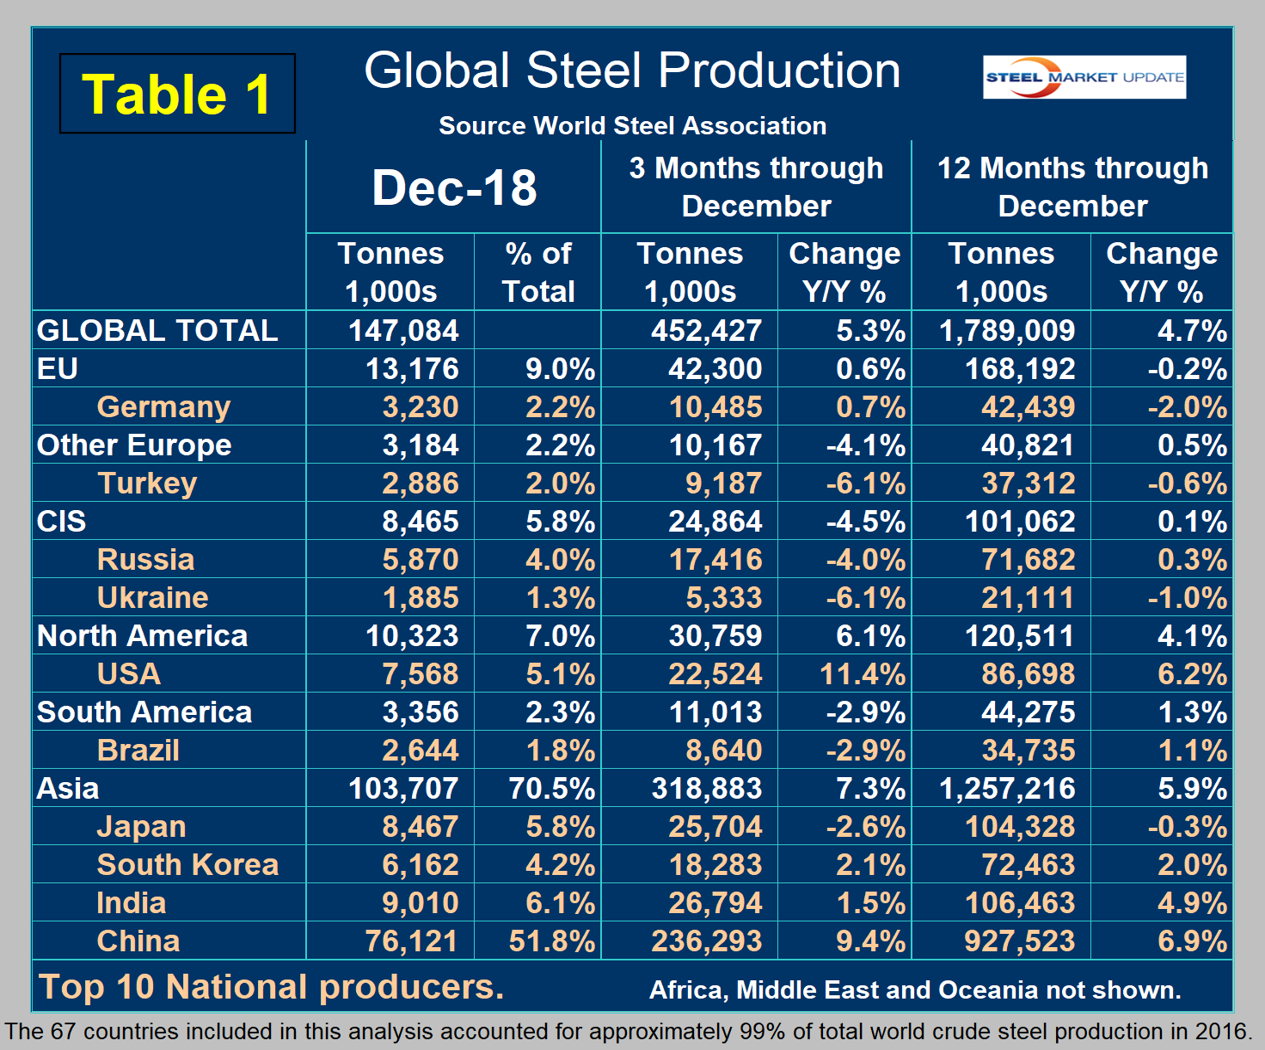
Figure 4 is copied from the WSA website and shows (rather astonishingly) the distribution of steel production in the regions of the world in 2017 and 2018.
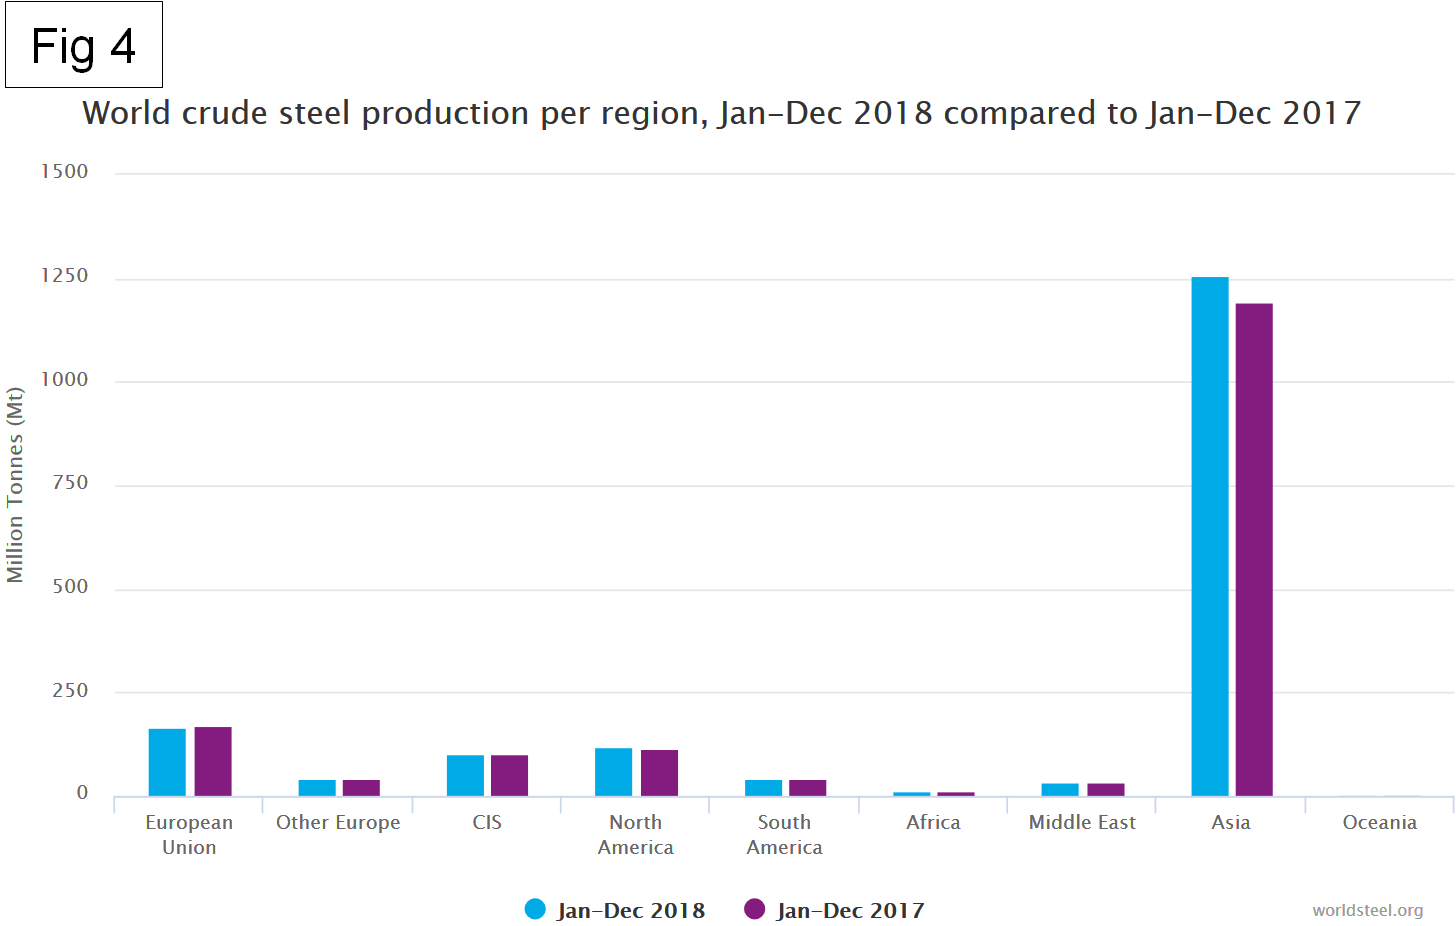
In the 12 months of 2018, 119.9 million metric tons were produced in North America, of which 72.3 percent was produced in the U.S., 10.9 percent in Canada and 16.8 percent in Mexico.
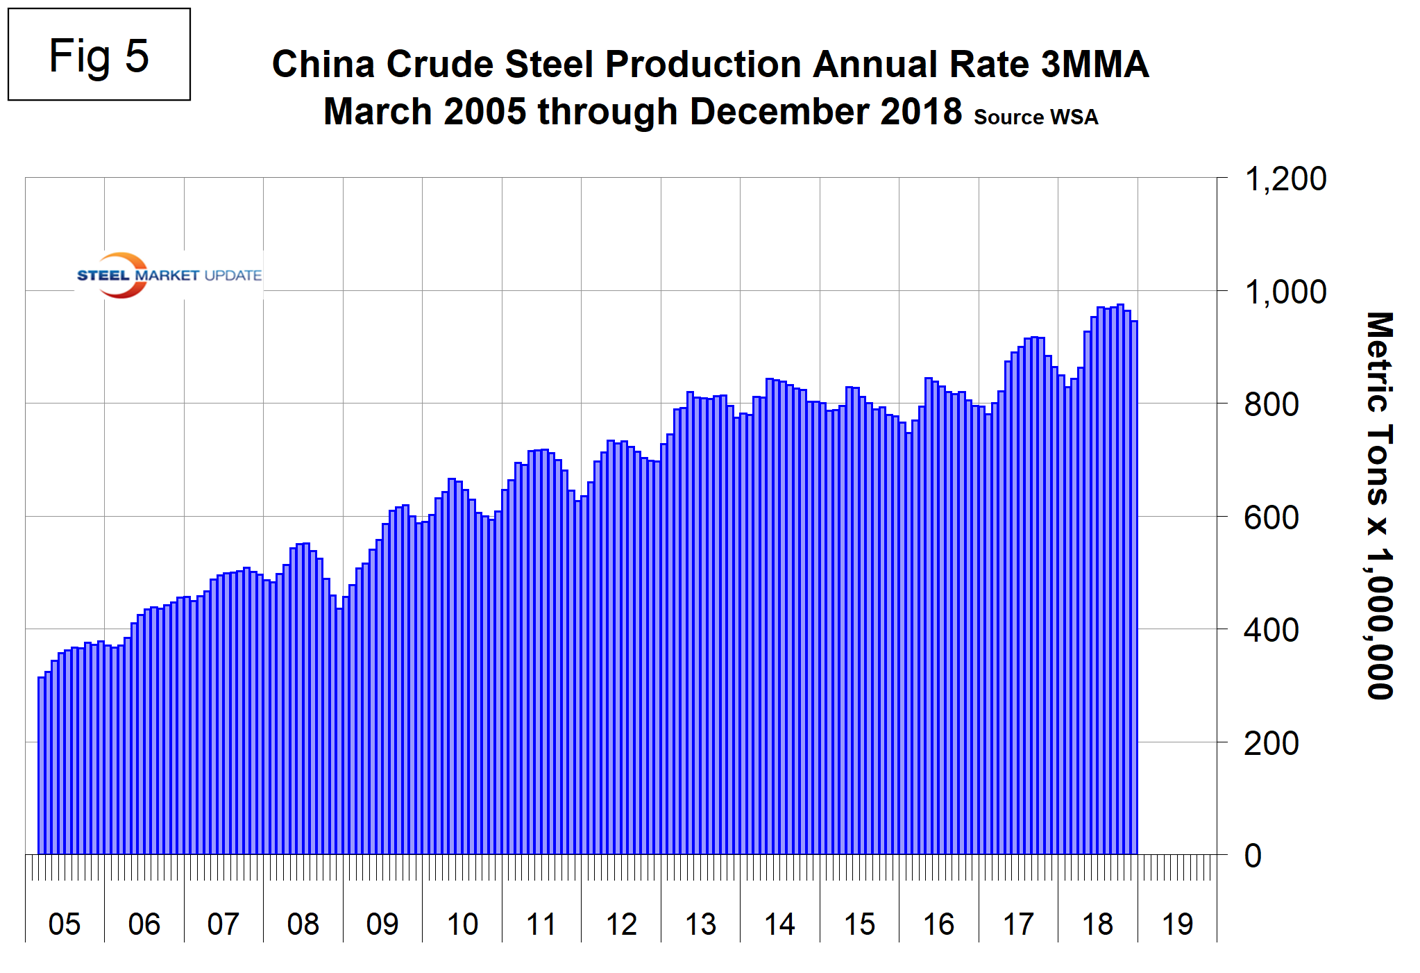
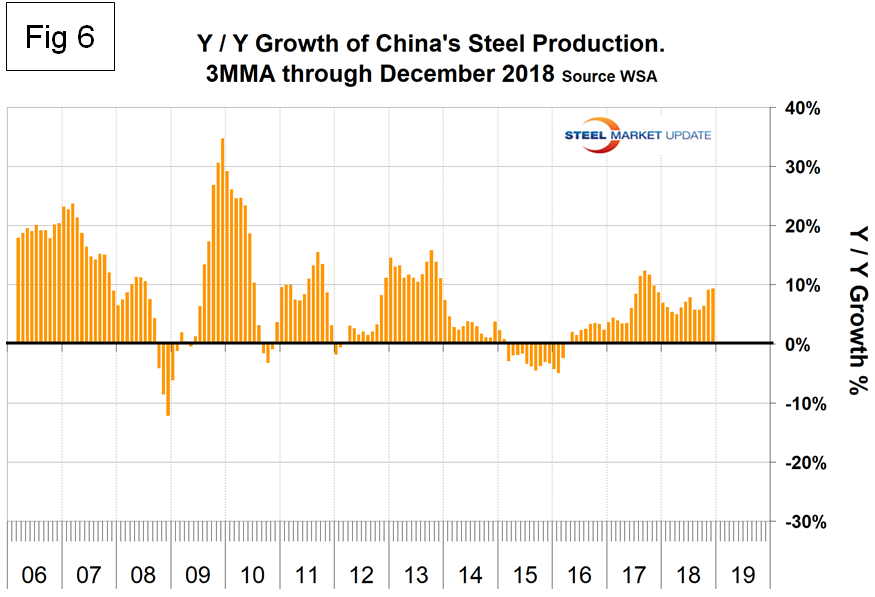
Figure 5 shows China’s production since 2005 and Figure 6 shows the year-over-year growth. China is increasingly dominating the global steel market and is approaching an annual rate of one billion tons of crude production. The WSA is forecasting a deceleration in China’s steel production growth in 2019. The chairman of the World Steel economics committee stated recently that China is expected to experience zero growth in 2019, down from 6 percent this year. This is partly a result of trade tensions with the U.S., he reported.
The October WSA Short Range Outlook (SRO) for apparent steel consumption in 2018 and 2019 is shown by region in the map below. The WSA forecasts global steel demand will reach 1,657.9 million tons in 2018, an increase of 3.9 percent over 2017. In 2019, it is forecast that global steel demand will grow by 1.4 percent to reach 1,681.2 million tons. The next forecast will be released in April 2019. (Note, the essence of this piece is crude steel production; therefore, the numbers are greater than for steel consumption, which relates to rolled products.)
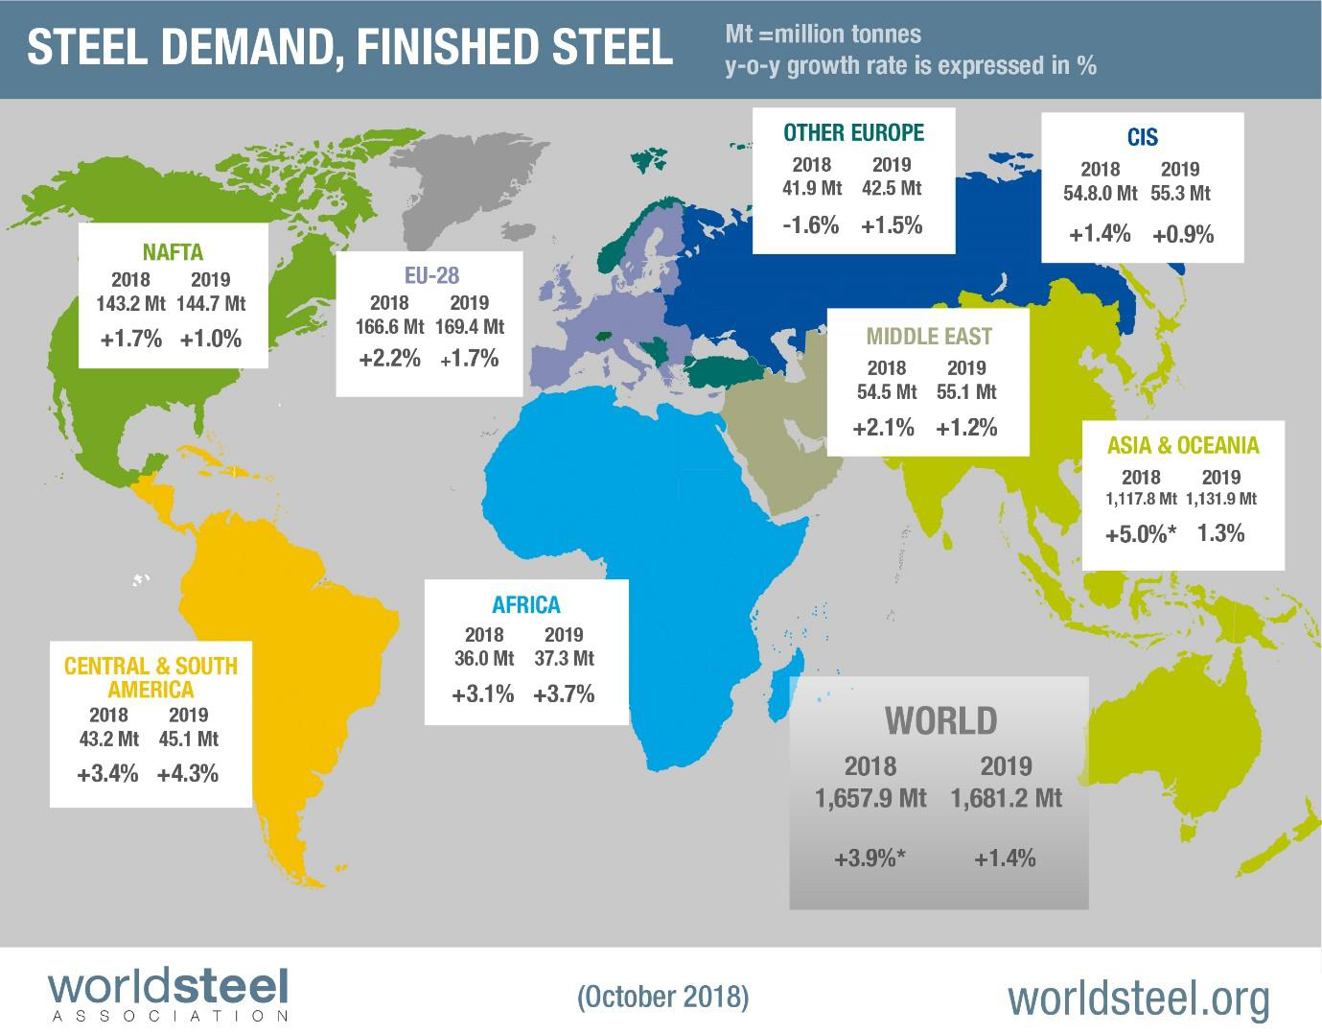
Commenting on the outlook, the chairman of the WSA economics committee said, “The outlook for steel demand in the U.S. remains robust on the back of the strong economic fundamentals.”
SMU Comment: We don’t believe the WSA projection of zero growth in China’s steel production in 2019, but hope we are wrong. New plants are coming on stream in China and almost all of these are BOF-based, according to the August report by the OECD Steel Committee.
This analysis is based on data made public monthly by the World Steel Association. The WSA is one of the largest industry associations in the world. Members represent approximately 85 percent of the world’s steel production, including over 160 steel producers, national and regional steel industry associations and steel research institutes.


