Prices

January 24, 2019
HRC Futures: Searching for Direction
Written by Gaurav Chhibbar
Gaurav Chhibbar is a partner at Metal Edge Partners, a firm engaged in Risk Management and Strategic Advisory. In this role, he and his firm design and execute risk management strategies for clients along with providing process and analytical support. In Gaurav’s previous role, he was a trader at Cargill spending time in Metal and Freight markets in Singapore before moving to the U.S. He can be reached at gaurav@metaledgepartners.com for queries/comments/questions.
The week-over-week change in the curve points to unchanged expectations for a drop in monthly averages for the benchmark index between January and February. The market has traded without conviction further out on the curve. In the past week, we have range bound trading, as well as market participants showing willingness to do calendar spreads, if not always eager to trade outright.
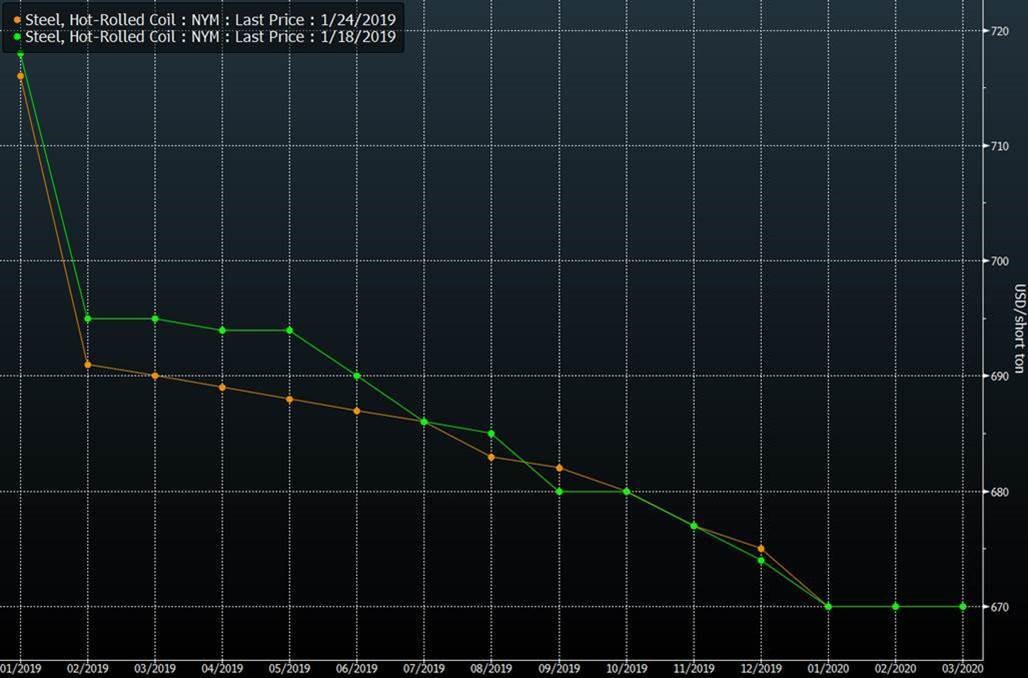
Calendar spreads are useful when traders are looking to adjust their positions. Trading calendar spreads also comes in handy when traders expect one period to outperform another period of the year. Seeing an increase in spread trades is not surprising after you see a big move like the one in the last month. HRC Forward curve from end of December (Green) made a big move down in one month as U.S. spot prices weakened.
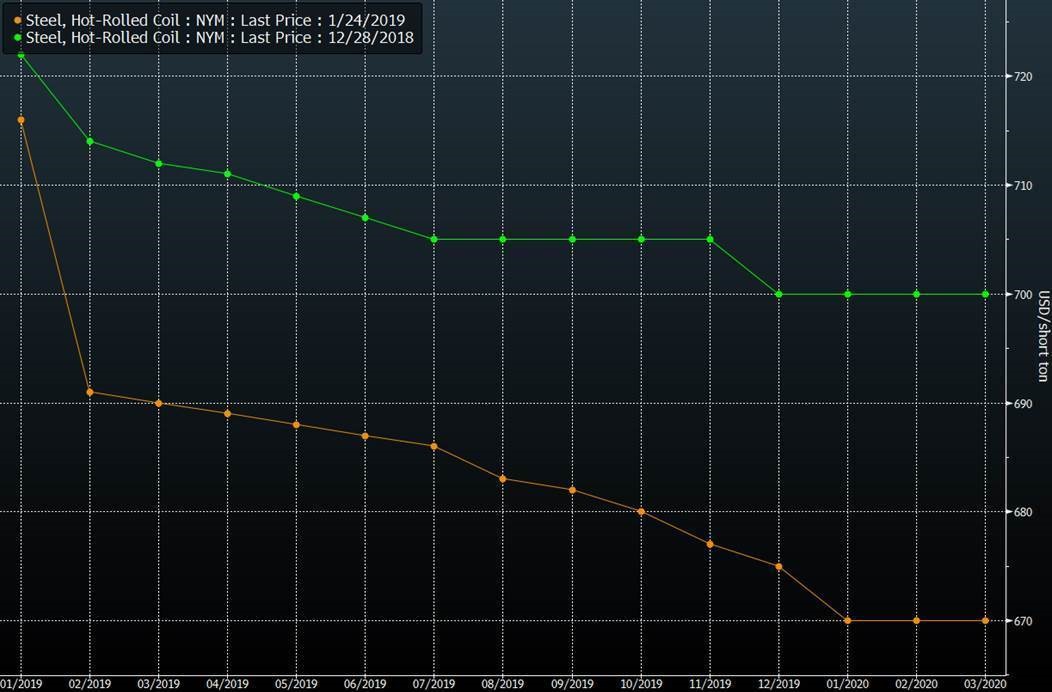
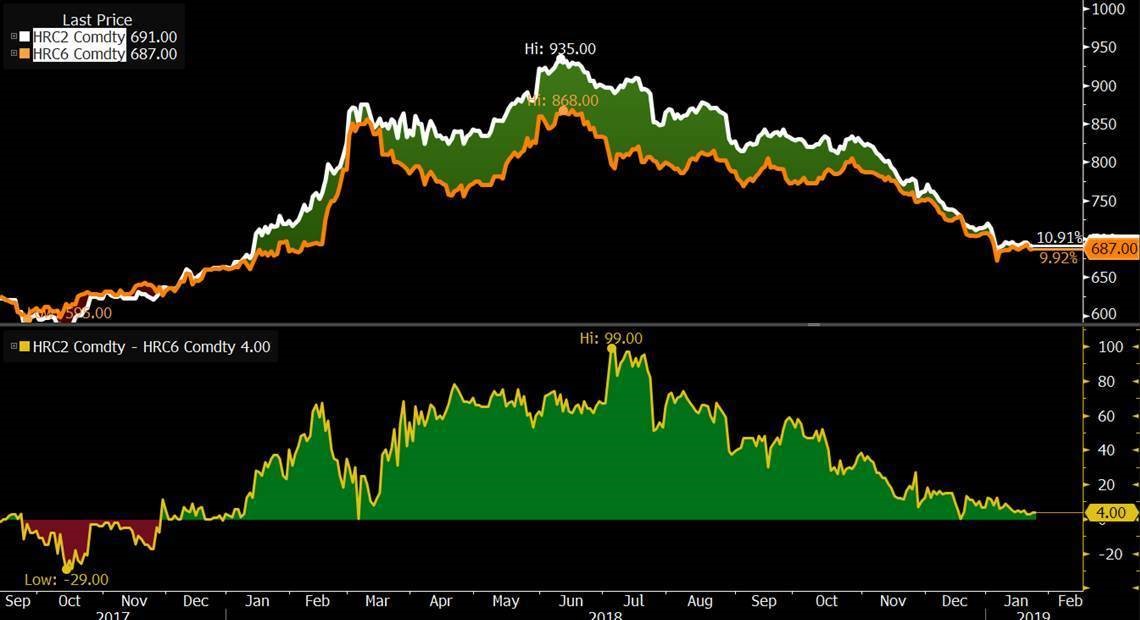
With the downward move, the curve has gotten flatter. The chart below shows the spread between the 2nd and the 6th month. This spread back in July 2018 was at $99.00 highlighting the extent of backwardation we have seen as recently as six months ago.
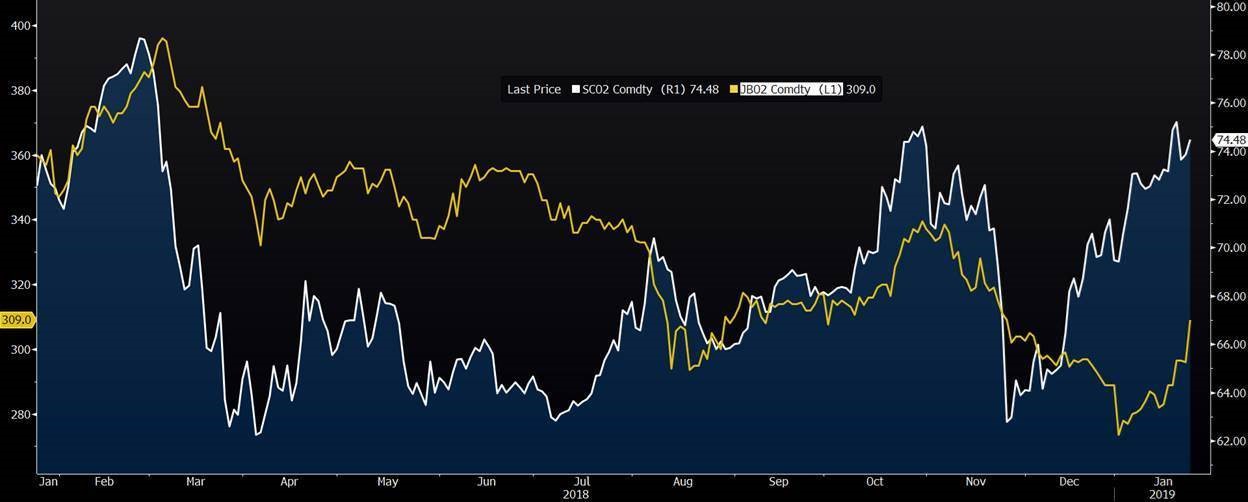
Lack of selling pressure on the back end of the curve is a result of a few factors. Fewer cheap import opportunities that allow hedgers to lock in margins is certainly one of the reasons we have discussed. There is merit to that argument. International steel mills have been experiencing margin compression. Prices of Iron Ore (white) have stayed supported limiting the ability of mills in China and SE Asia to be aggressive on prices. This support on Iron Ore has translated into expectations for scrap prices (2nd month LME Scrap contract -Yellow) turning positive.
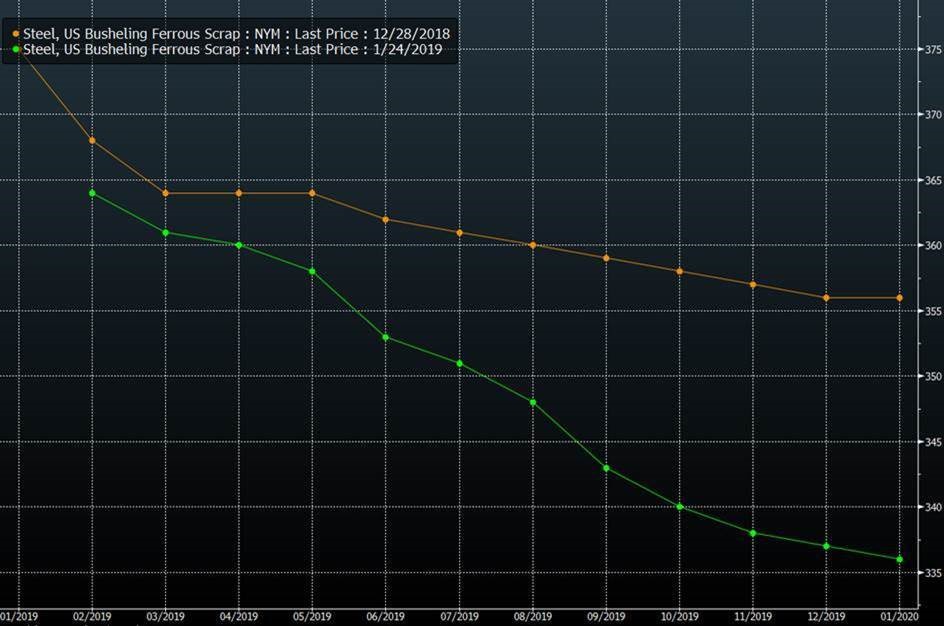
The view on scrap futures in the U.S., however, doesn’t reflect the same view of the future. Month-over-month change in the scrap curve below (Green-today; Orange-last month) shows the future expectations of the market on scrap.
——————–
Disclaimer: The information in this write-up does not constitute “investment service,” “investment advice” or “financial product advice” as defined by laws and/or regulations in any jurisdiction. Neither does it constitute nor should it be considered as any form of financial opinion or recommendation. The views expressed in the above article by Metal Edge Partners are subject to change based on market and other conditions. The information given above must be independently verified, and Metal Edge Partners does not assume responsibility for the accuracy of the information.


