Market Data

January 17, 2019
SMU Currency Analysis: U.S. Dollar Weakens
Written by Peter Wright
The U.S. dollar has retreated from the last Steel Market Update currency report when it had the highest value on the foreign exchange markets for over 16 years.
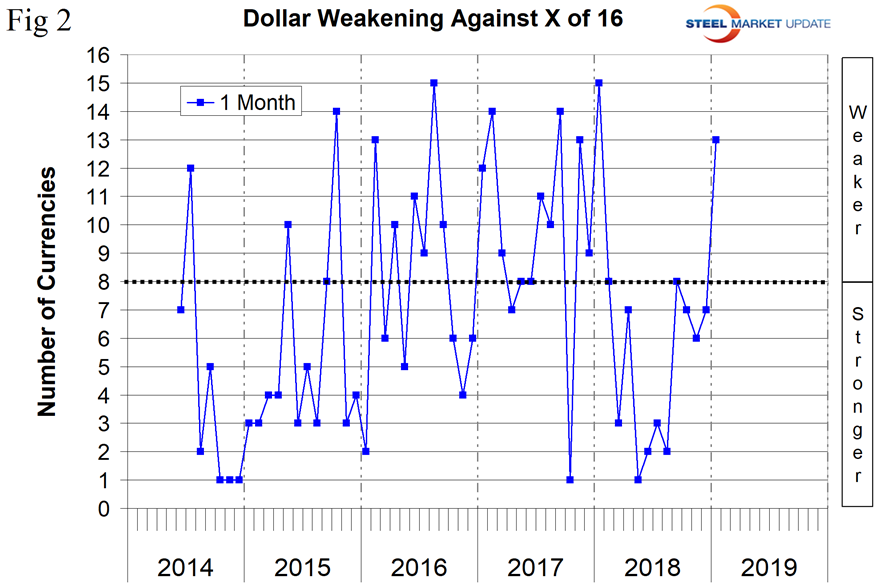
In the last month, the dollar weakened against 13 of the 16 currencies that Steel Market Update tracks. This was a turnaround from November when it strengthened against 10 of the 16 and from December when it strengthened against 9 of the 16. Please see the end of this report for an explanation of data sources.
![]()
Currency analysis is a highly complex yet important requirement for steel industry corporate management. As we produce this update, we look for expert opinion to flesh out the values of the 16 steel trading nations that we track.
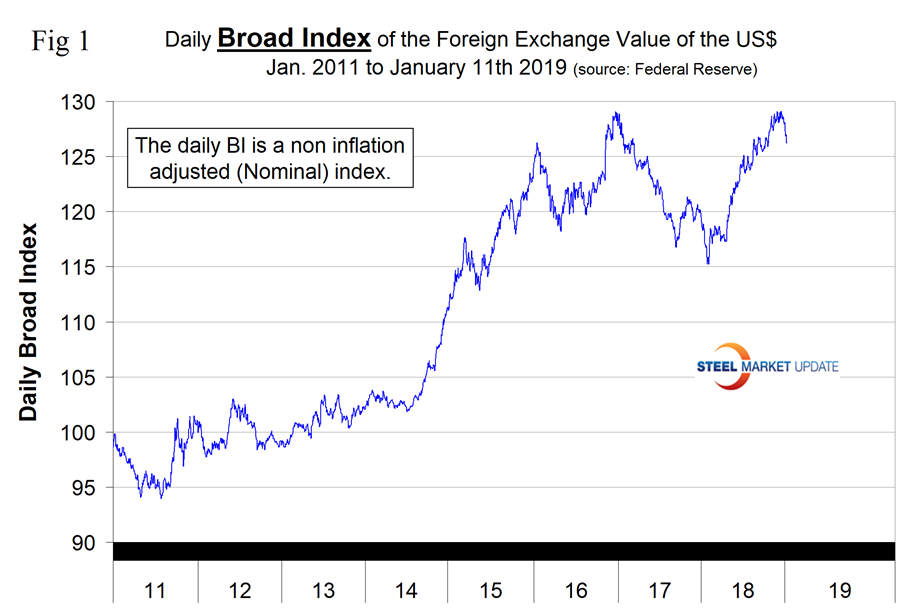
The Broad Index value of the U.S. dollar is reported several days in arrears by the Federal Reserve; the latest value published was for Jan. 11. Figure 1 shows the index value since January 2011. In our last report on Dec. 20, the dollar had its highest value since March 2002 with an index value of 129.12. At that time the currency markets were pricing in the expectation that the Fed would implement two or more rate increases in 2019. This is now appearing less likely. A primary driver of the value of the U.S. dollar is the differential between U.S. interest rates and those of our major trading partners.
Each month, SMU publishes an update of Table 1, which shows the value of the U.S. dollar against the currencies of 16 major global steel and iron ore trading nations. The table shows the change in value in one year, three months, one month and seven days through Jan. 15. Currencies that weakened against the U.S. dollar are color coded in red. Green indicates currencies that strengthened against the U.S. dollar.
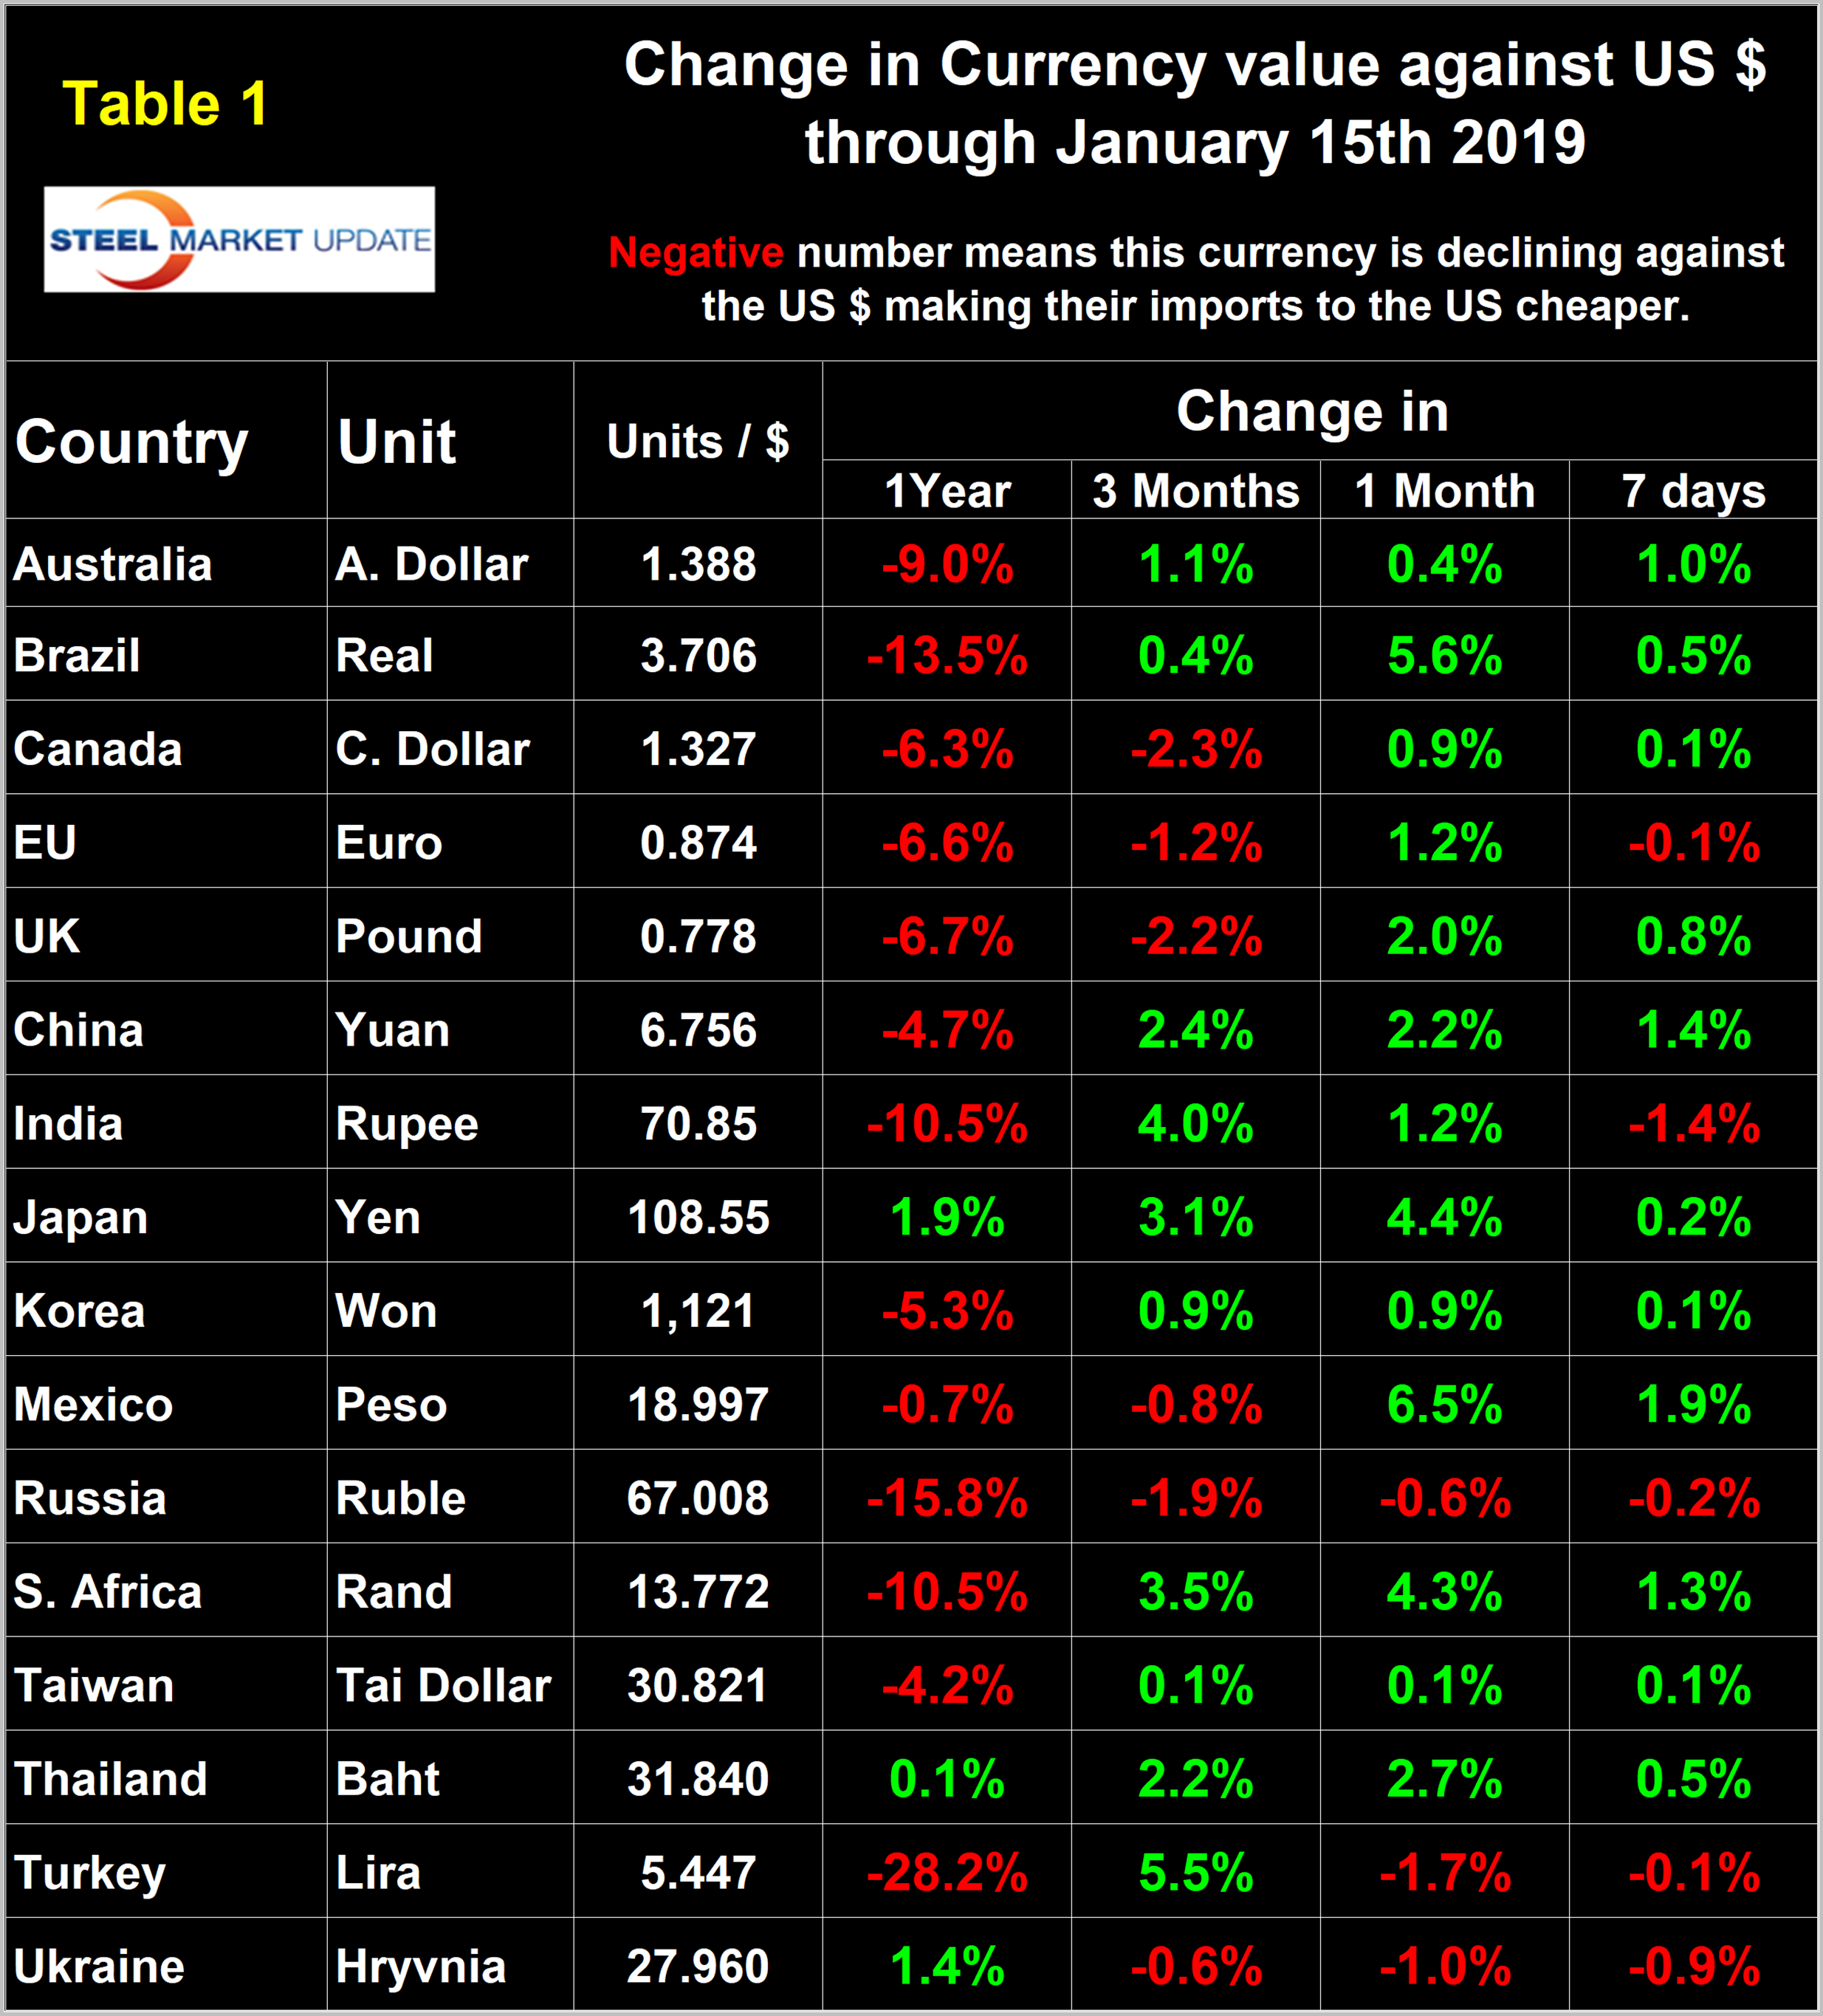
Figure 2 gives a longer-range perspective and shows the extreme gyrations that have occurred in the last three years at the one month level. Through Jan. 15, the dollar weakened against 13 of the 16 in one month and strengthened against the other three.
A falling dollar puts upward pressure on commodity prices that are greenback denominated. We regard strengthening of the U.S. dollar as negative and weakening as positive because of the effect on the trade balance of all commodities and on the total national trade deficit.
In each of these reports, we comment on several of the 16 steel and iron ore trading currencies listed in Table 1 and over a period of several months will describe the history of all of them. Charts for each of the 16 currencies are available through Jan. 15 for any premium subscriber who requests them.
The Euro
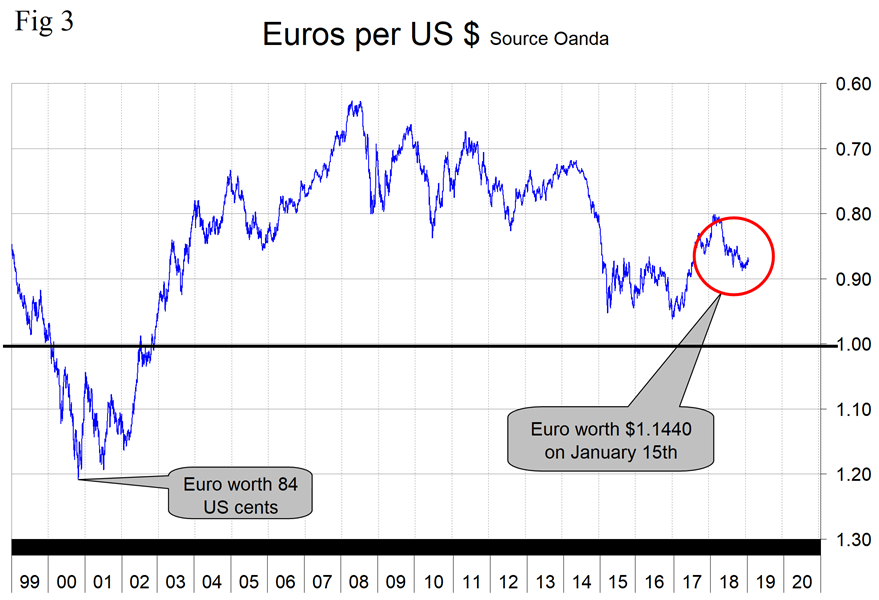
On Jan. 15, the euro was 1.2 percent lower than it was three months ago, but 1.2 percent higher than it was one month ago. On Jan. 9, the CME Group wrote: “As the euro celebrates its 20th birthday, there will be a lot of changes in the region. Jean-Claude Juncker will step down as the head of the European Commission and Mario Draghi will leave his post as the President of the European Central Bank. These two men provided steady leadership through some challenging political and economic times and the world will be watching eagerly to see who will be their successors. The past year has been a difficult one with growth floundering and political crises escalating in France, Spain and Italy. However, 2019 should be a much better year for growth with low interest rates, a weak currency and low oil prices providing a much-needed boost to the economy. ECB President Draghi may also raise interest rates as a final farewell before he steps down in October. The prospect of stronger growth and monetary tightening means we could see the euro trade back up to 1.17 by the end of 2019.”
Australia’s Dollar
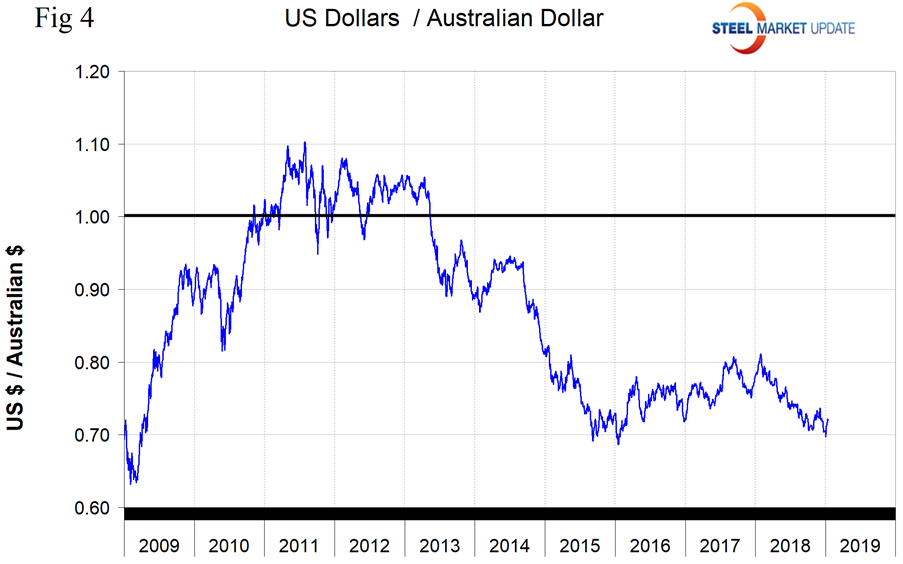
The Australian dollar on Jan. 15 was 1.1 percent stronger than it was three months ago and 0.4 percent stronger than one month ago. On Jan. 7, Max Loh, a currency specialist, wrote: “2019 is shaping up to be an interesting year for the AUD, and I believe the downtrend for AUD/USD is set to reverse. A U.S.-China trade resolution may be on the horizon. This should give a huge boost to the AUD, given most market participants are arguably positioned for a protracted trade war. Importantly, the Fed appears to be changing its tune from “fast metal” to “slow jazz.” Powell appears to be turning dovish, which should put the brakes on the Dollar.”
Brazil’s Real
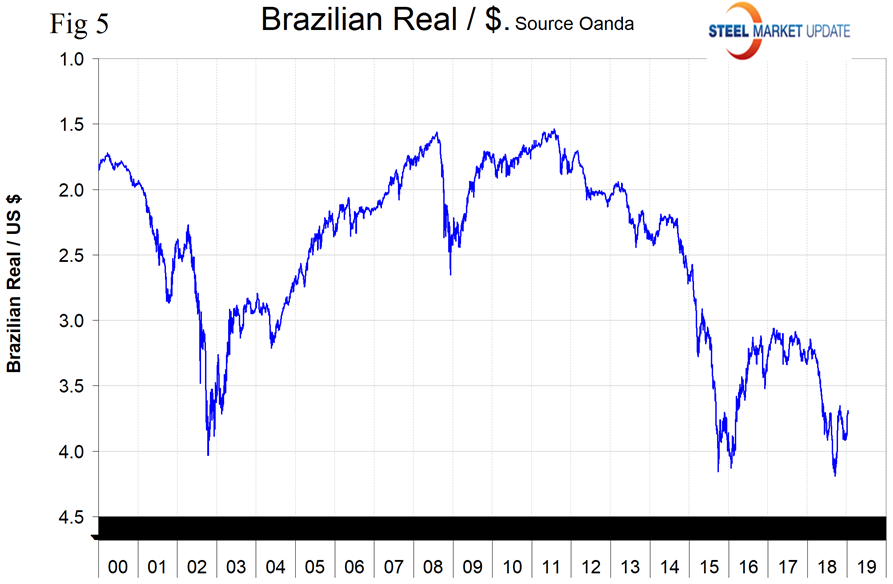
The Brazilian real has strengthened by 5.6 percent in the month through Jan. 15. On Sept. 14 last year, the real had its lowest value since our analysis began in January 2000. Since then the real has strengthened by 13.1 percent.
Japan’s Yen
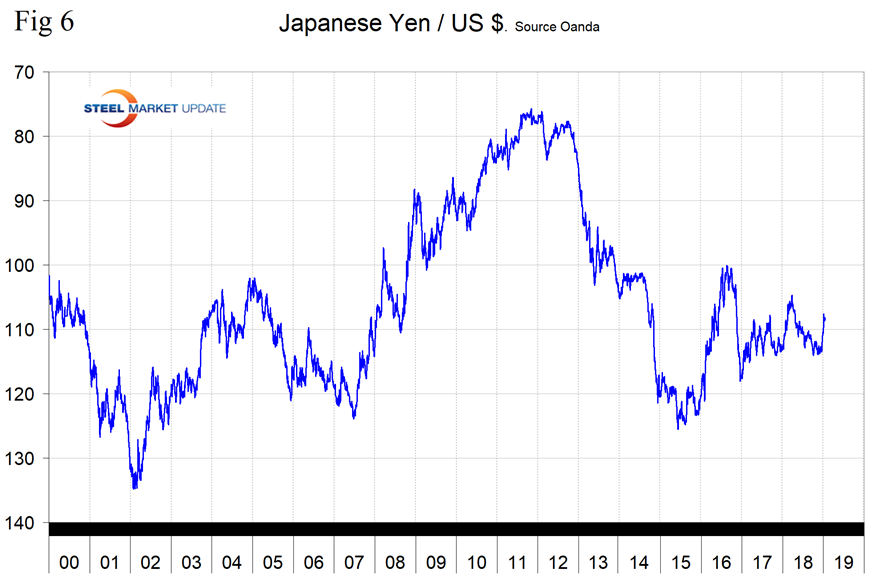
The Japanese yen strengthened by 4.4 percent in the last month and on Jan. 15 was 3.1 percent higher than it was three months ago. On Nov. 27, the IMF summarized Japan’s situation: “The rapid aging and shrinking of Japan’s population will dominate economic policy making in coming decades—impelling a fresh look at the objectives and tools of Abenomics. Six years of Abenomics have yielded some important results, but achieving sustained high growth and durable reflation, while also tackling debt sustainability and a shifting global economic landscape, will require strengthened policies.”
India’s Rupee
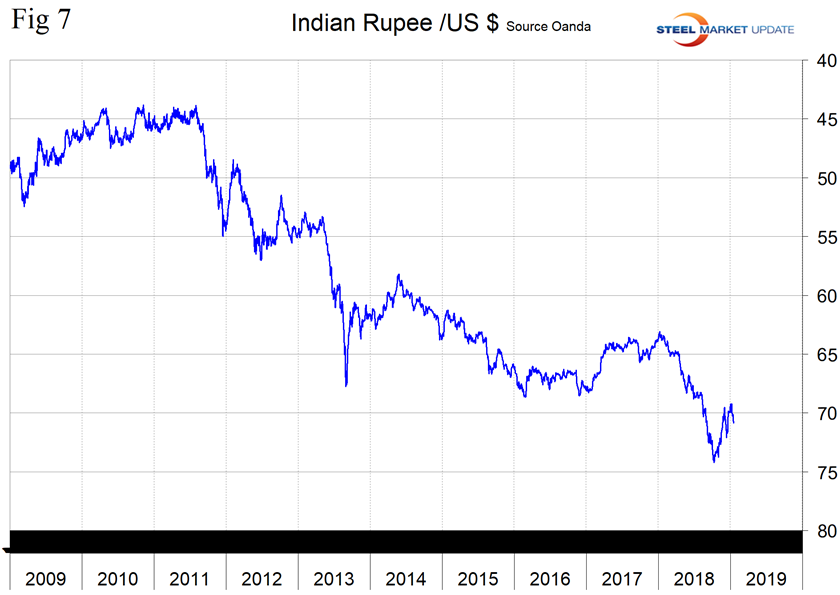
The Indian rupee had a low point of 75.1 to the U.S. dollar on Oct. 6 last year. Since then the rupee has strengthened by 4.6 percent, and on Jan. 15 at 70.9 to the dollar was 1.2 percent stronger than one month previously.
Explanation of Data Sources: The broad index is published by the Federal Reserve on both a daily and monthly basis. It is a weighted average of the foreign exchange values of the U.S. dollar against the currencies of a large group of major U.S. trading partners. The index weights, which change over time, are derived from U.S. export shares and from U.S. and foreign import shares. The data are noon buying rates in New York for cable transfers payable in the listed currencies. At SMU, we use the historical exchange rates published in the Oanda Forex trading platform to track the currency value of the U.S. dollar against that of 16 steel and iron ore trading nations. Oanda operates within the guidelines of six major regulatory authorities around the world and provides access to over 70 currency pairs. Approximately $4 trillion U.S. dollars are traded every day on foreign exchange markets.


