
Prices

January 3, 2019
CRU Multi-Commodity Outlook for 2019
Written by Tim Triplett
By CRU Analysts Laima Balse and Director Paul Robinson
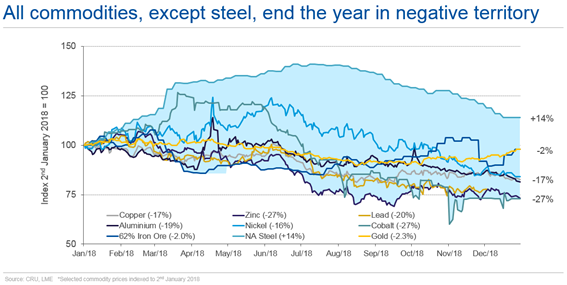
Prices for all major commodities in the CRU price basket, except for U.S. steel, declined during 2018. There were a few factors that caused this downwards price trend and market volatility. This overview looks across the commodity groups at the common trends affecting the industry, and commodities individually, and provides CRU’s forecast view for 2019.
Trade wars and environmental policy have been influencing factors in steel and iron ore markets. The China/U.S. trade war and the resulting implied tariffs on aluminum and steel products had significant implications in 2018, while China’s environmental policy created significant disruptions, particularly in steel and steel raw materials.
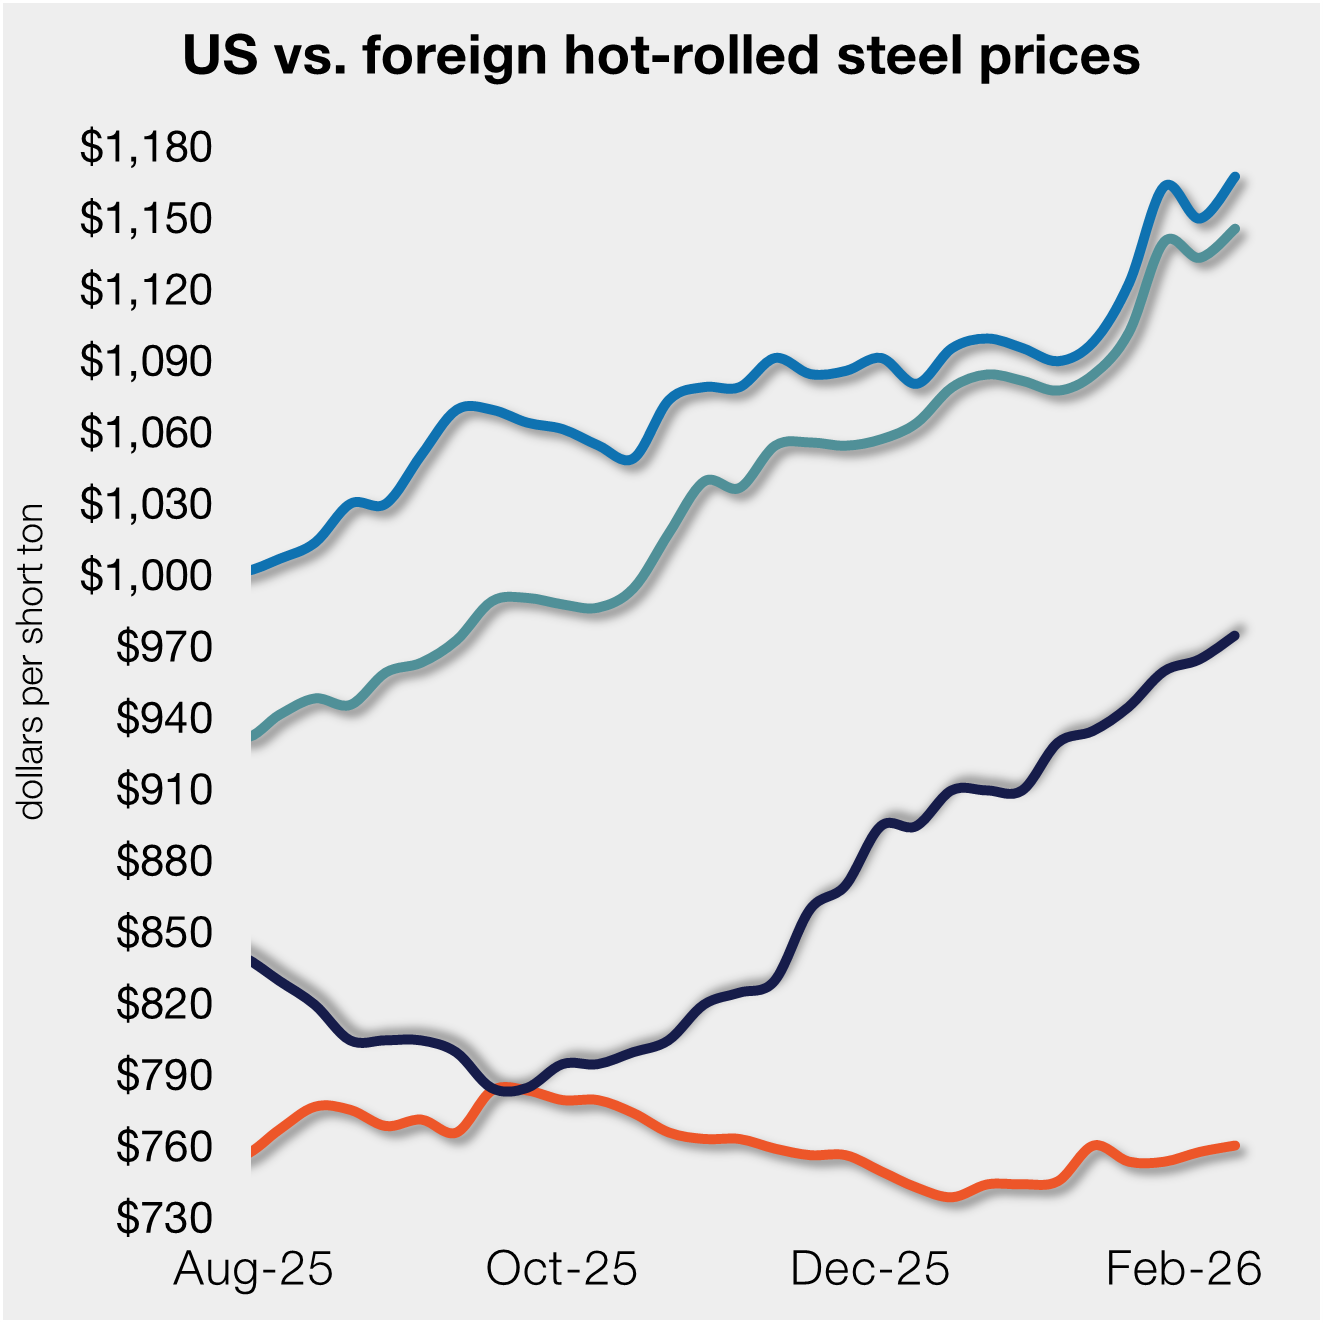
Global steel sheet prices were high in the beginning of 2018. A key support for steel prices initially came from Chinese production curtailments and stronger industrial growth in multiple global markets. In the U.S., additional support came from Section 232 tariffs. Levied at 25 percent across most importing countries, these led to surging prices in the U.S. and caused a cascade of protectionist action around the world as other countries and regions, including the EU, sought countermeasures to lessen the impact on regional markets. However, steel sheet prices were falling by mid-August. CRU expects 2018 will be viewed as a peak year for global sheet prices, for steelmaking costs, and for industry margins.
CRU expects industry costs and margins will continue to fall as the market loosens in 2019 before stability returns from 2020 until 2023. Global sheet consumption is forecast to grow each year through to 2023, though at a declining CAGR of only 1.6 percent from 2019-2023, with slower growth towards the end of the period due to China. As of Dec. 11, China had agreed to cut tariffs on imported American cars from 40 percent to 15 percent. This is the first concrete sign of a cooling in the trade war between the world’s two largest economies since Xi and Trump signed a 90-day truce earlier this month.
China presents a different risk to the forecast; the country is gradually shifting to a more consumer-driven economy with “bluer skies” environmental policies. During 2018, a mix of permanent and seasonal winter production cuts have created a tighter domestic balance, supported prices and allowed Chinese mills to achieve average EBITDA margins of 19 percent. However, the impact of these cuts this past year was more limited compared to 2017. The cuts are more widespread geographically and are being implemented over a longer time compared with last winter. However, in light of the trade war and macroeconomic uncertainty, the production cuts at end-2018 have not been as strict as in end-2017. Therefore, steel production is a bit higher than last year and steel prices and steelmakers’ margins have fallen from record highs as a result.
The year 2018 was exceptional for high-grade iron ore producers. When margins are high, steelmakers prefer to use high-grade iron ore such as pellets and high-grade fines in order to boost productivity. Therefore, the premium for 65% Fe iron ore above the 62% Fe benchmark reached as high as 45 percent in July. However, due to recent changes in the supply-demand balance in China, the preference for high-grade iron ore has reduced substantially. Going into 2019, we are expecting the high-grade premium to stay around 20-25 percent and the annual pellet premia to increase slightly compared with 2018. CRU sees a final supply push by the larger iron ore producers in 2019, which, in combination with a weaker steel industry, will result in benchmark prices averaging $61 per ton next year.
Base metals glided sideways before declines in H2 2018. All LME metals (Al, Co, Cu, Ni, Pb, Zn) registered price increases in 2017, but all of these prices declined by at least 15 percent from January to December 2018. In general, prices moved sideways, trading in a narrow range over H1 followed by a late summer sell-off across LME metals, which weighed on prices. Nickel and cobalt prices were buoyed by battery market euphoria in H1, but both ended the year lower.
In 2019, a combination of market deficits and sentiment will lift 2019 average prices for aluminum and nickel. Copper prices will continue to recover from 3Q18 lows, while zinc and lead prices will decline.
New supply will cause the zinc price decline to continue into 2019. Over 1 million tons of new mine supply will hit the zinc market in 2019, while consumption growth will be just 184,000 tons, raising the prospect of a potential bottleneck if smelters don’t lift their utilization rates. However, the refined metal market remains tight, which is expected to provide support to LME prices into Q1 2019. As mine supply picks up next year—provided smelters lift output to meet metal demand—CRU expects the refined metal market will return to balance in 2019, resulting in lower prices averaging $2,450 per ton for the year. As mine supply continues to build, concentrate stocks (and TCs) will continue to rise through to 2020, and surpluses will start to emerge in the refined metal market, as well. CRU expects that while zinc prices will come under pressure through the early 2020s, cost-related production cuts will be slow to materialize unless prices cut deep into the cost curve and will therefore provide only modest price support.
Copper won’t do more than drift in 2019 and there is downside risk. The copper price has found a new trading range, after undergoing a period of sharp volatility. Many of the copper price moves in 2018 were driven by macroeconomic concerns and investor activity, rather than fundamentals. CRU estimates there was a small surplus in the refined copper market in 2018, with another one expected for 2019. While Chinese copper demand has exceeded expectations in 2018, this looks unlikely to be repeated in 2019 in the context of economic rebalancing and heightened trade tensions. Few mine supply outages and strikes have had a limited impact on supply during 2018, but there have been significant copper smelter outages.
CRU forecasts that the copper price will increase from current levels next year and drift a little higher as 2019 progresses, driven higher by low visible stocks, mine cost inflation and a weakening U.S. dollar. CRU forecasts the LME 3M price will be a touch below $6,400 per ton in 2019.
Trade wars and sanctions hitting one the world’s largest aluminum producers, UC Rusal, overshadowed the aluminum market in 2018. This distracted some analysts and market watchers (not CRU) from the salient fact that the global aluminum market will fall into a substantial deficit of 2.2 million metric tons in 2018, increasing to 2.5 million tons in 2019.
Aluminum prices, however, fell in 2018, and with production costs rising, 60 percent of Chinese smelter production was loss-making in Q4 2018. CRU forecasts the LME 3-month price to average $1,950 per ton in 1Q19 as negative market sentiment persists. For the market to return to balance, world producers must increase profits, otherwise they won’t be able to increase output. CRU expects prices to rally through the latter part of 2019, and beyond, averaging $2,122 per ton for the year 2019.
Chinese production growth slowed sharply in 2018 due to reforms to supply policies together with market-driven closures. Chinese demand growth has slowed, too, as the country maintains the managed slowdown of its economy with less reliance on infrastructure and construction growth. Despite U.S. tariffs imposed on Chinese semis exports, China has increased its aluminum exports by over 20 percent year to date. The LME price has outperformed the Shanghai Futures Exchange price and the renminbi has weakened substantially, widening the export arbitrage.
The higher primary supply foretells of fresh lows for the lead price. Lead prices have struggled to recover, even touching new two-year lows below $1,900 per ton after a summer sell-off. Lead has continued to be pinned down more by wider metal price drivers and investor disinterest than any deterioration in industry fundamentals. Indeed, lingering lead concentrate market tightness, continuing Chinese lead market tightness and a seasonal upturn in lead demand should be lifting lead prices rather than just supporting them. Fresh Chinese smelter cuts, concerns over Nyrstar’s Port Pirie smelter and Recylex’s Nordenham smelter, and a thawing of U.S.-Chinese trade tensions seem most likely to provide a modest price lift during the 2018-19 northern-hemisphere winter.
Looking beyond the near-term, higher primary lead production will be the main bearish driver in the rest of 2019 and through 2020, pushing prices down to fresh lows. Alongside lower zinc prices, this will finally trigger polymetallic mine cuts to once again retighten the lead market in the early 2020s. CRU sees 2021 as the next turning point in the medium-term lead price cycle, but the next upside leg in prices will be modest and the 2022 high will mark another step down in the longer-term trend of successively lower peaks.
A fuller project pipeline undermined the nickel price outlook. The LME 3M nickel price remained under downward pressure to 4Q18, mainly because of investor concerns about the escalating trade spat over U.S.-Chinese trade tariffs, inflation, and slower economic and metals demand growth. Recent weak Chinese macroeconomic data and a stronger U.S. dollar have also contributed to the negative sentiment. This decline in prices comes despite continued deficits in the market.
CRU expects the market deficit for 2018 to reach 125,000 tons on lower supply, but the prospect of new high-pressure acid leaching (HPAL) capacity in Indonesia has curbed medium-term sentiment, and CRU understands that at least four Indonesian HPAL projects are being considered. The relatively low capital costs associated with the projects have come as a surprise. As a result of their research, CRU included additional HPAL capacity in its base case in the latter part of the forecast period.