Prices

December 22, 2018
Raw Material Prices: Iron Ore, Coking Coal, Pig Iron, Scrap and Zinc
Written by Peter Wright
Editor’s note: Steel Market Update is sharing the following Premium content with all its readers in this issue. For more information on how to upgrade to a Premium-level subscription, email info@SteelMarketUpdate.com.
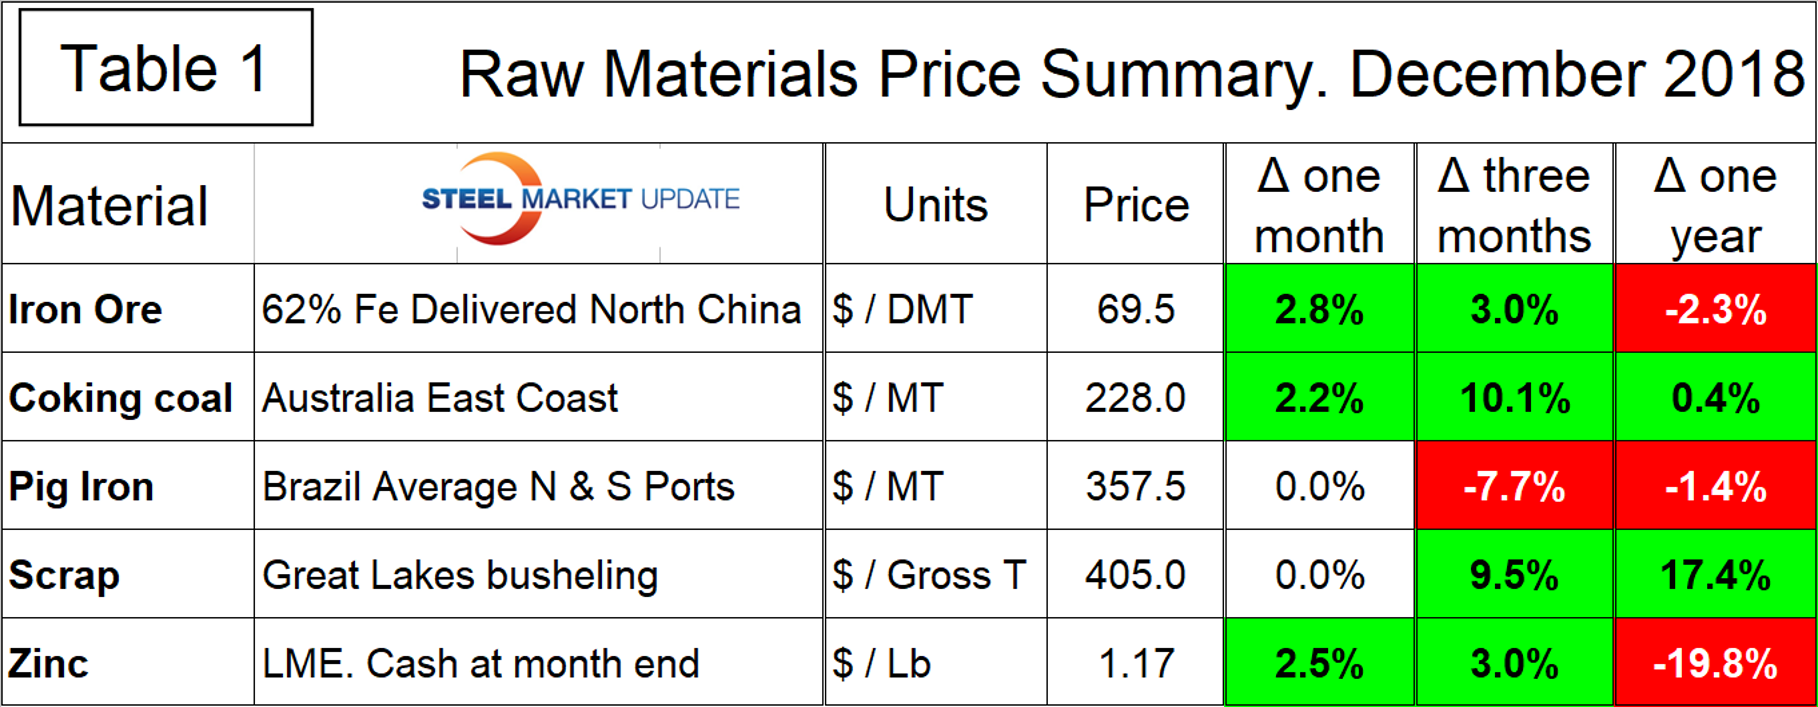
Table 1 summarizes the price changes through December of the five materials considered in this report. It reports the month/month, 3 months/3 months and 12 months/12 months changes and tells us that price movements have not been consistent across the five materials. In the last three months, coking coal and scrap have trended up the most, while pig iron has trended down. In the last month, pig iron and scrap have been unchanged.
Iron Ore
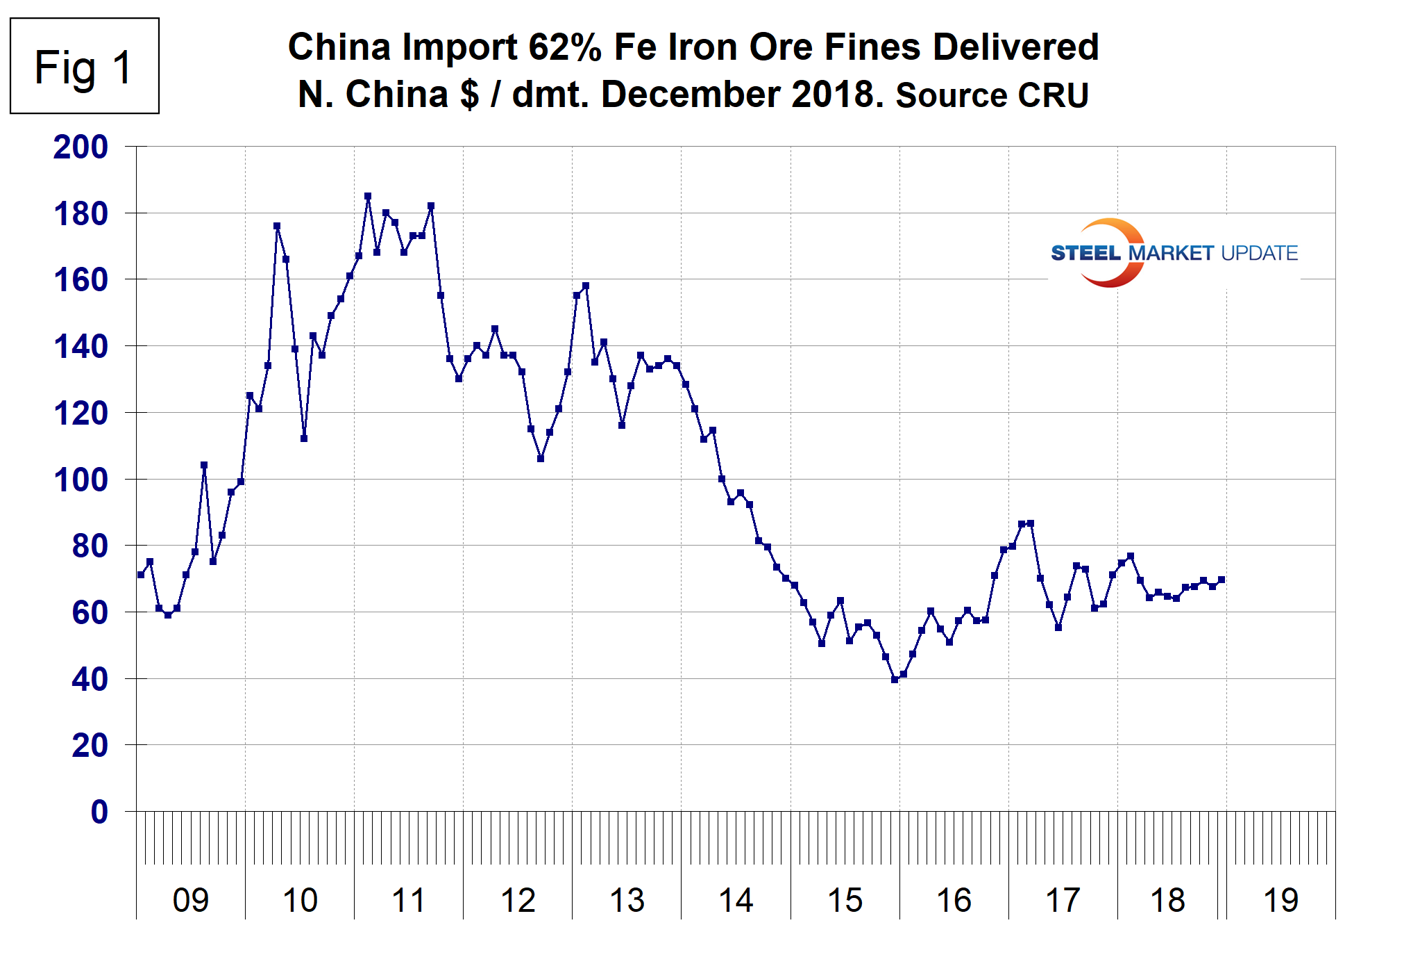
Based on CRU’s data, the weekly average spot price of 62% fines delivered North China was $69.50 per dry metric ton on Dec. 19. The price was up in one month and three months, but down year-over-year. Figure 1 shows the price of 62% Fe delivered North China since January 2009. Rio Tinto, the world’s second largest miner, is set to develop its most technologically advanced mine following the full approval of a $2.6 billion investment in the Koodaideri mine in Western Australia. The company stated that Koodaideri will be a new production hub for Rio Tinto’s world-class iron ore business in the Pilbara, incorporating a processing plant and infrastructure including a 166-kilometre rail line connecting the mine to the existing network. Construction will start next year with first production expected in late 2021. Once complete, the mine will have an annual capacity of 43 million metric tons, underpinning production of the Pilbara Blend, Rio Tinto’s flagship iron ore product.
Coking Coal
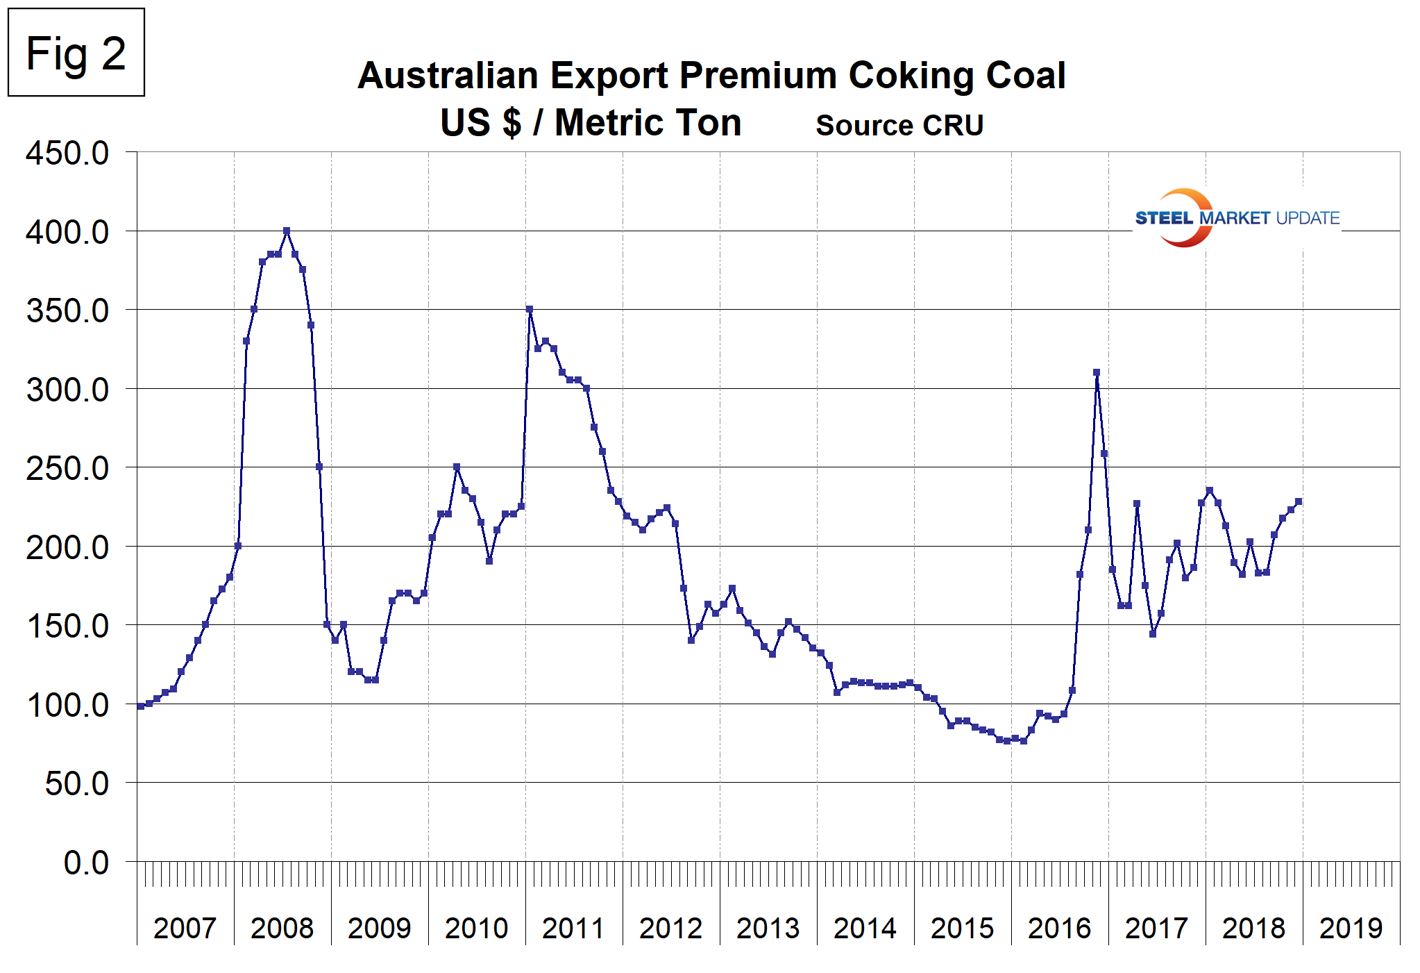
The price of premium low volatile coking coal FOB the east coast of Australia has risen for each of the last five months. From February 2016 to December 2016, the price more than quadrupled from $76 to $310 per metric ton. On Dec. 19, the price stood at $228 and has ranged between $144 and $235 per metric ton since January 2017 (Figure 2). Last week, Reuters reported: “Coal railway workers at Australian hauler Aurizon Holdings Ltd have postponed some planned strikes in Queensland as a cyclone is forecast to bring poor weather near some of the affected railways. Aurizon’s four major railways in the Bowen Basin of Queensland, the world’s largest coking coal export region, carry coal from mines owned by BHP Billiton, Glencore, Anglo American and Peabody Energy to ports on the country’s east coast. Bruce Mackie, the Queensland president of the Rail, Tram and Bus Union, which represents train crews and maintenance workers at Aurizon, said by phone that ‘We are delaying in the best interests of our members,’ citing their safety given the storm forecast.”
Pig Iron
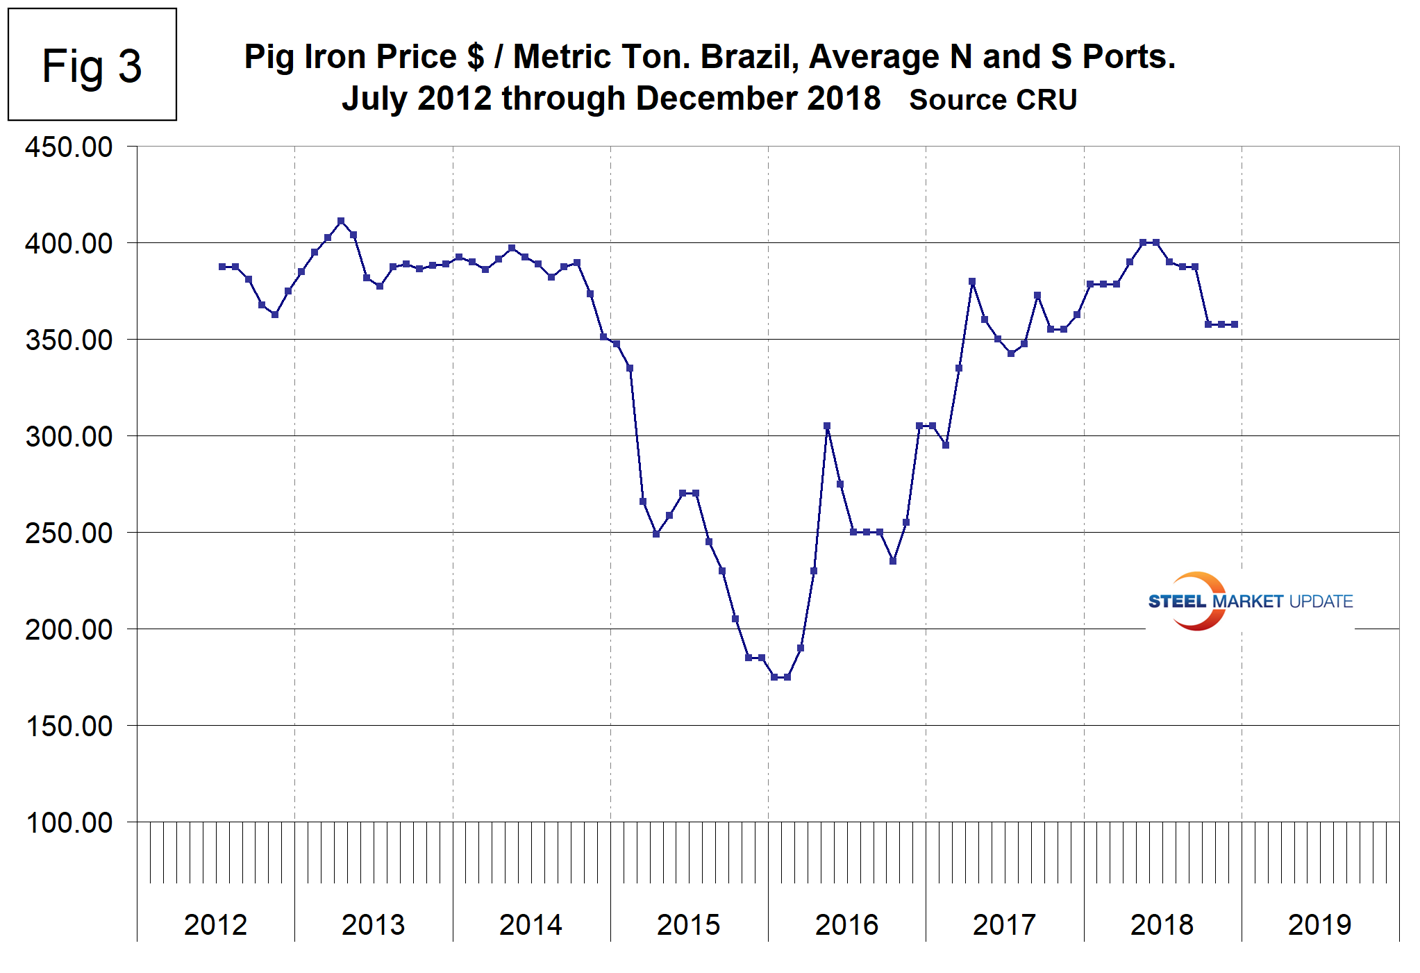
Most of the pig iron imported to the U.S. currently comes from Russia, Ukraine and Brazil with additional material from South Africa and Latvia. In this report, we summarize prices out of Brazil and average the FOB value from the north and south ports (Figure 3). The price steadily increased from the $175 low point in January and February 2016 to $400 in May and June 2018 before declining to $357.50 in October and being unchanged in November and December. The average price for the fourth quarter was down by 7.7 percent from the average of the third quarter.
Scrap
To put this raw materials commentary into perspective, we include here Figure 4, which shows the spread between busheling in the Great Lakes region and hot rolled coil Mid West U.S. through mid-December 2018, both in dollars per net ton. The spread has declined for four straight months to $379.39 in mid-December, but is still historically high and is up from $260.00 in June 2017.
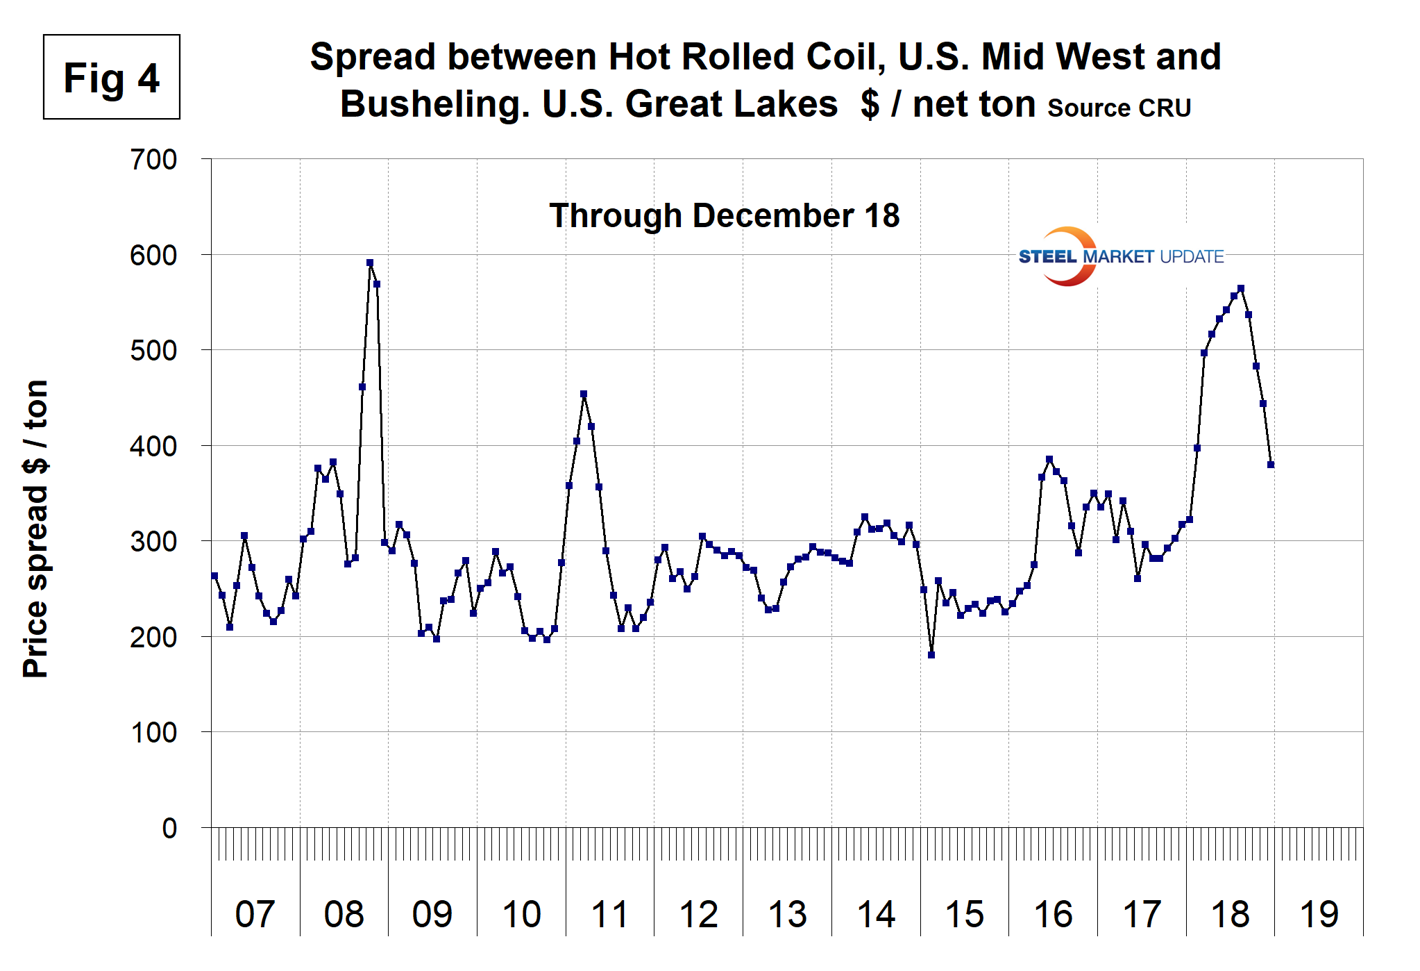
Figure 5 shows the relationship between shredded and busheling both priced in dollars per gross ton in the Great Lakes region. This spread was unchanged at $45 in December after increasing for six months. The busheling premium over shredded rose from $10 in April to $70 in October before declining to $45 in December.
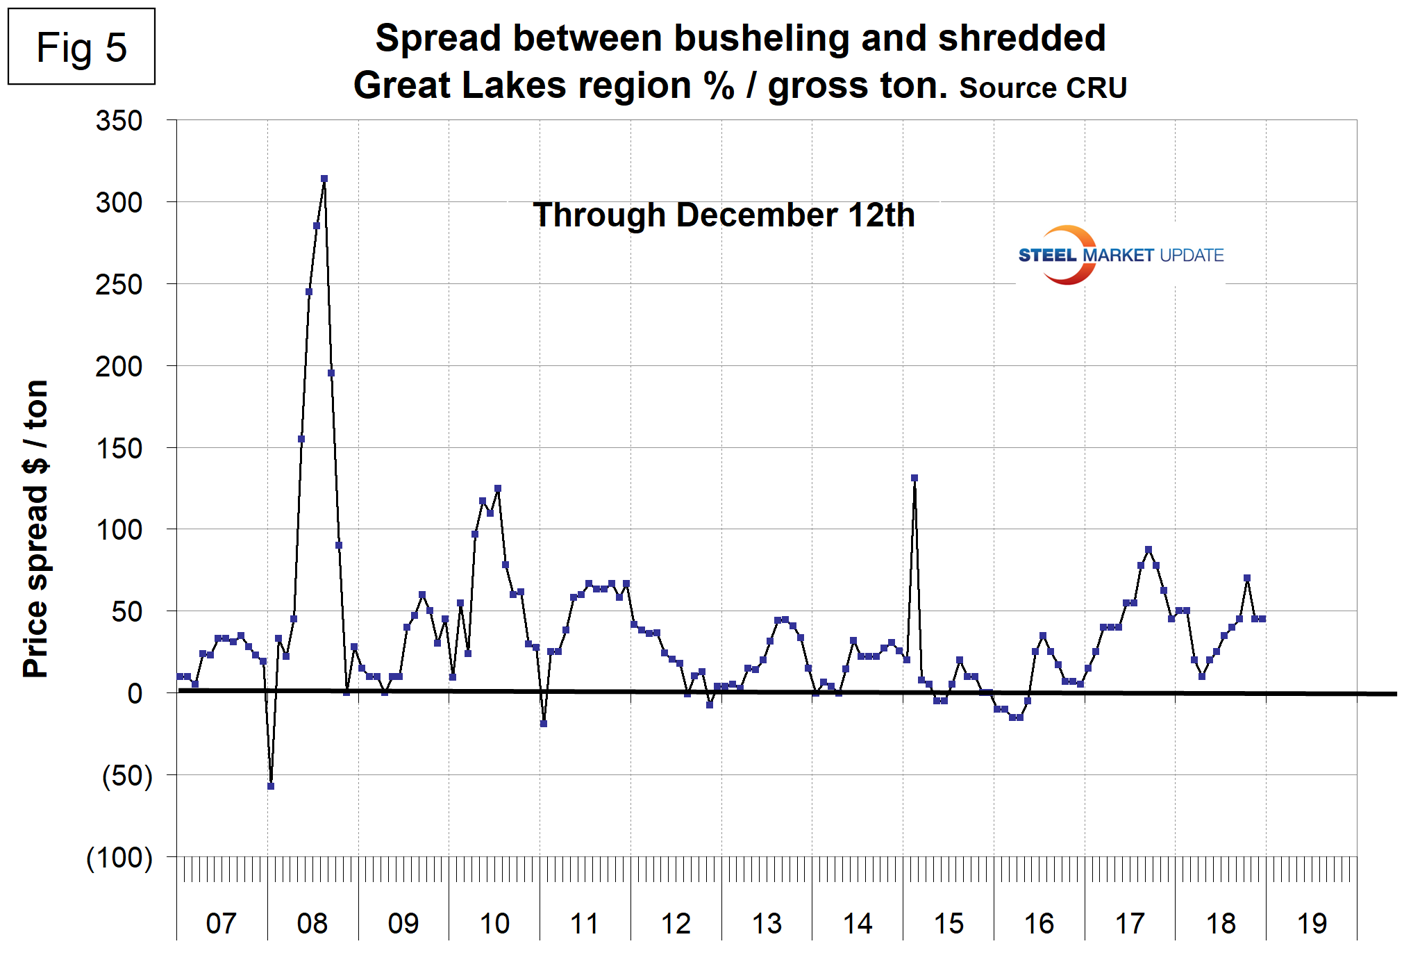
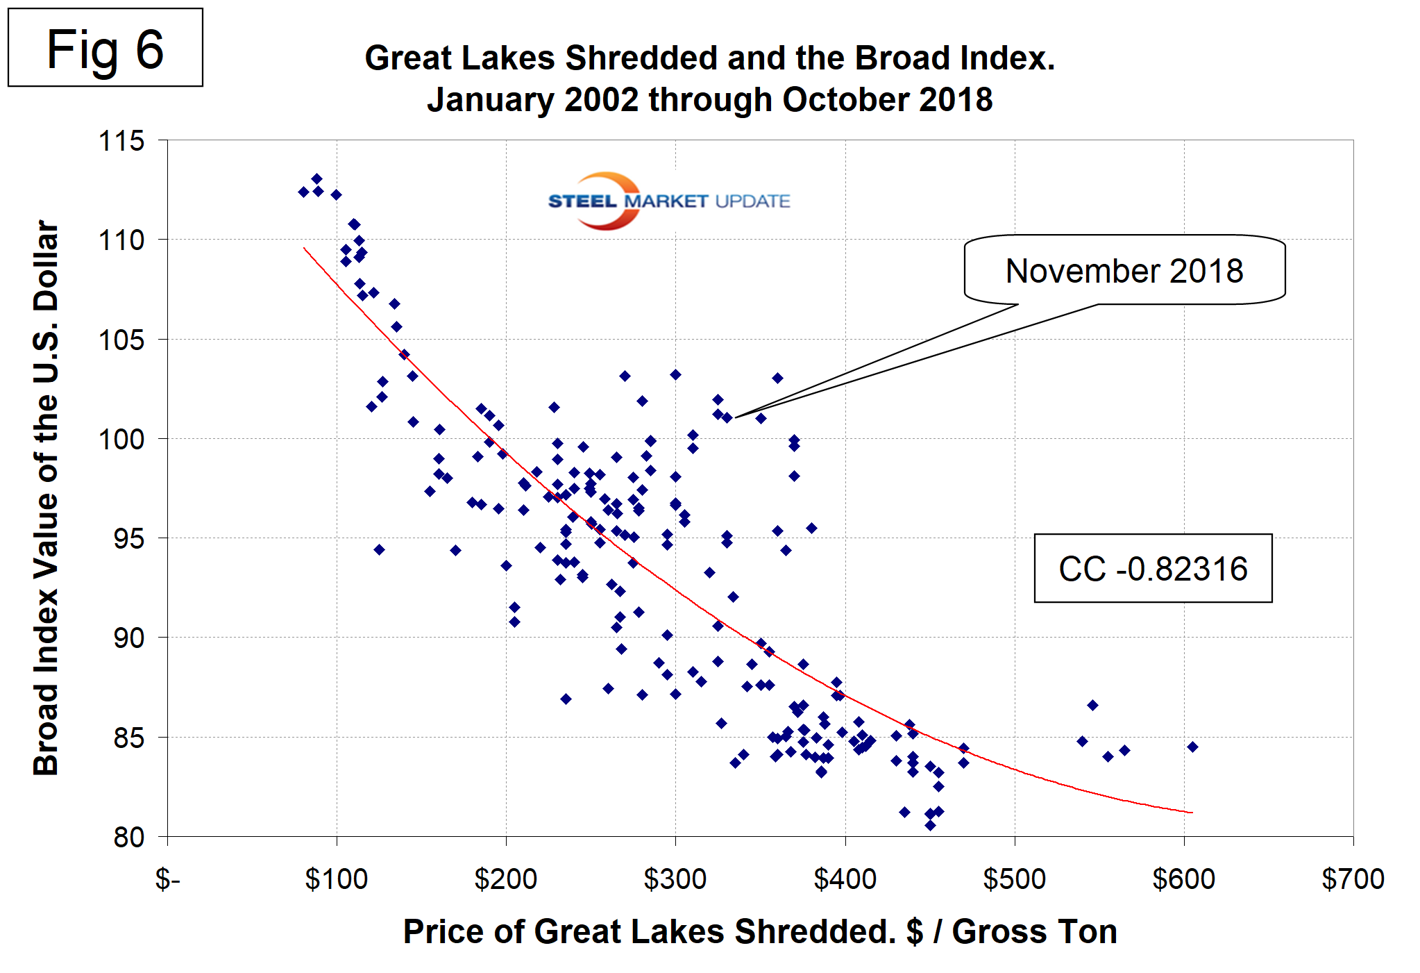
Figure 6 is a scatter gram of the price of Chicago shredded and the monthly Broad Index value of the U.S. dollar as reported by the Federal Reserve. The latest data for the monthly Broad Index was November. This is a causal relationship with a negative correlation of over 82 percent.
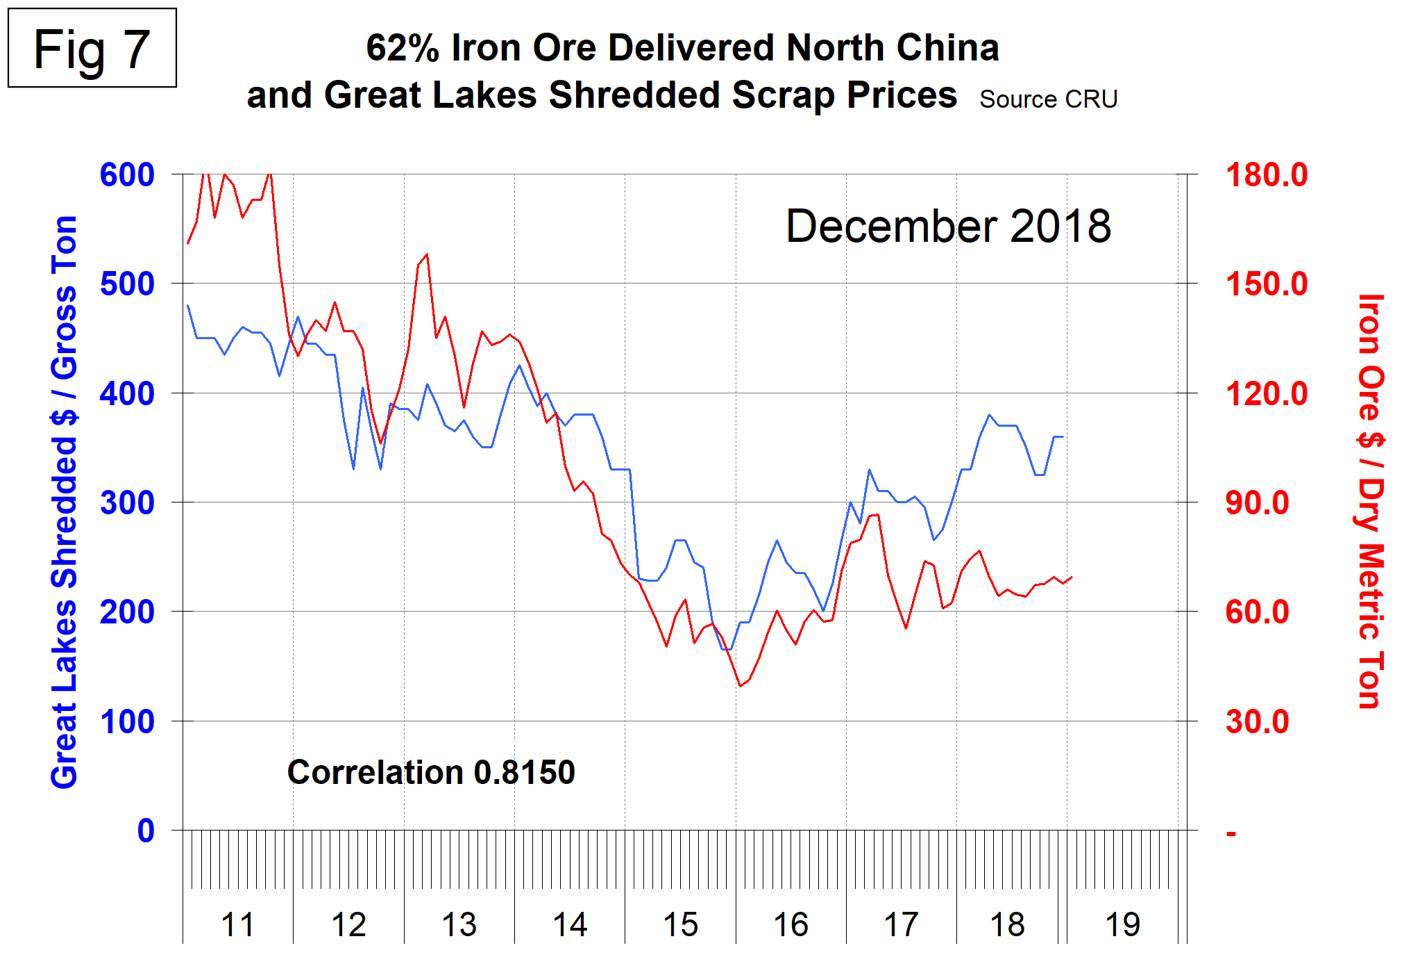
There is a long-term relationship between the prices of iron ore and scrap. Figure 7 shows the prices of 62% iron ore fines delivered North China and the price of shredded scrap in the Great Lakes region through mid-December 2018. The correlation since January 2006 has been 81.5 percent. There has been a very unusual divergence in these prices since Q2 2017.
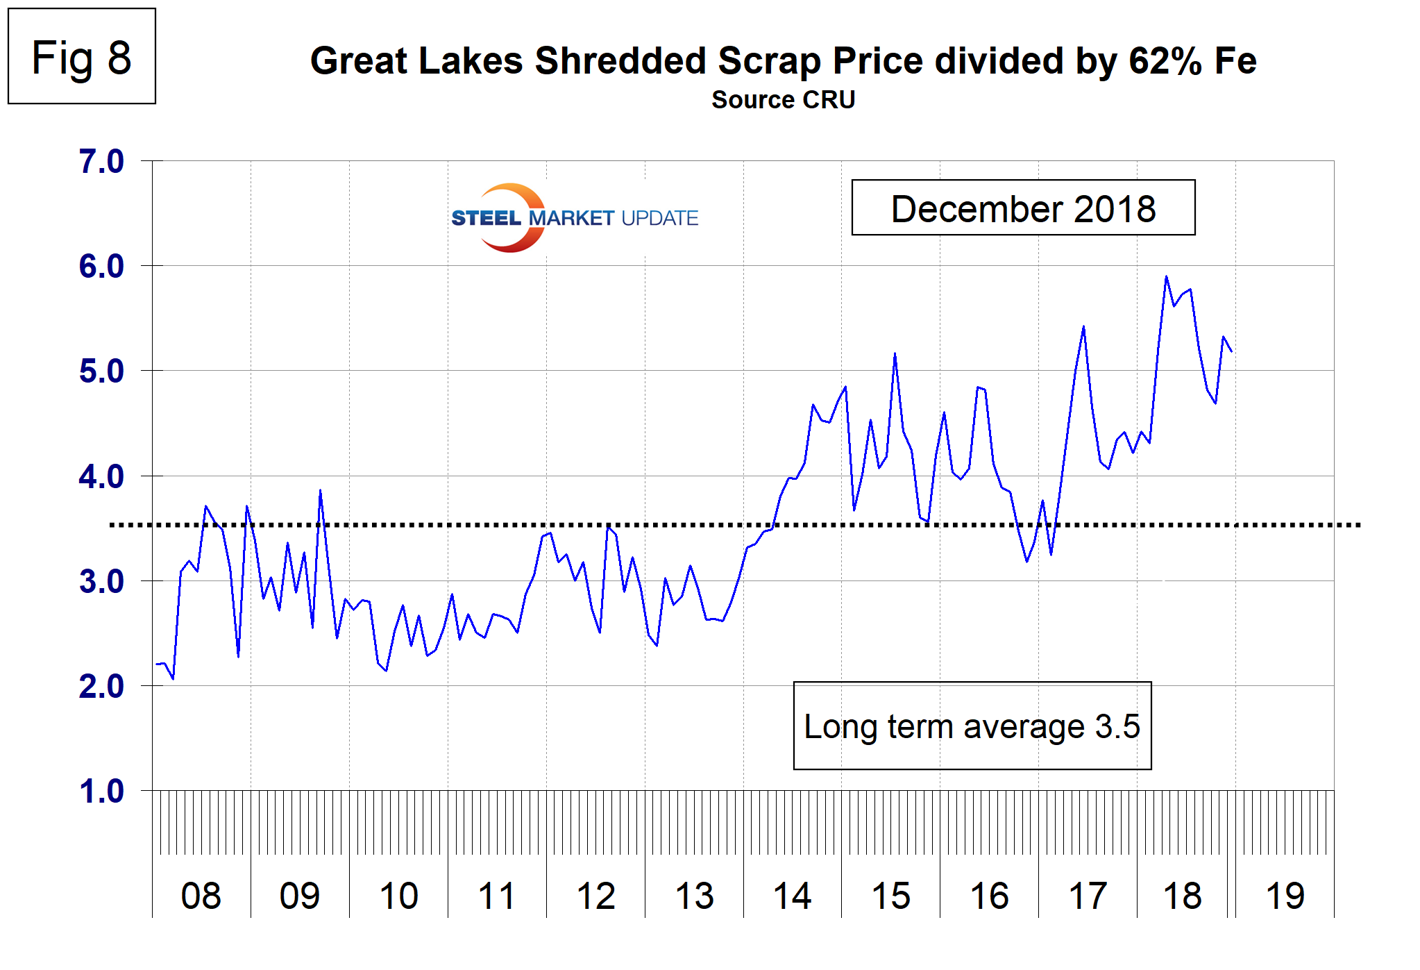
In the last 10 years, scrap in dollars per gross ton has been on average 3.4 times as expensive as ore in dollars per dry metric ton (dmt). The ratio has been erratic since mid-2014, but at 5.2 in December is highly beneficial to integrated producers (Figure 8). Since Chinese steel manufacture is 95 percent BOF, this ratio has allowed them to be more competitive on the global steel market. In the last four years, there have been times when China could supply semi-finished to the global market at prices competitive with scrap.
Zinc
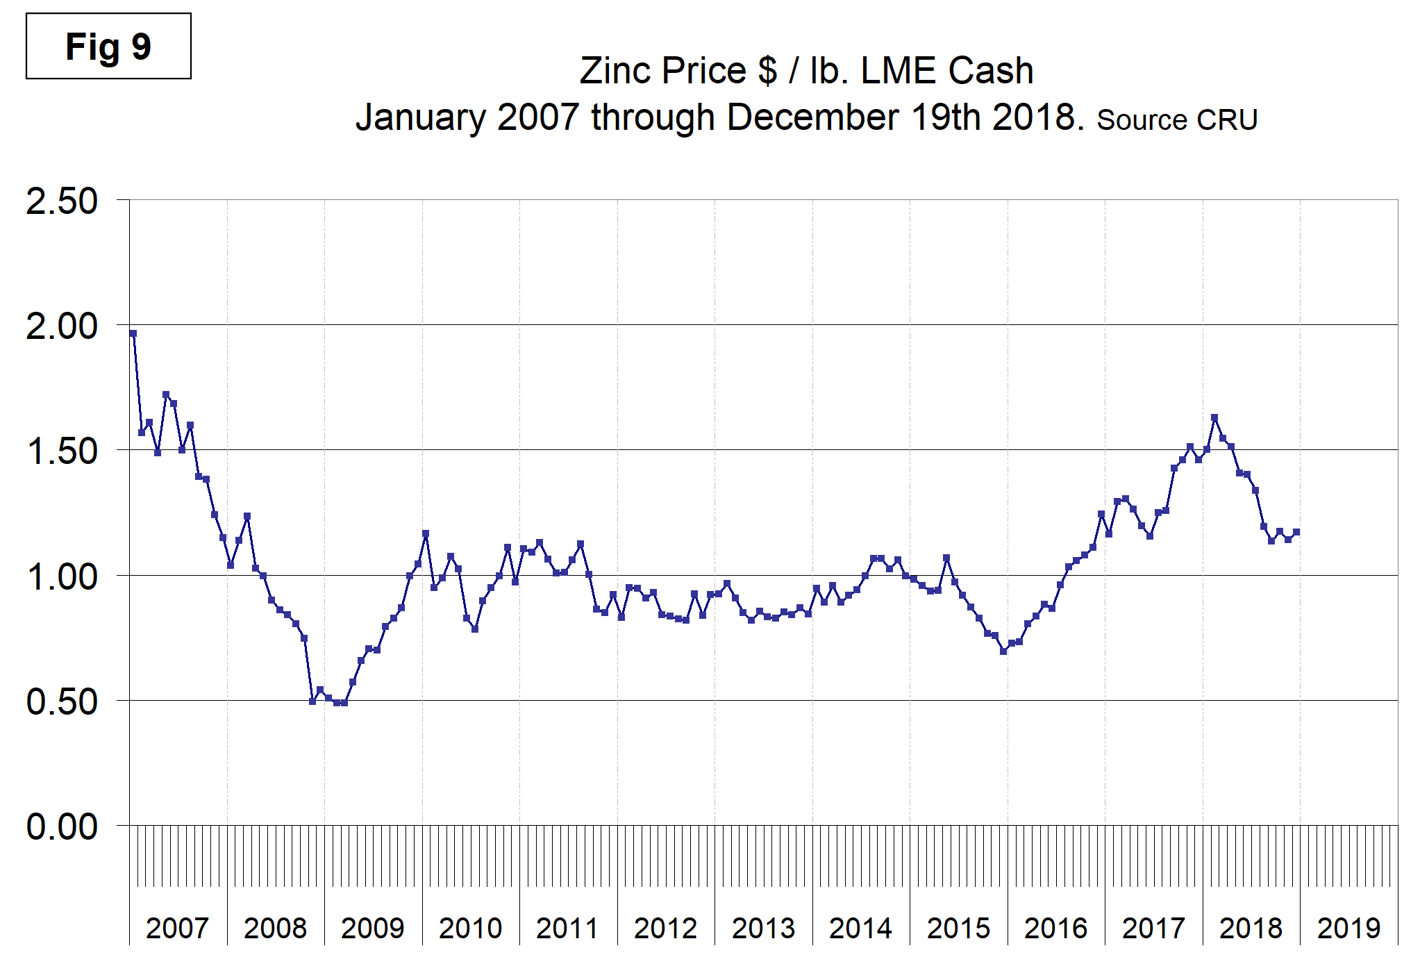
The LME cash price for zinc at the end of each month is shown in Figure 9. The latest data is for Dec. 19 when the price was $1.17 per pound, down from a high of $1.63 at the end of January. On Dec. 18, commodities analyst Andrew Hecht wrote: “As the end of 2018 approaches, the prices of all of the metals that trade on the London Metals Exchange were a lot closer to their lows for the year than the highs. The LME is the home of the most liquid forward contracts for copper, aluminum, nickel, lead, zinc, and tin. If the year ended Dec. 14, all six of the metals were at prices lower than at the end of 2017. While most commodities exchanges offer futures contracts, the LME trades forwards with the most liquid product the 90-day forward contract. The forwards provide producers and consumers of the metals the opportunity to make or take delivery each business day of the year, which offers more flexibility than the futures which settle on a monthly basis. A strong U.S. dollar, which is the pricing mechanism for most commodities including base metals, has weighed on the prices. The prospects for higher U.S. interest rates support the dollar, and it increases the cost of carrying inventories and long positions in the metals. The price of three-month zinc forwards has decreased during the course of 2018, falling from $3,350.50 to $2,515, a loss of $835.50 or 24.9 percent making zinc the worst performing base metal of the year, so far.”
Zinc is the fourth most widely used metal in the world after iron, aluminum and copper. Its primary uses are 60 percent for galvanizing steel, 15 percent for zinc-based die castings and about 14 percent in the production of brass and bronze alloys.
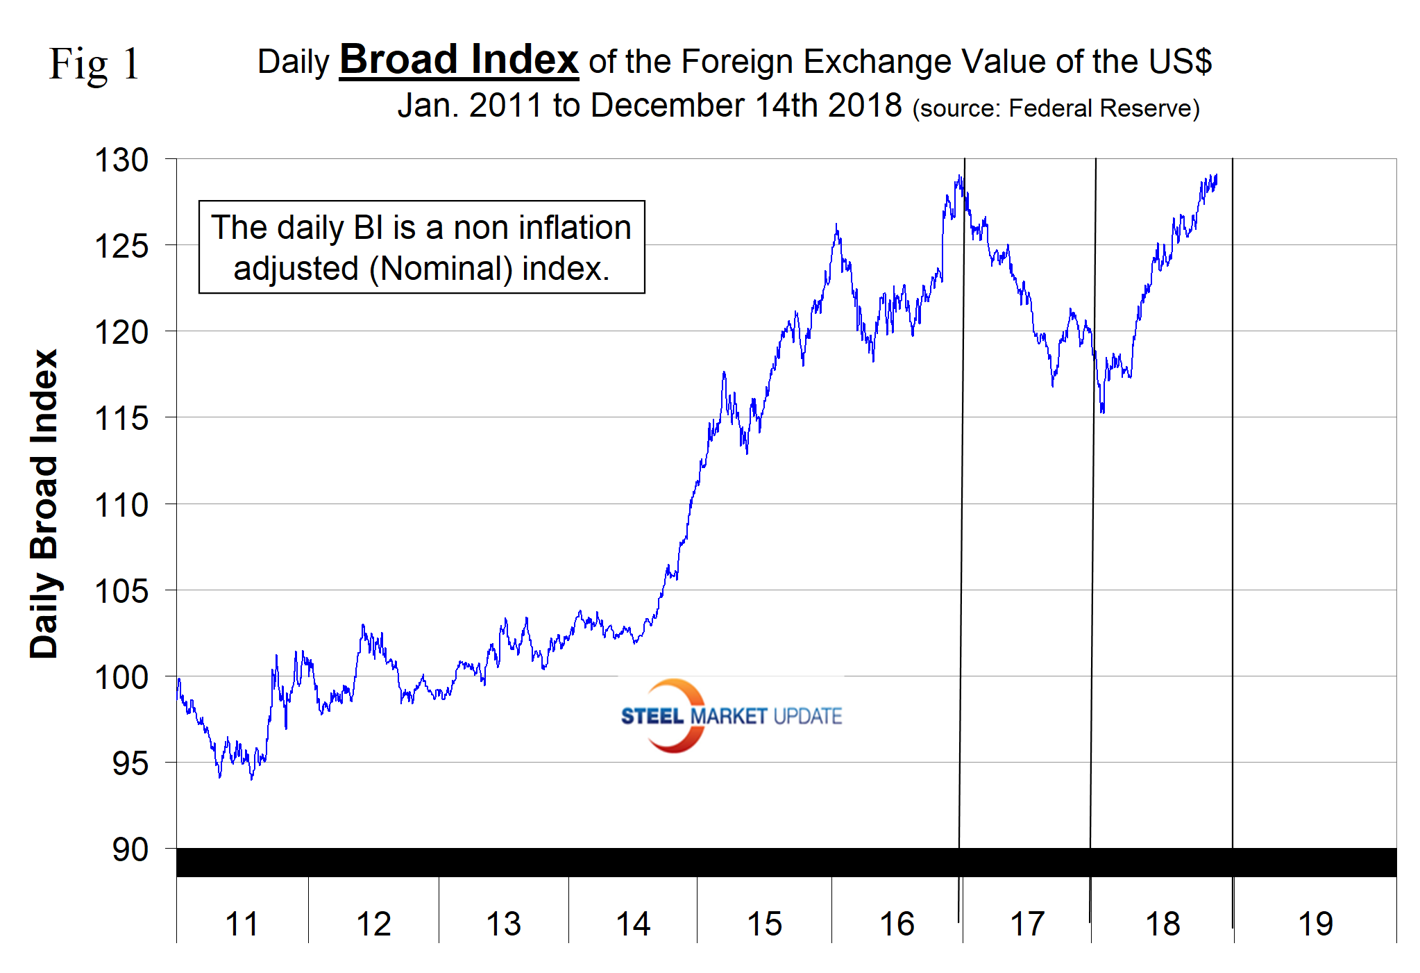
SMU Comment: There is an inverse relationship between commodity prices and the value of the U.S. dollar on the global currency markets. After falling for most of 2017 and through Feb. 1, 2018, the dollar has experienced a sharp upward revival and through Dec. 14 was up by 12.1 percent (see below). (Note, this is the daily index, which is not inflation adjusted. The monthly index mentioned above is inflation adjusted and isn’t updated until late the following month.) Supply and demand fundamentals are the primary drivers of raw materials prices, but a rising dollar acts as a headwind on the price of those global commodities that are priced in dollars. This effect is clearly shown by the relationship between scrap and the dollar index described above in Figure 6.
