Prices

December 20, 2018
HRC Futures: Break on Through to the Other Side
Written by David Feldstein
The following article on the hot rolled coil (HRC) futures market was written by David Feldstein. As the Flack Global Metals Chief Market Risk Officer, Dave is an active participant in the hot rolled futures market, and we believe he provides insightful commentary and trading ideas to our readers. Besides writing futures articles for Steel Market Update, Dave produces articles that our readers may find interesting under the heading “The Feldstein” on the Flack Global Metals website, www.FlackGlobalMetals.com. Note that Steel Market Update does not take any positions on HRC or scrap trading, and any recommendations made by David Feldstein are his opinions and not those of SMU. We recommend that anyone interested in trading steel futures enlist the help of a licensed broker or bank.
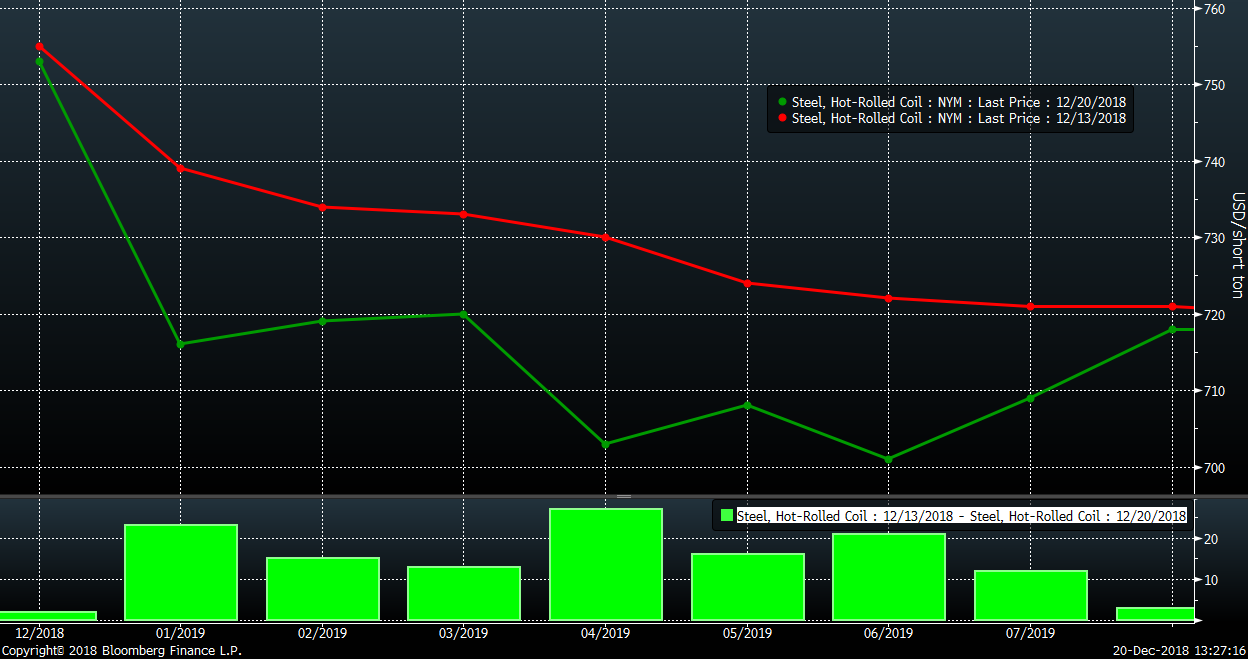
Hot rolled futures moved lower this week with the curve falling $10 to $25 per ton depending on the month.
CME Midwest HRC Futures Curve
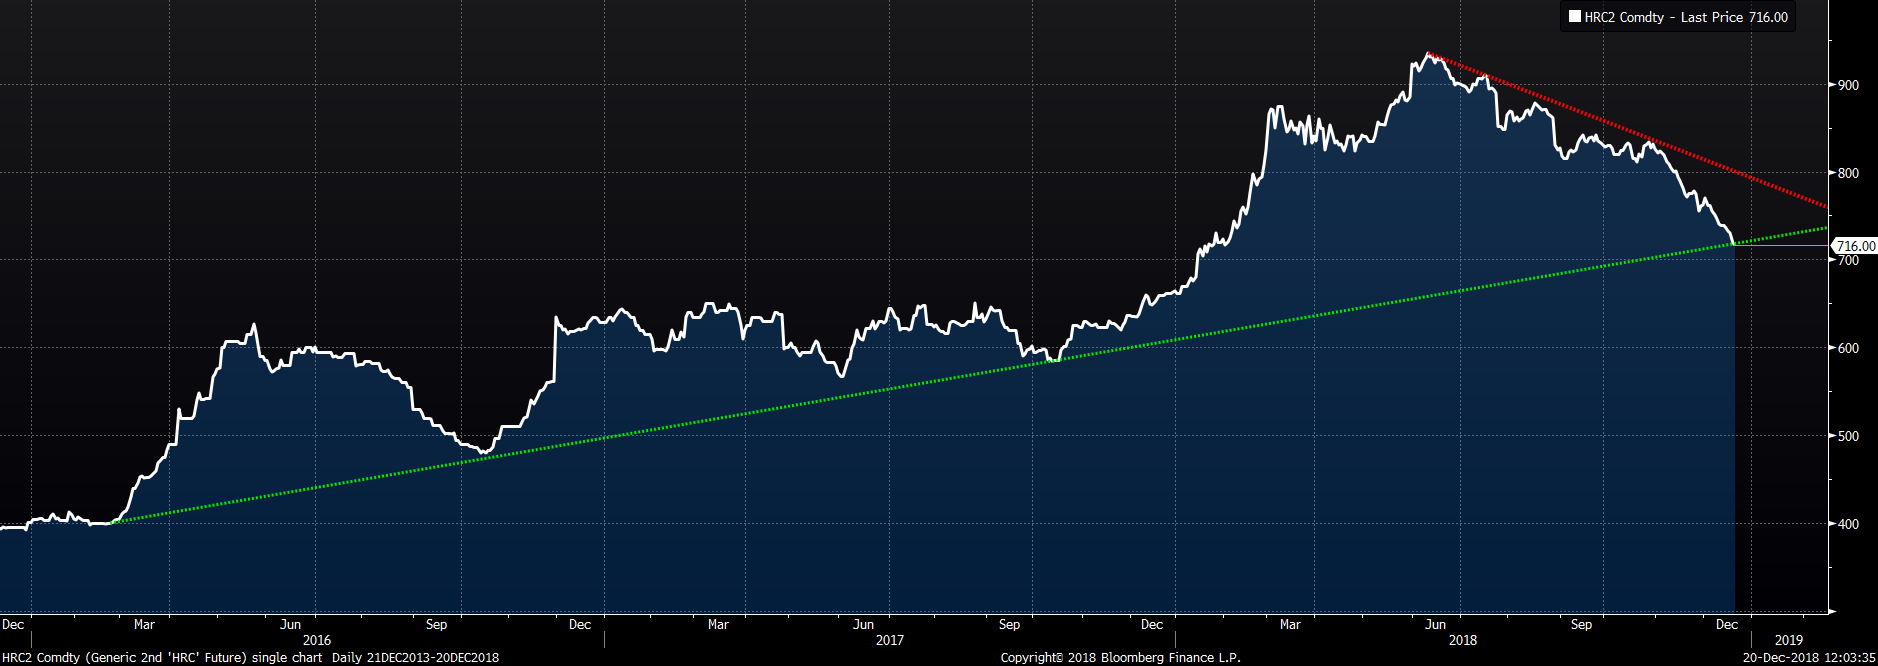
The rolling 2nd month CME Midwest HRC future, which is now January 2019, broke just below the long-term uptrend line that started in 2016 when it traded $716 earlier today.
Rolling 2nd Month CME Midwest HRC Future
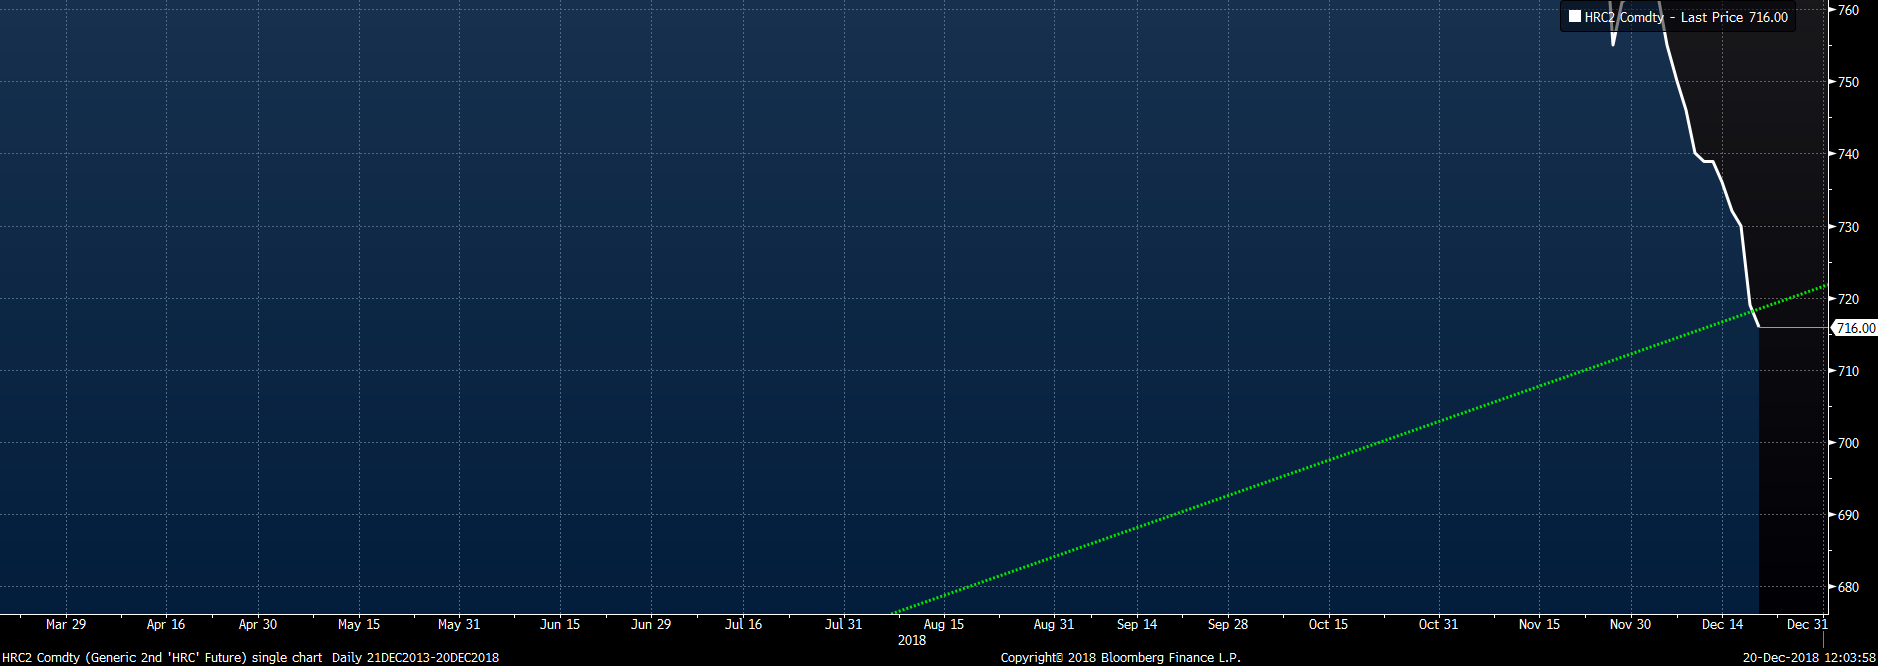
This chart zeroes in on the trend line break.
Rolling 2nd Month CME Midwest HRC Future
Yesterday, the rolling 3rd month CME Midwest HRC future, which is now February 2019, settled at $715, closing below its long-term trend line.
Rolling 3rd Month CME Midwest HRC Future
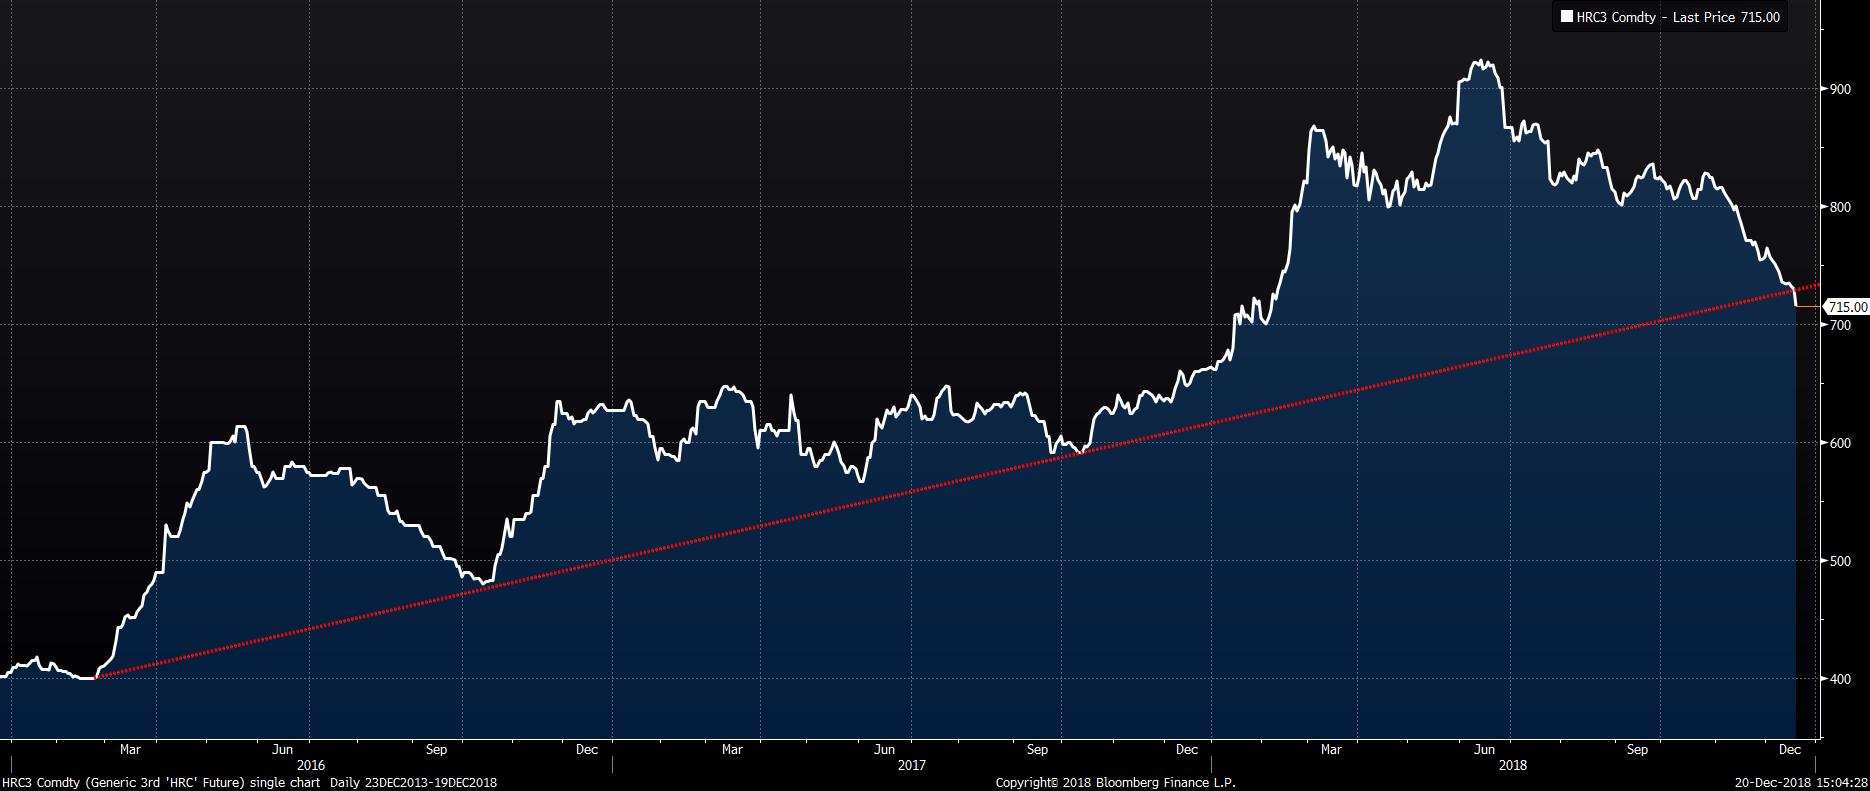
The more times a trend line is touched, the more “reliable” it is supposed to be, and the trendlines for both the 2nd and 3rd month HRC futures touch three times. Another important factor is the length of the trendline, which in this case is almost three years. Keep in mind that at this point the line has just been pierced. If it trades to the downside with heavy volume and momentum, then expect a sharp move lower.
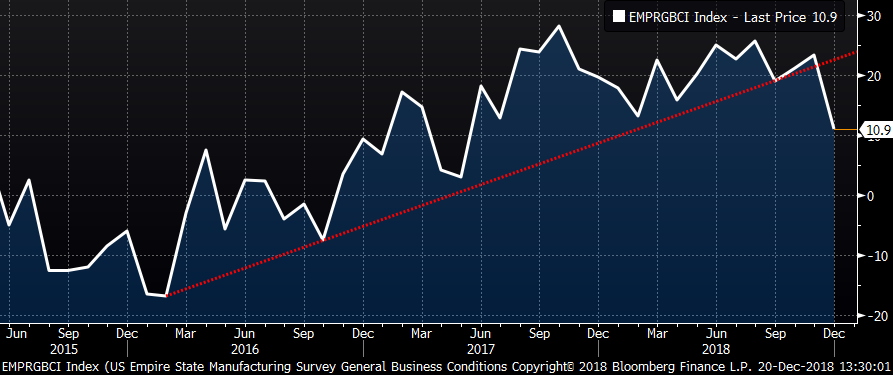
HRC futures and flat rolled prices are not falling in isolation. If you read last week’s SMU article or the latest WoW report, you will see a similar pattern of sharp breaks lower through long-term uptrends across a diverse set of economic data, commodity prices, stock market indices, rates, etc. This week the Empire Manufacturing Index was the latest example of this phenomenon as it fell 12.4 points to 10.9, while missing expectations of a slight fall to 20.
Empire Manufacturing Index
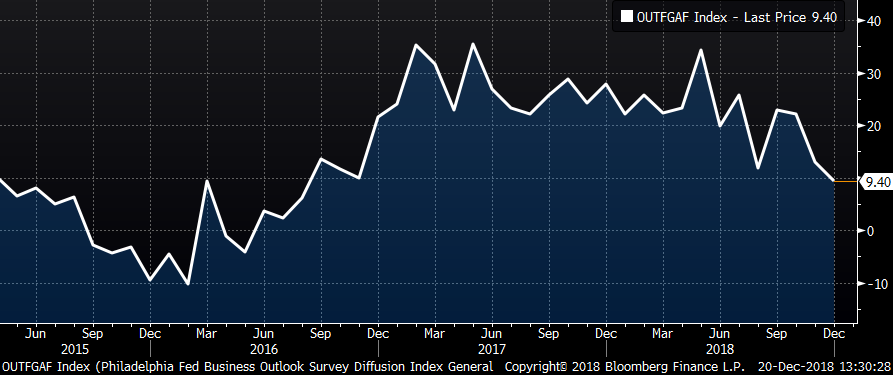
Today, the December Philadelphia Fed Business Outlook Index fell 3.5 points to 9.4, badly missing expectations of a gain to 15. This is the lowest level the index has been at since August 2016.
Philadelphia Fed Business Outlook Index
The steel industry is going on holiday and new orders will effectively grind to a halt tomorrow at 5 p.m. Over the next week, these regional manufacturing reports will be released.
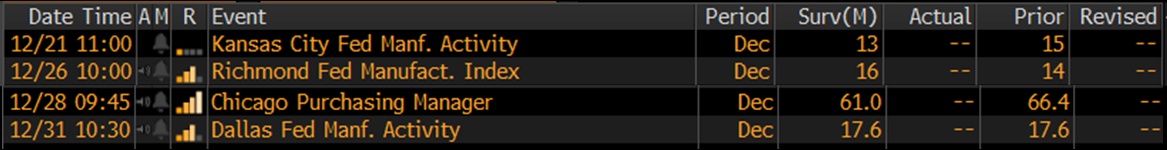
The K.C. and Dallas Fed regions are heavily dependent on the energy industry. Considering the price of crude oil has continued to make new lows trading as low as $45.67/bbl, it is safe to assume they will at best be flat if not lower. The Chicago PMI is expected to fall based on Bloomberg’s current survey of economists. This all leads us to the ISM Manufacturing PMI to be released on Jan. 3.
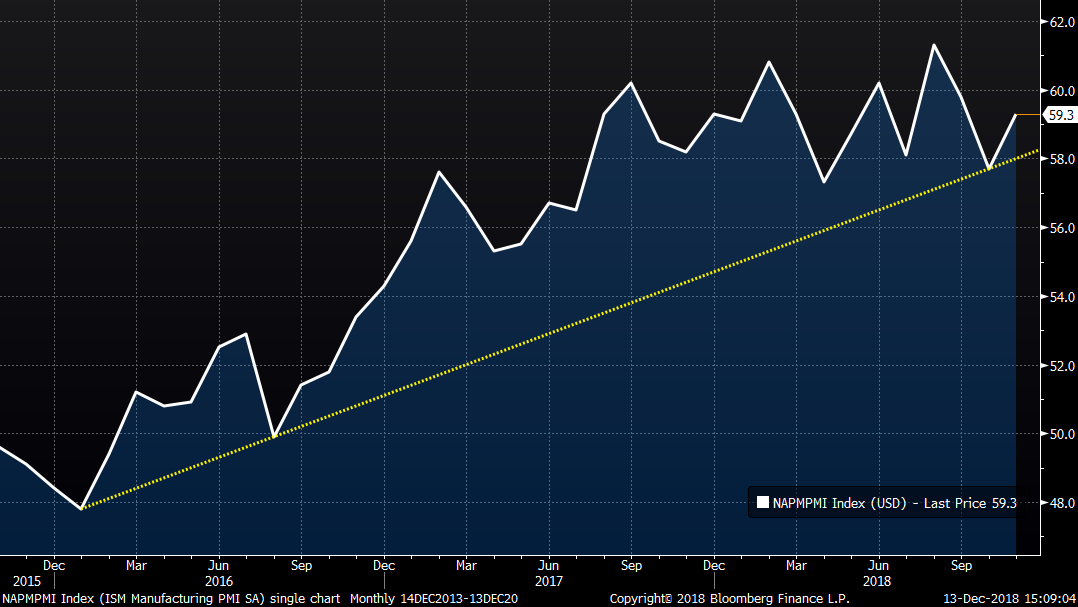
If there is an abrupt drop in the ISM Manufacturing PMI below 58, then this will be the latest chart to have replicated this pattern, and this would be a horrible development for the steel industry. As goes the ISM, so goes the price of HRC.
ISM Manufacturing PMI
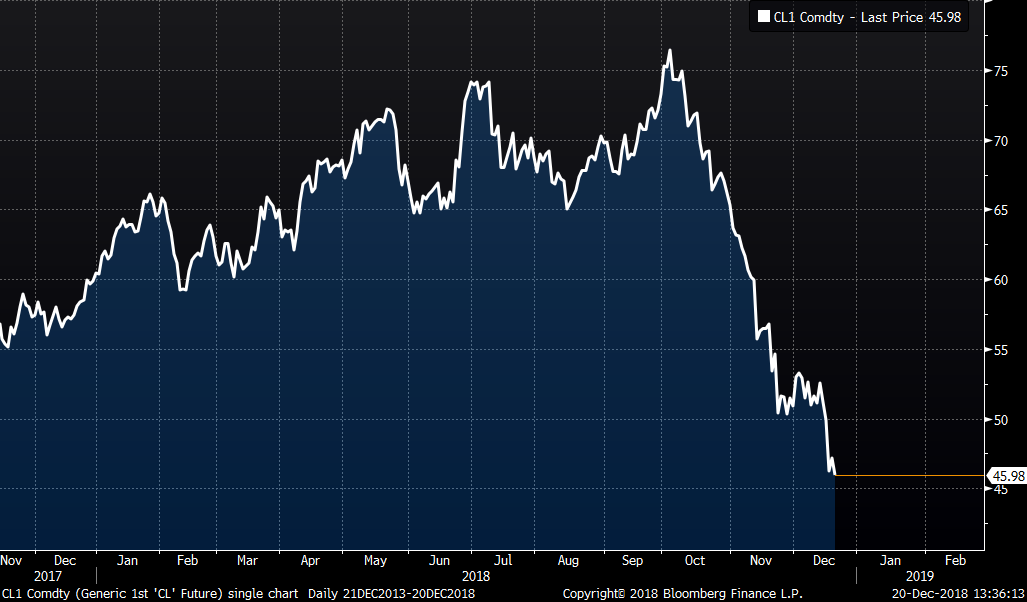
The front month CME WTI crude oil future took a leg lower falling below $46/bbl. This keeps getting worse.
Front Month CME WTI Crude Oil Future
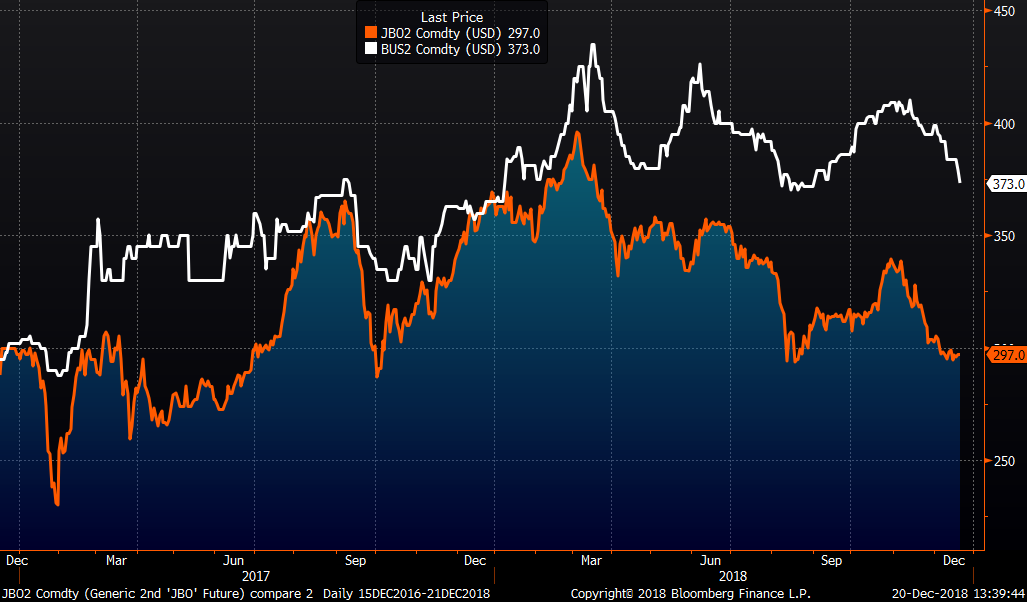
Busheling futures fell this week, while LME Turkish scrap has traded mostly flat.
2nd Month CME Busheling Future & 2nd Month LME Turkish Scrap Future
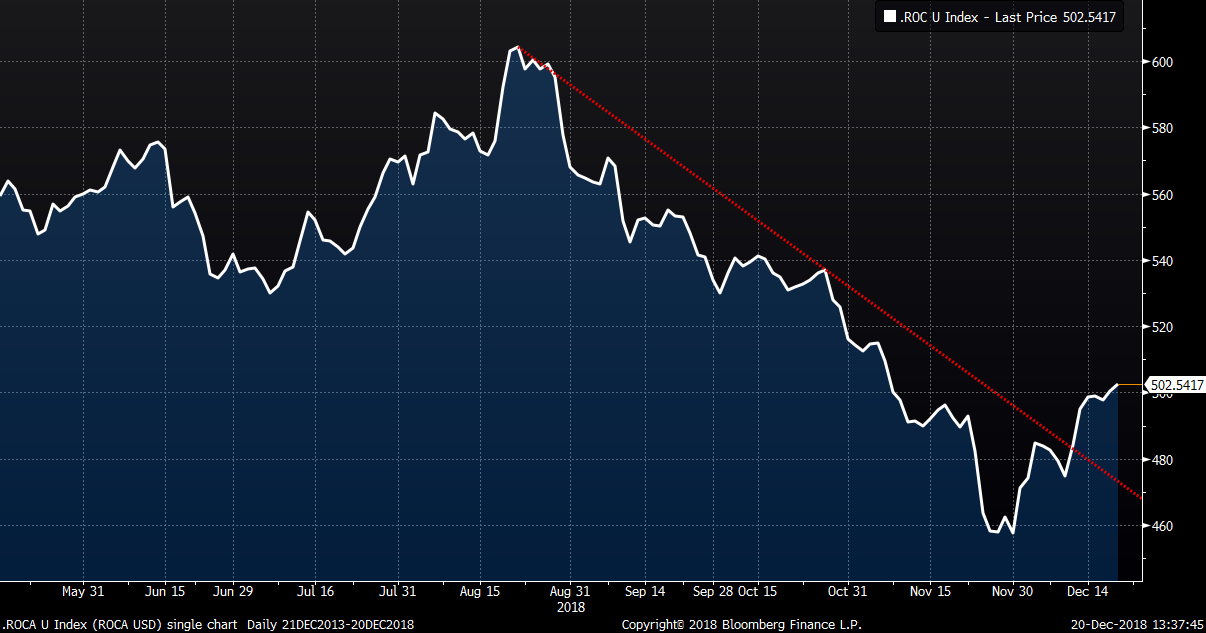
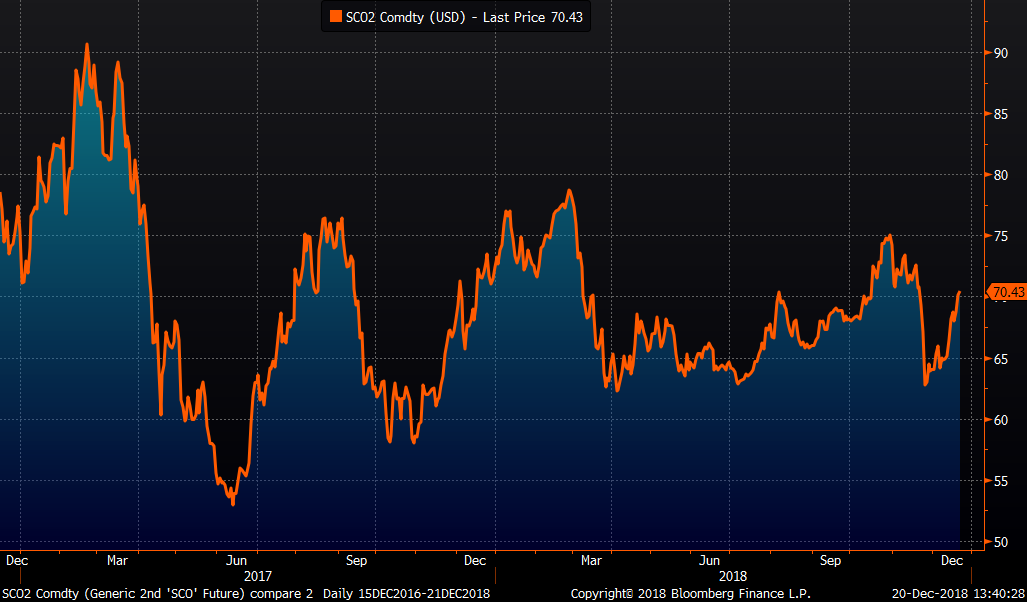
The lone bright spot comes from Asia where iron ore prices continue to rally…
2nd Month Iron Ore Future
…as well as Chinese HRC futures.
May Shanghai Chinese HRC Future (yuan)