

Market Data

December 17, 2018
Total Steel Supply by Product through October
Written by Peter Wright
Demand for long products is booming, plate products are doing OK, sheet products are flat and tubulars are cratering. This analysis by SMU staff is based on data from the American Iron and Steel Institute (AISI) and the U.S. Department of Commerce (DoC).
The analysis summarizes total steel supply by product from 2003 through October 2018 and year-over-year changes. The supply data is a proxy for market demand, which does not take into consideration inventory changes in the supply chain. Our analysis compares domestic mill shipments with total supply to the market. It quantifies market direction by product and enables a side-by-side comparison of the degree to which imports have absorbed demand.
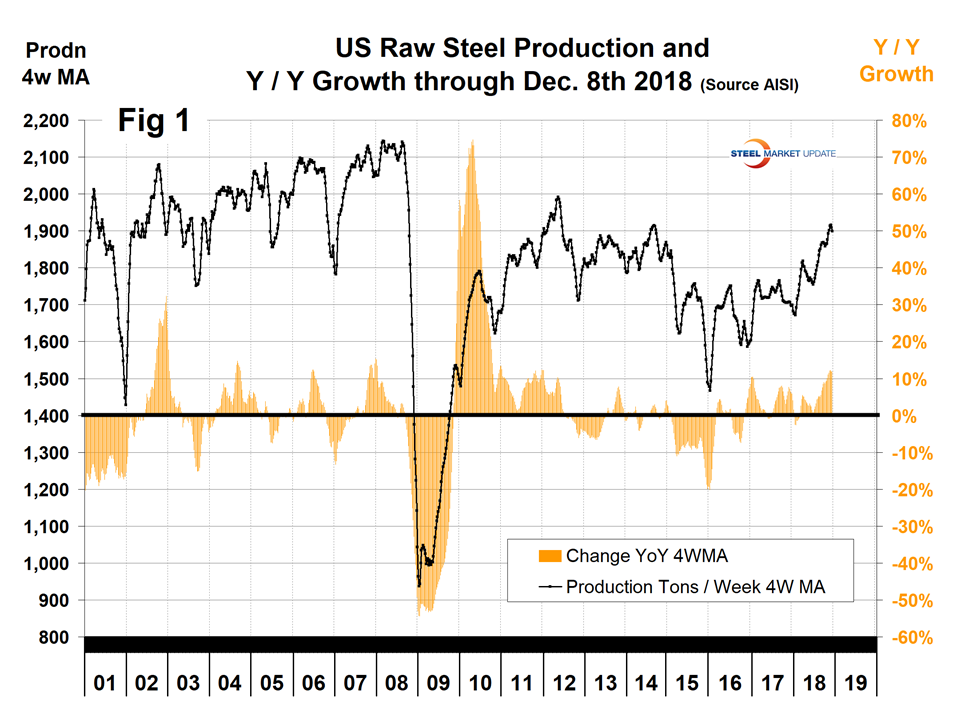
Figure 1 shows robust growth of U.S. raw steel production through Dec. 8. This is a four-week moving average and is based on weekly data from the AISI.
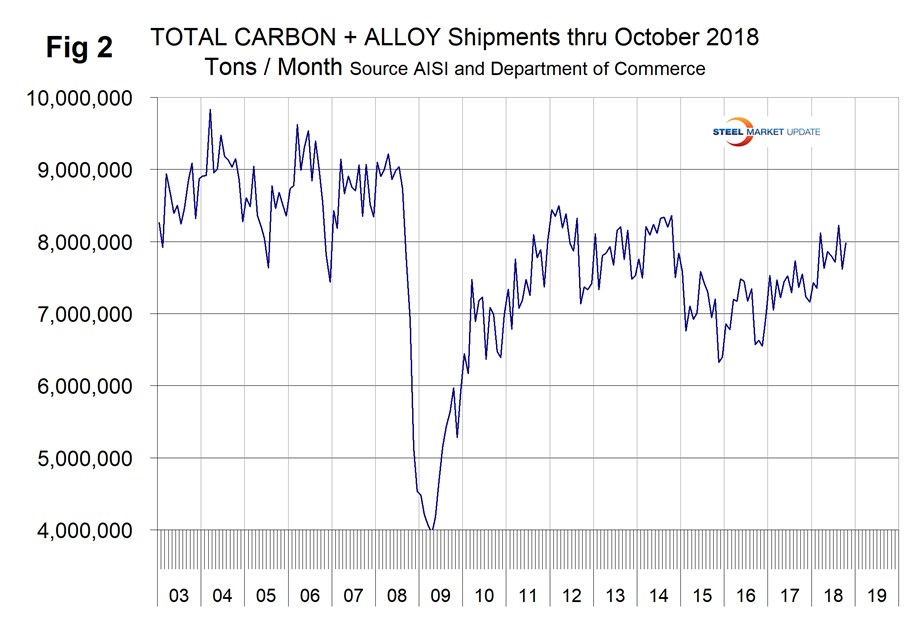
The shipments and supply report that you are reading now is based on monthly shipments by product as reported by the AISI plus import and export data from the DoC. Figure 2 shows the monthly shipment data for all rolled steel products. The trajectories of growth in Figures 1 and 2 are basically the same.
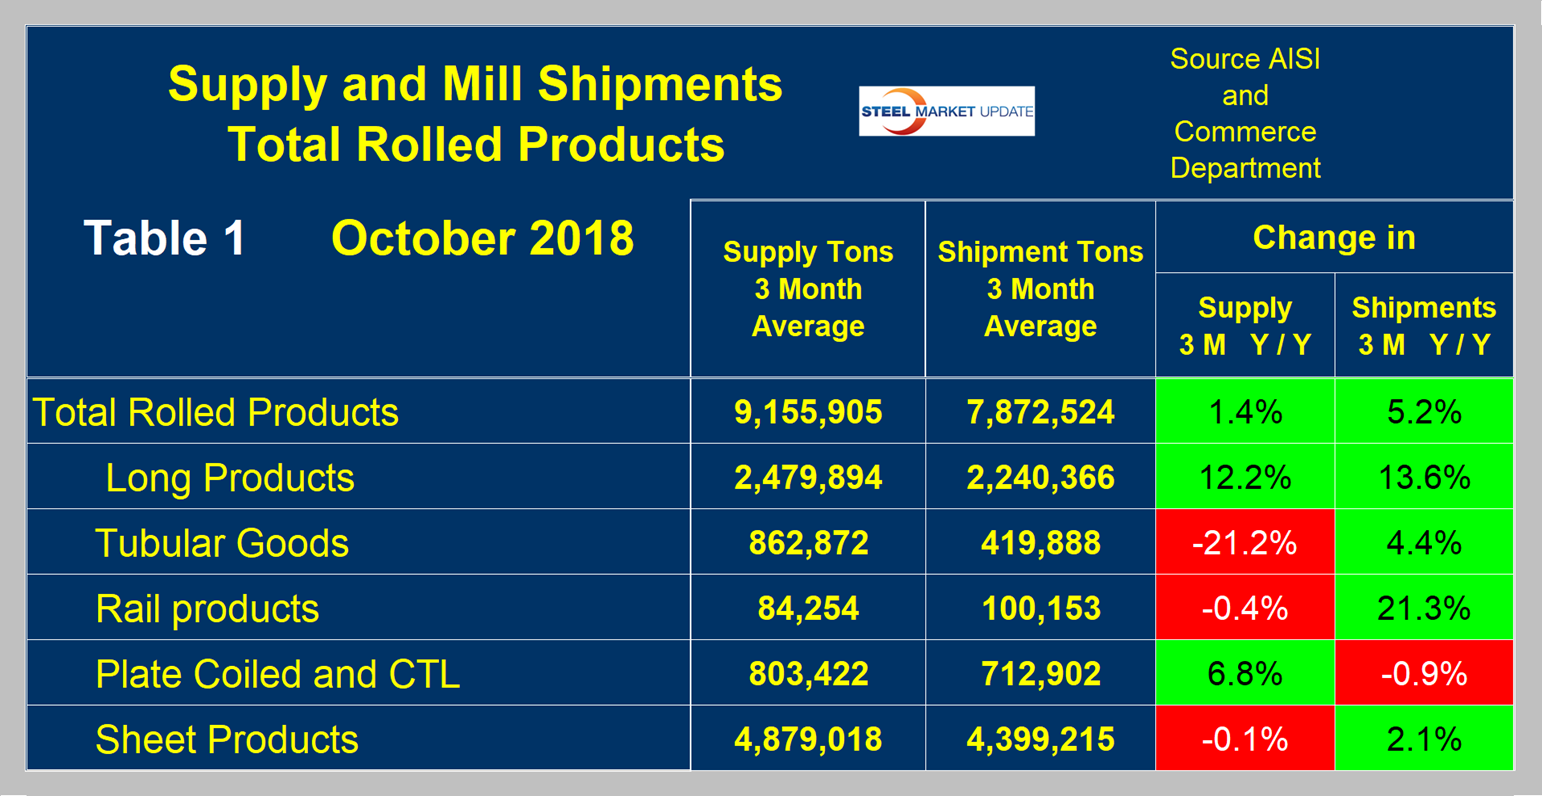
First, though, we will look at the shipment and supply situation for all product groups to see how much difference there is between them. Table 1 is this compilation. Total supply (proxy for market demand) as a three-month moving average (3MMA) was up by 1.4 percent year over year and mill shipments were up by 5.2 percent, meaning that imports took a much smaller share year over year. However, there is a big difference between products. In the supply column, long products fared best with a supply growth of 12.2 percent and tubulars did worst with a contraction of 21.2 percent. The supply of sheet products in total increased by only 0.1 percent. The shipment column is quite different with a total year-over-year increase of 5.2 percent, but in this case total plate products did a reversal from positive supply to negative domestic mill shipments, and tubulars reversed from negative supply to positive mill shipments. These gyrations are a result of changes in import market share by product, which we describe in a separate report.
Now let’s look at sheet products in detail. One consideration is that demand in October has on a nine-year historical average been up by 1.5 percent from September. This year, October was up by 2.9 percent, therefore a little better than normal. Figure 3 shows the seasonality that has existed since January 2010.
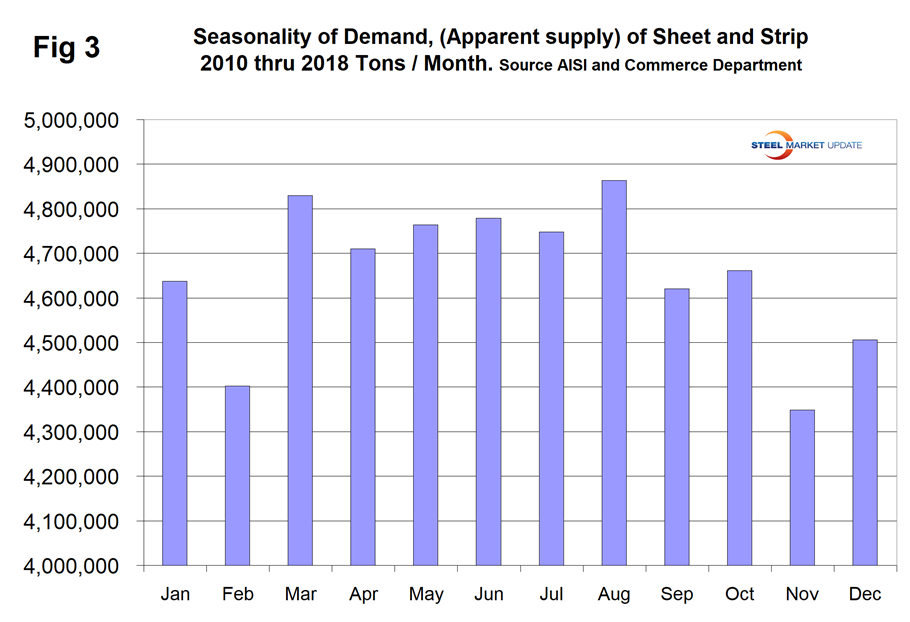
Table 2 describes both apparent supply and mill shipments of sheet products (shipments includes exports) side by side as three-month averages through October with year-over-year growth rates for each. Comparing the year-over-year time periods, total supply to the market decreased by 0.1 percent and mill shipments increased by 2.1 percent. Table 2 breaks down the total into product detail and shows that imports were more of a factor for HR and less for CR and other metallic coated.
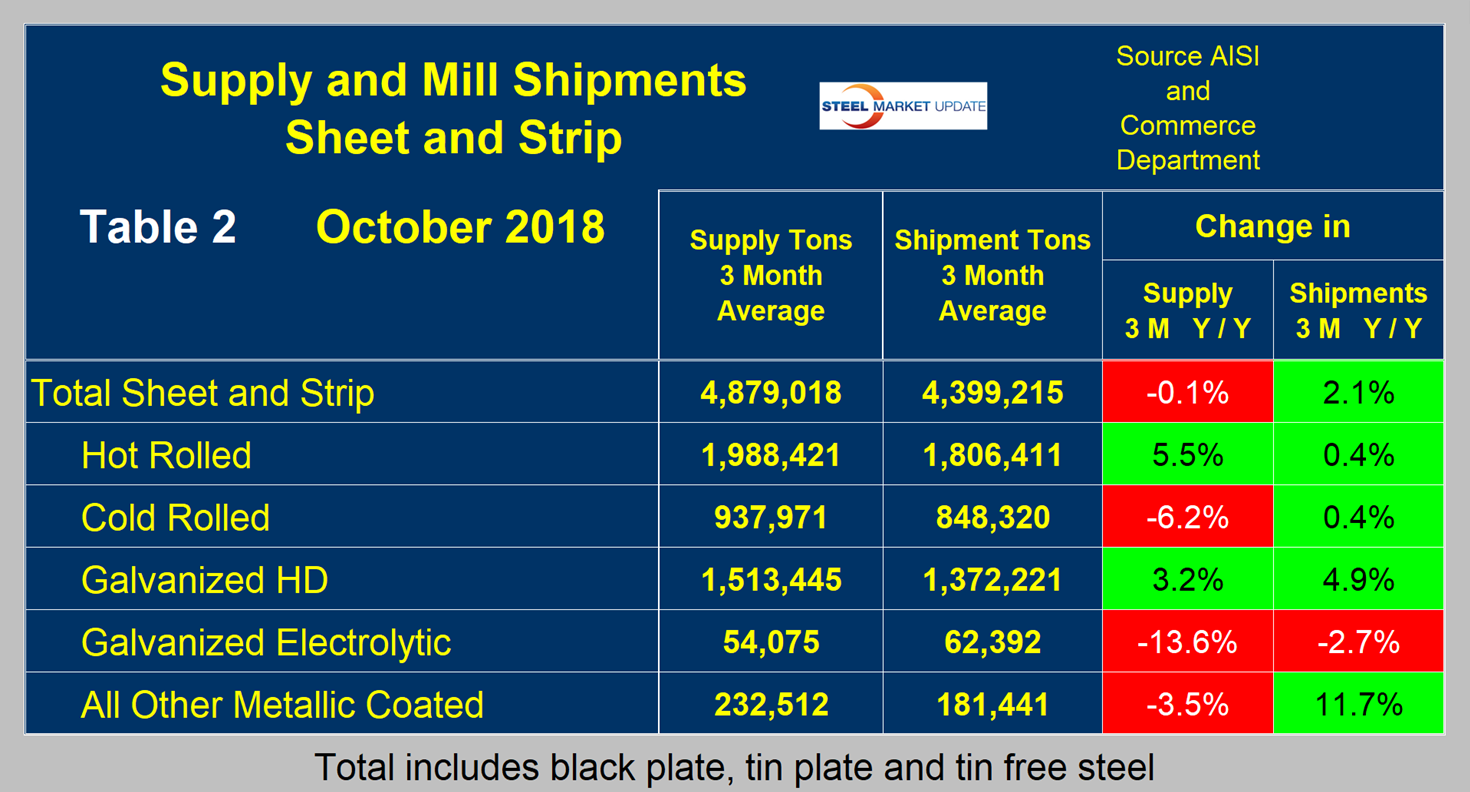
A review of supply and shipments separately for individual sheet products is given below.
Apparent supply is defined as domestic mill shipments to domestic locations plus imports. In the three months through October 2018, the average monthly supply of sheet and strip was 4.879 million tons, down by 0.5 percent year to date and by 0.1 percent comparing three months through October year over year. There is no seasonal manipulation of any of these numbers. By definition, year-over-year comparisons have seasonality removed, but 3M/3M comparisons do not. Table 3 shows the change in supply by product on this basis through October.
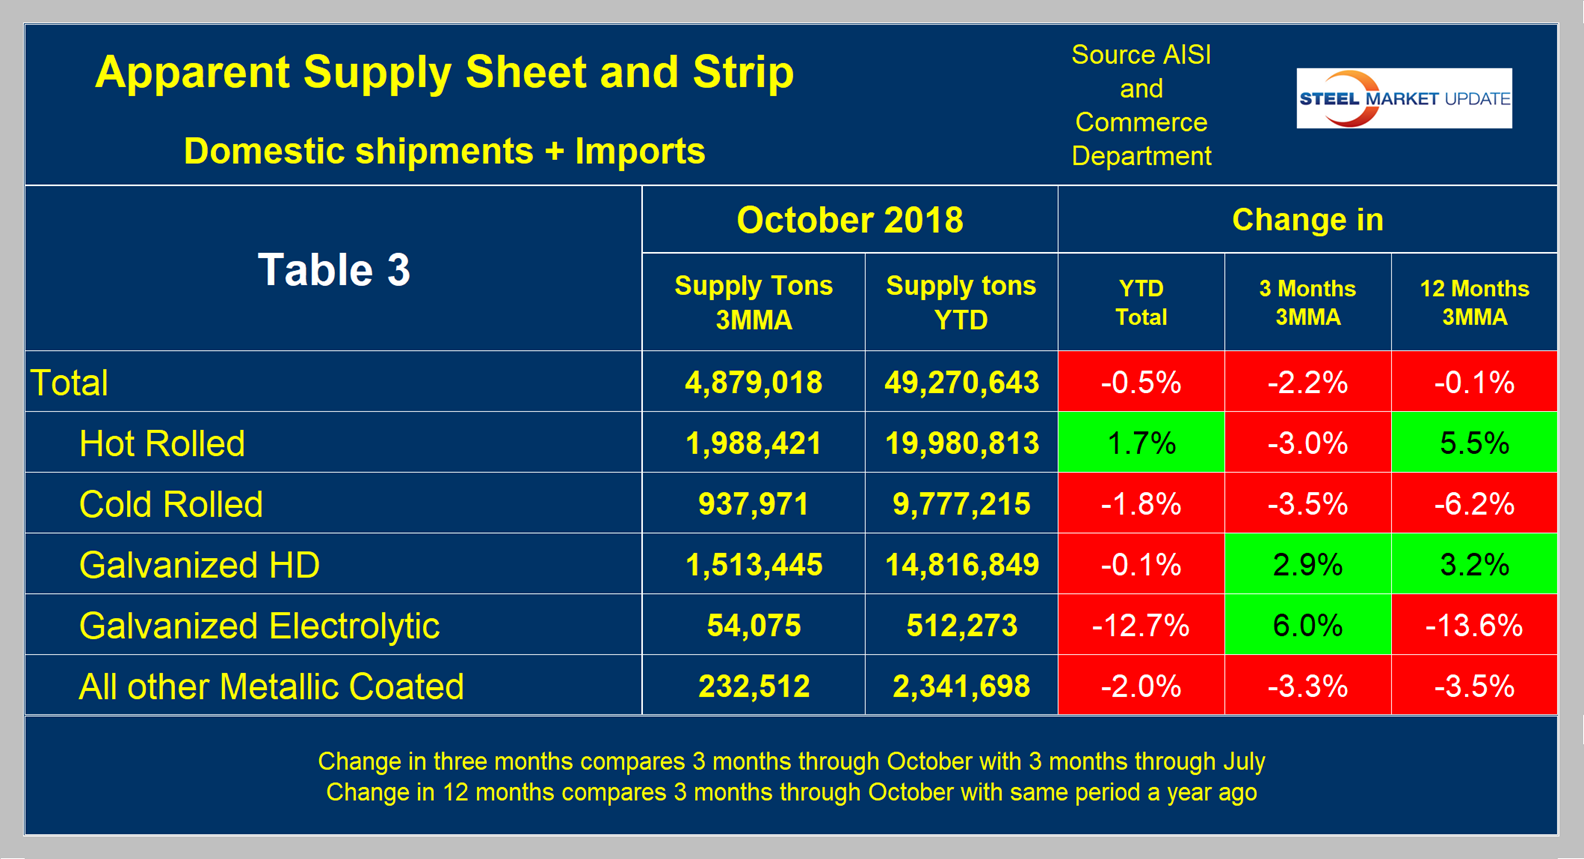
Figure 4 shows the long-term supply picture for the three major sheet and strip products, HRC, CRC and HDG, since January 2003 as three-month moving averages.
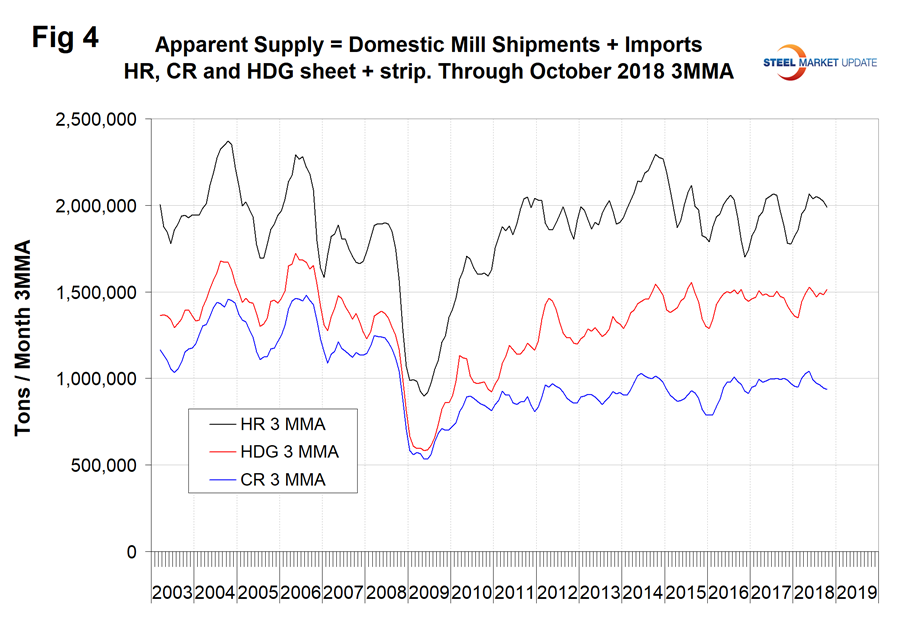
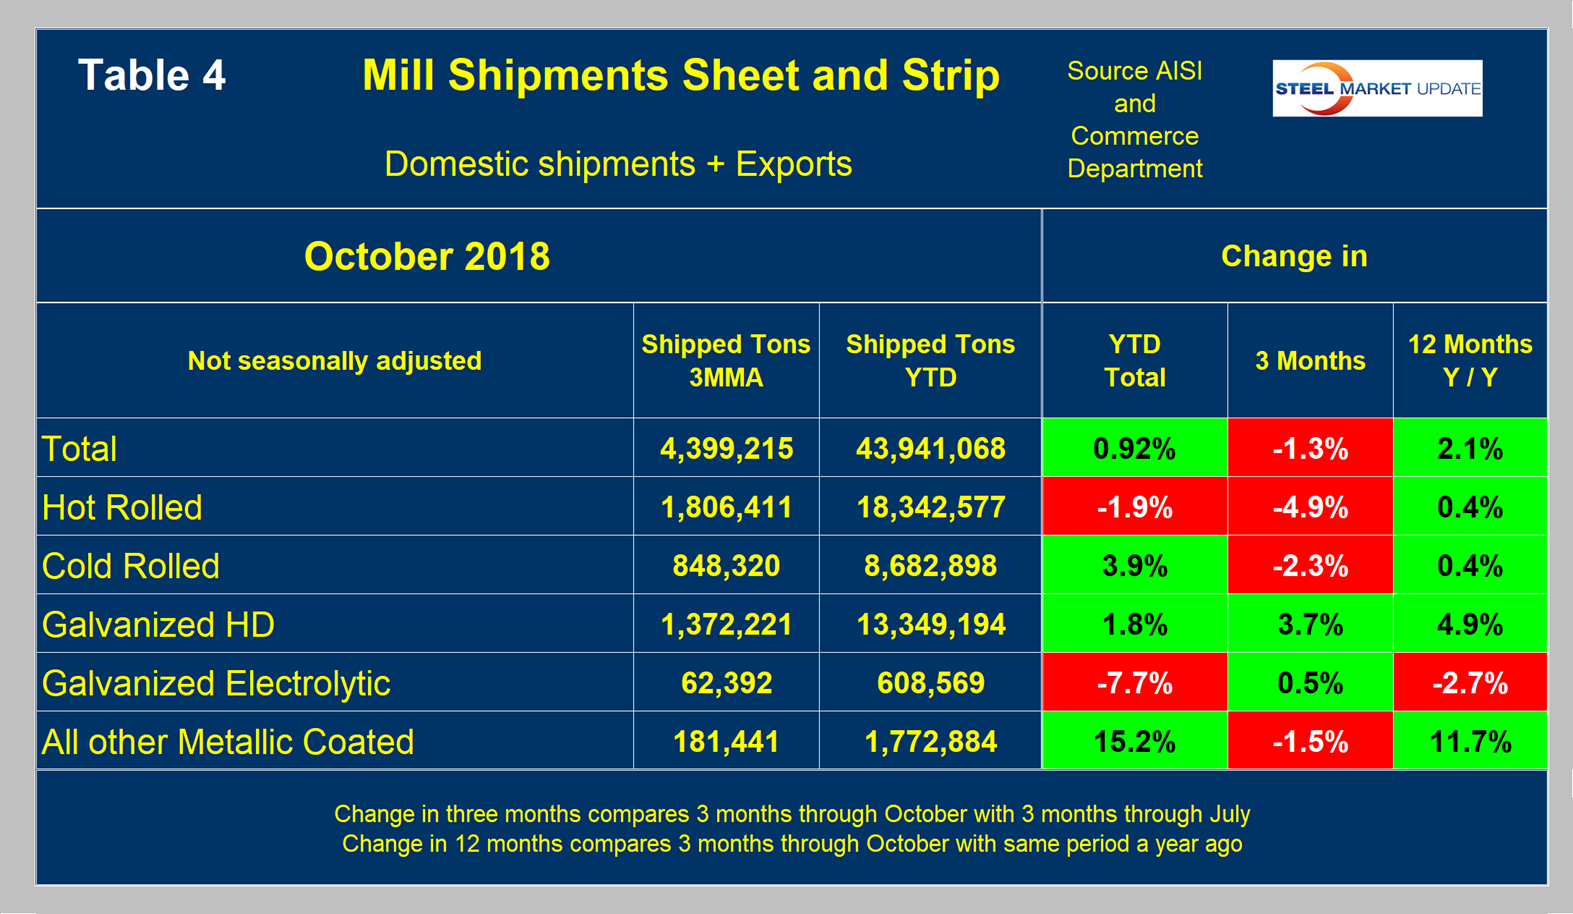
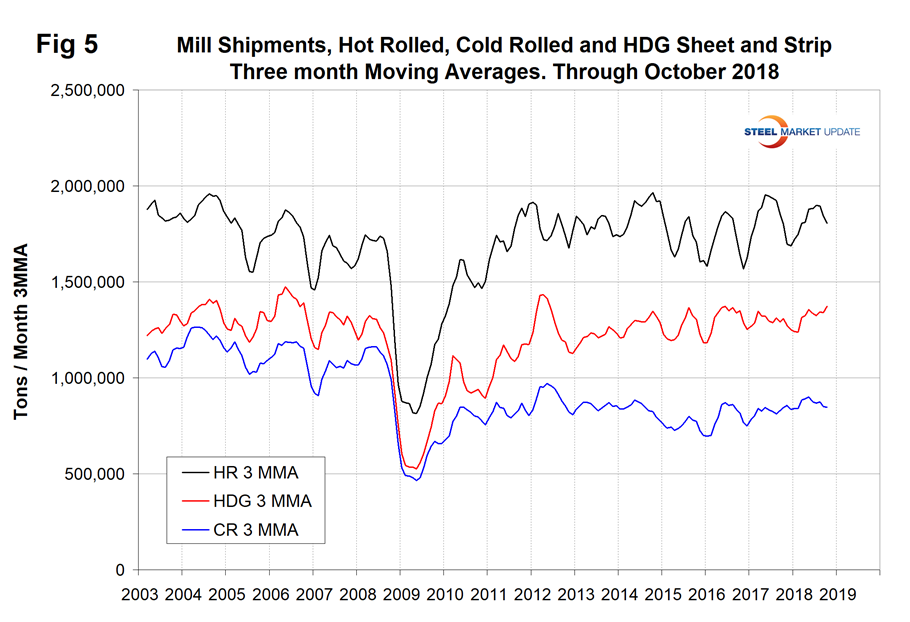
Table 4 shows that total shipments of sheet and strip products including hot rolled, cold rolled and all coated products increased by 0.9 percent year to date, and by 2.1 percent year over year. The negative growth in three months through October compared to three months through June is a seasonal effect as described above. Other metallic coated has had very strong shipment growth year to date. Figure 5 puts the shipment results for the three main products into the long-term context since January 2003.
SMU Comment: It’s now well into December and the latest information we have for shipments and supply is for October. AISI puts out weekly data for crude steel production, the latest for which is shown in Figure 1 for the week ending Dec. 8 on a four-week moving average basis. In the last two months, production has been higher than at any time since early 2015, but is still not great on a historical basis.


