

Market Data

December 6, 2018
BEA: All Regions Saw GDP Growth in 2Q
Written by Peter Wright
U.S. gross domestic product grew in every region of the country in the second quarter of 2018, according to Bureau of Economic Analysis data.
The BEA introduced a new data set for GDP by state and region in 2014 and backdated it to Q1 2005. Last week, the data was updated through Q2 2018. Even though this might be considered historically “old,” we think it’s worth reporting because it’s the foundation for where we are now. The data is published quarterly. Steel Market Update analyzes the data and reports to subscribers quarterly by region.
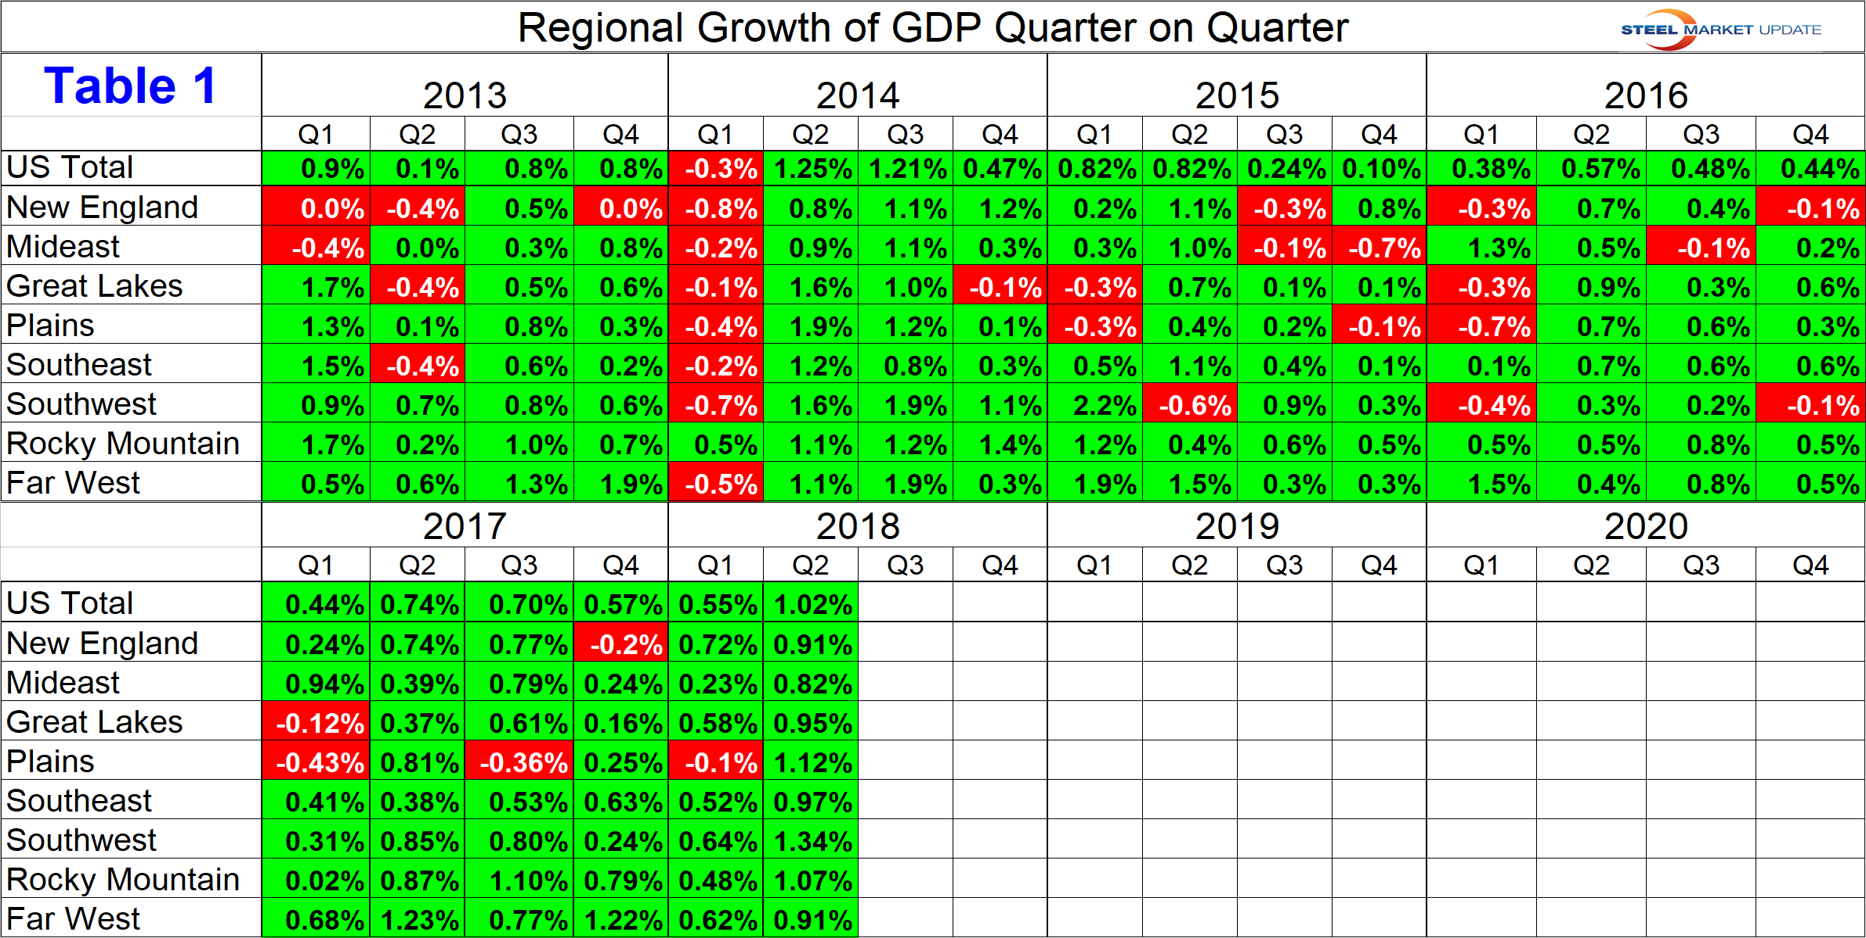
Table 1 shows the growth of regional GDP in chained 2012 dollars quarter on quarter. (These growth numbers are not annualized like the headline number for the growth of national GDP.) In the second quarter of 2018, every region had positive growth.
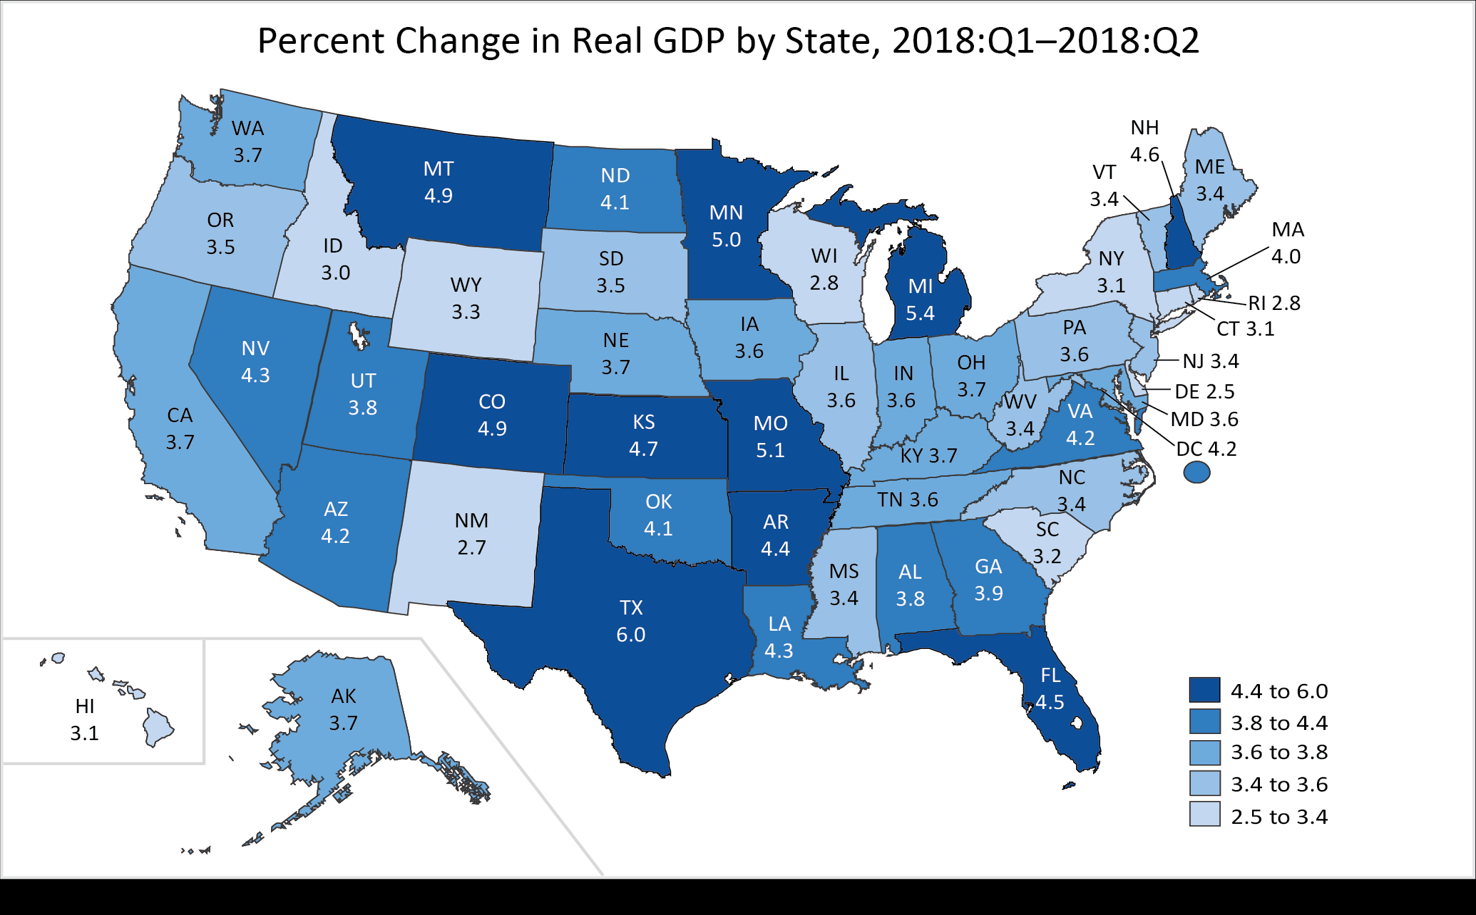
The BEA publishes a map of the United States showing annualized quarter-over-quarter growth by state within each region. Figure 1 is the map for Q2 2018. Texas had the highest growth rate at 6.0 percent and Delaware the lowest at 2.5 percent.
Regions as defined by the BEA are as follows:
New England: Connecticut, Maine, Massachusetts, New Hampshire, Rhode Island, Vermont.
Mid East: Delaware, DC, Maryland, New Jersey, New York, Pennsylvania.
Great Lakes: Illinois, Indiana, Michigan, Ohio, Wisconsin.
Plains: Iowa, Kansas, Minnesota, Missouri, Nebraska, North Dakota, South Dakota.
South East: Alabama, Arkansas, Florida, Georgia, Kentucky, Louisiana, Mississippi, North Carolina, South Carolina, Tennessee, Virginia, West Virginia.
South West: Arizona, New Mexico, Oklahoma, Texas.
Rocky Mountain: Colorado, Idaho, Montana, Utah, Wyoming.
Far West: Alaska, California, Hawaii, Nevada, Oregon, Washington.
In the second quarter of 2018, the South West had the highest growth rate at 1.34 percent followed by the Plains at 1.12 percent. The Mid East had the lowest at 0.82 percent.
Table 2 shows the GDP in millions of dollars annualized for the U.S. in total and for each of the eight regions. GDP is the value of the goods and services produced less the value of the goods and services consumed in each period. The South East region has the highest total GDP and the Rocky Mountains the lowest.
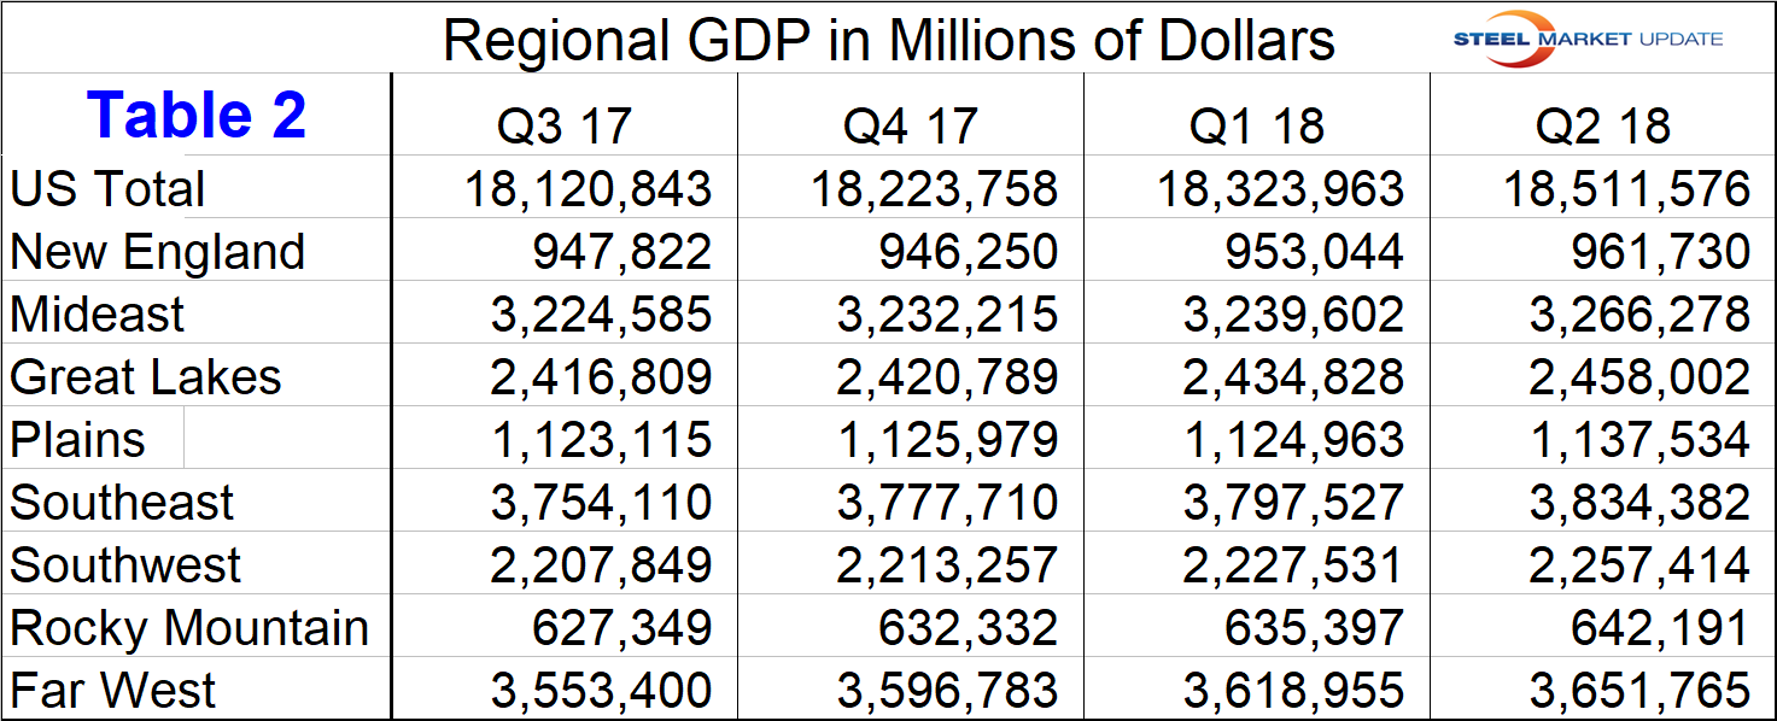
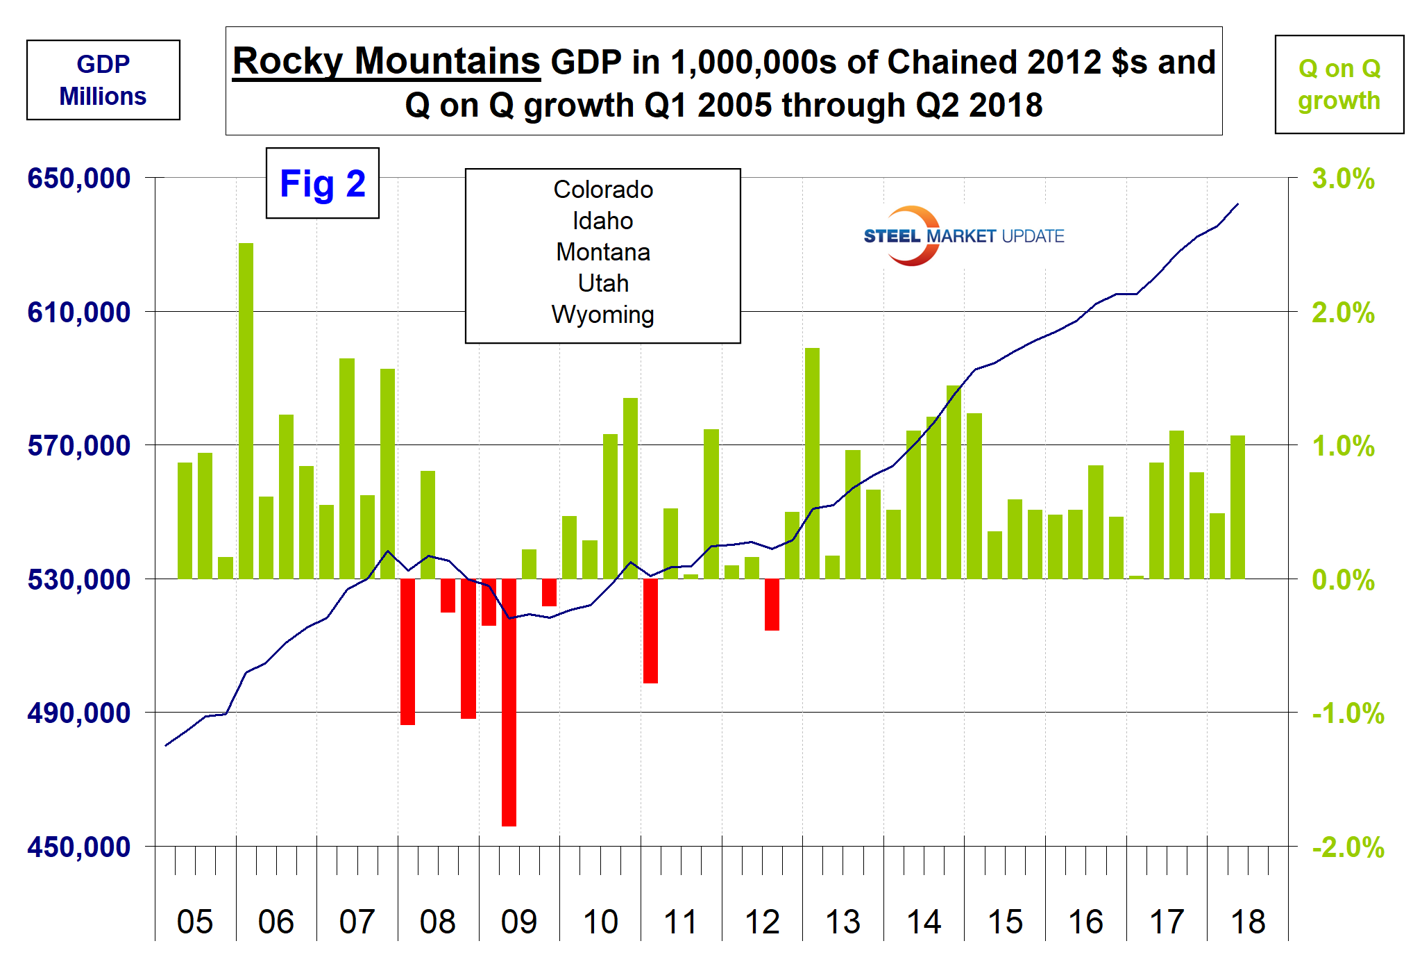
Figure 2 shows subscribers an example of the GDP graphs available on request for all regions and individual states. This example shows the results for the Rocky Mountains, which has an annual economic output of just less than $650 billion.
In addition to this report of regional GDP, we publish quarterly reports of regional job creation and regional imports. Our intention with these three reports is to help subscribers determine whether their business is subject to headwinds or tailwinds in the regions where they operate.
The U.S. total GDP values in this report are slightly higher than the sum of the regional totals because the GDP-by-state numbers exclude federal military and civilian activity located overseas (because it cannot be attributed to a particular state). In addition, the official headline quarterly report of national GDP is annualized, which increases the value by a factor of four.


