

Market Data

November 29, 2018
Shipments and Supply of Sheet Products through September
Written by Peter Wright
This is the first time we have done this analysis since our April publication and we were surprised that the results for sheet and strip products weren’t as good as we expected. Our analysis is based on data from the American Iron and Steel Institute (AISI) and the U.S. Department of Commerce (DoC).
The analysis summarizes total steel supply by product from 2003 through September 2018 and year-on-year changes. It then compares domestic mill shipments with total supply to the market. It quantifies market direction by product and enables a side-by-side comparison of the degree to which imports have absorbed demand.
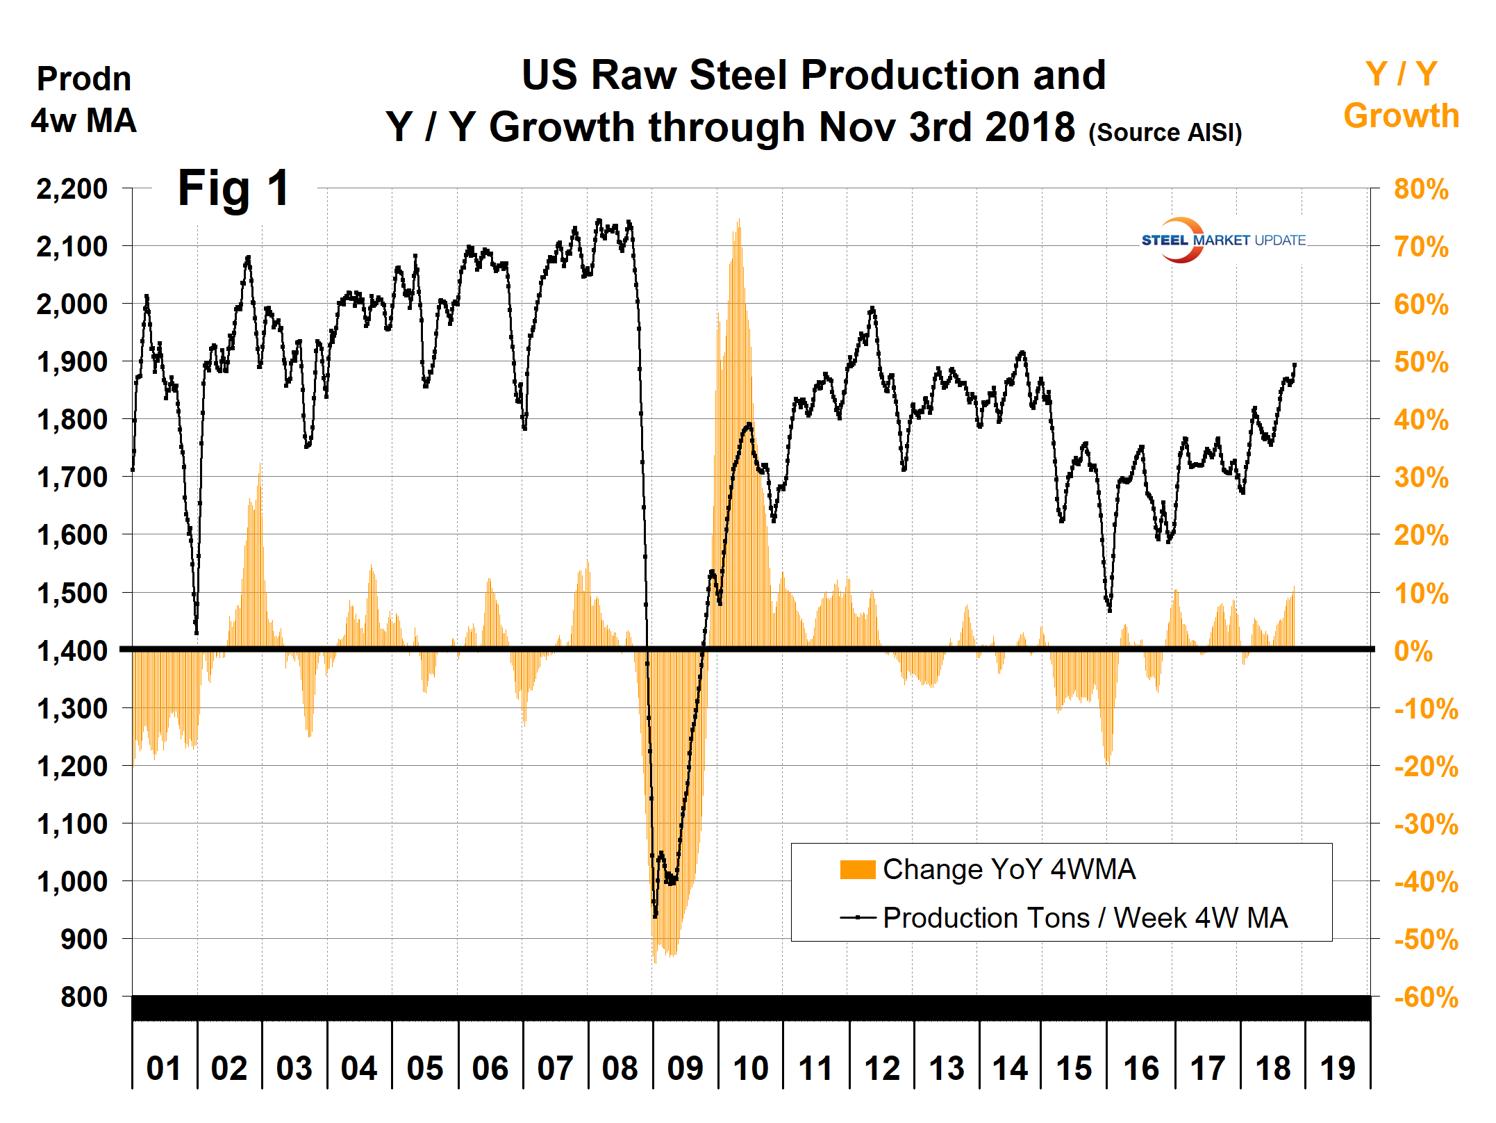
A week ago, we published Figure 1, which shows robust growth of U.S. raw steel production through Nov. 4. This is based on weekly data from the AISI.
The shipments and supply report that you are reading now is based on monthly shipments by product as reported by the AISI, plus import and export data from the DoC. For sheet products, it doesn’t show the same growth trajectory. To validate the analysis, we took the total carbon and alloy shipments data and plotted monthly to see if it corresponded with the raw steel production report in Figure 2.
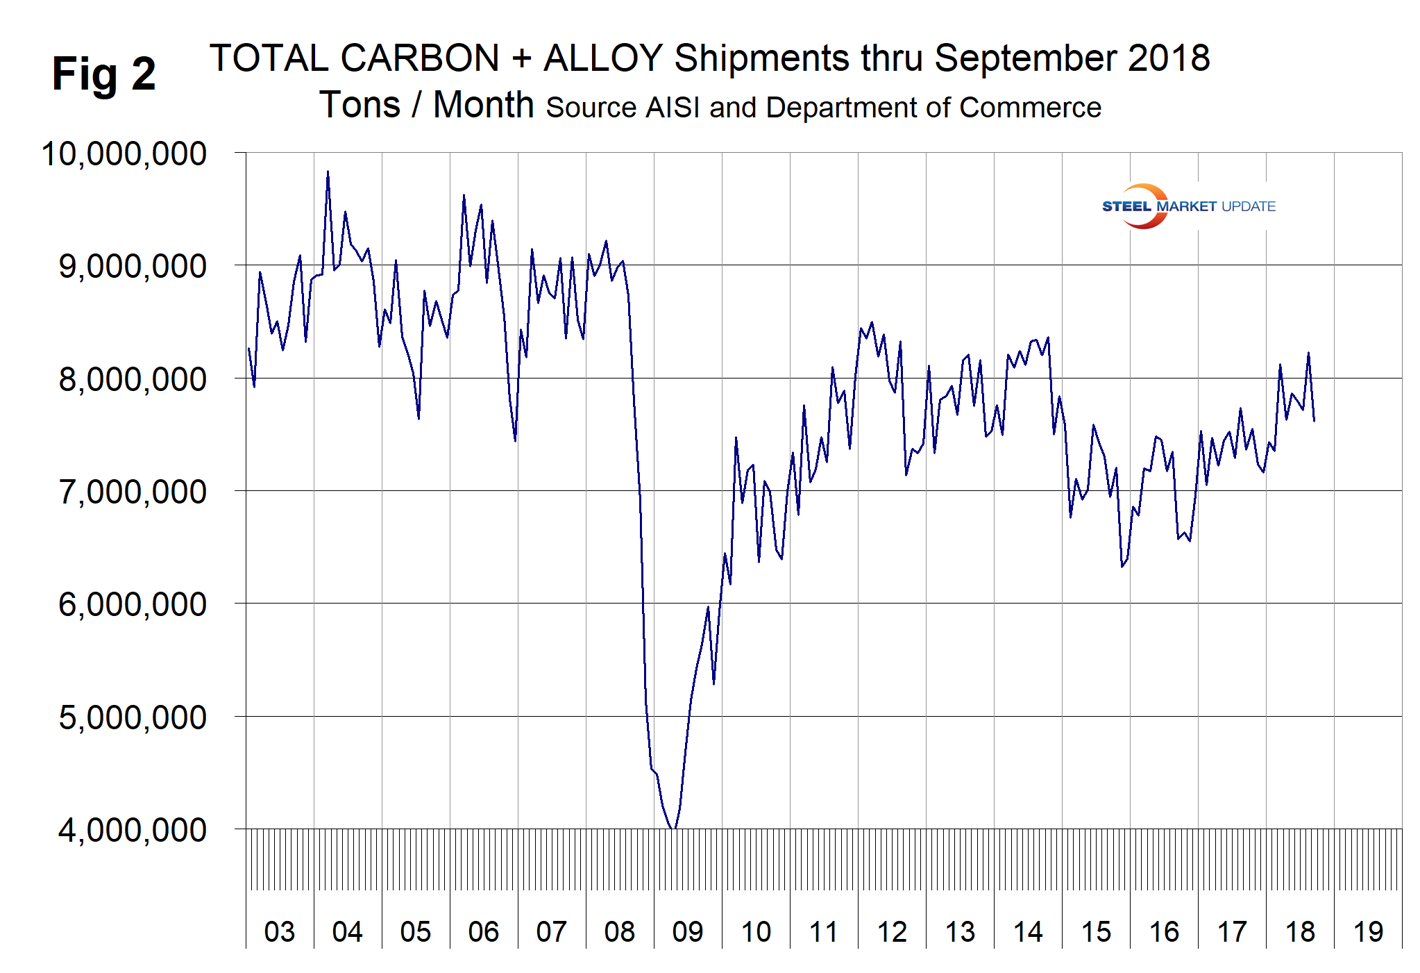
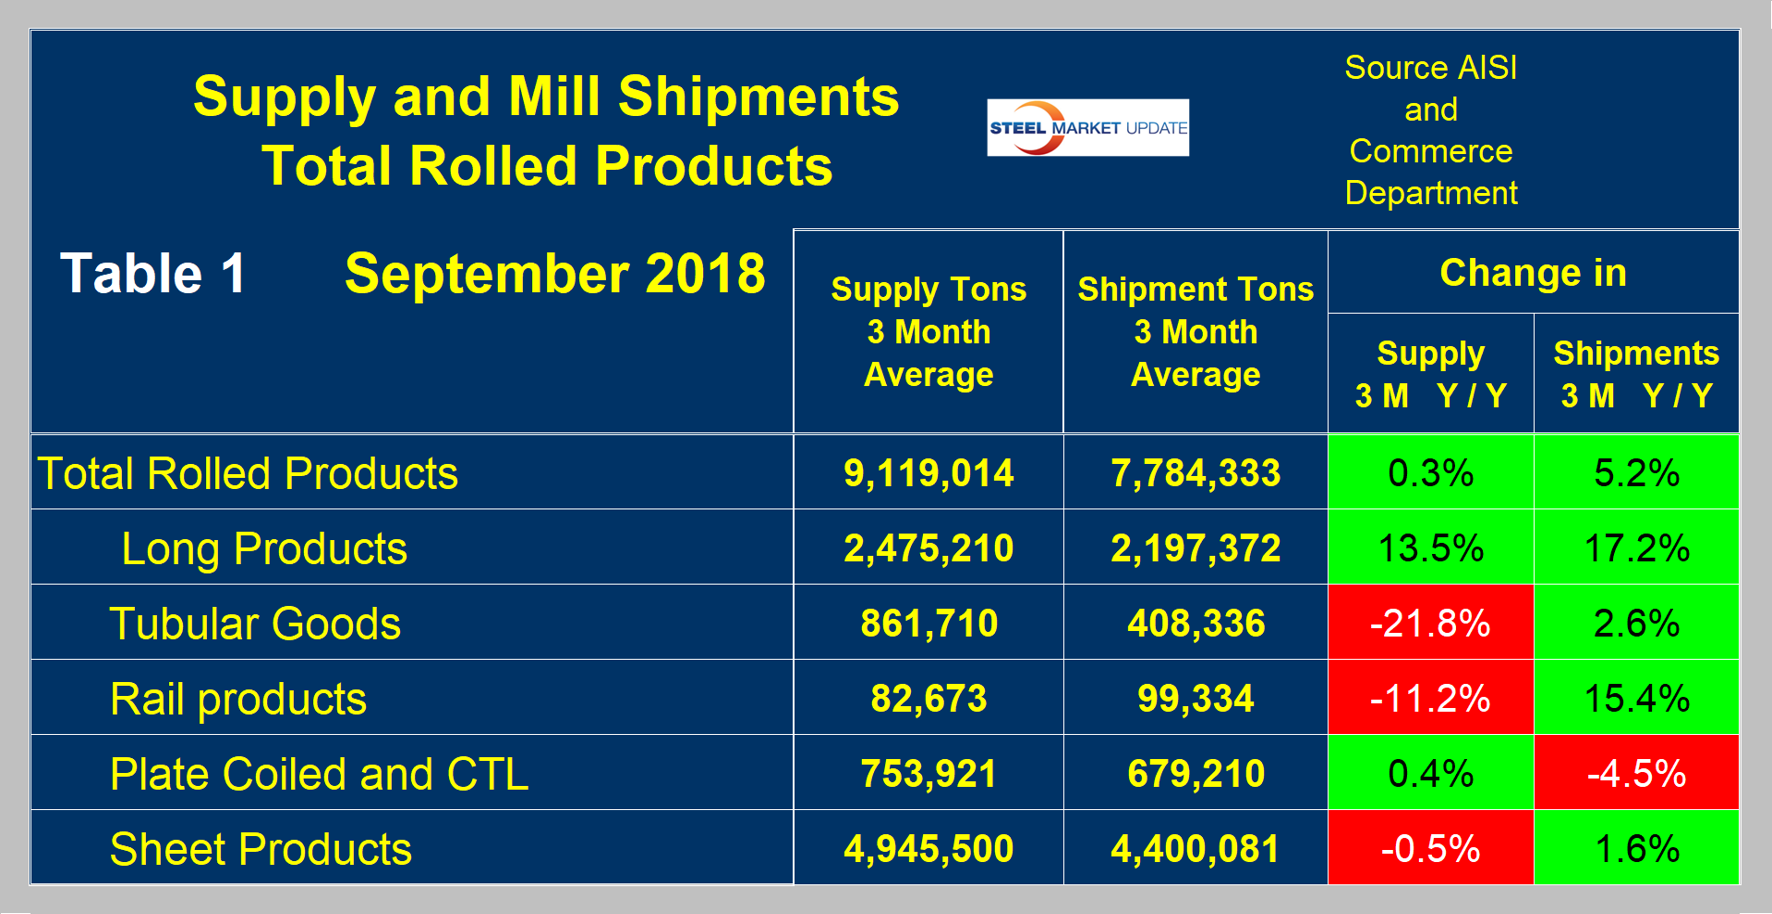
The curves are basically the same, therefore we conclude that what follows here is a true reflection of the sheet steel market. First, though, we will look at the shipment and supply situation for all product groups to see how much difference there is between them. Table 1 is this compilation. Total supply (proxy for market demand) as a three-month moving average (3MMA) was up by 0.3 percent and mill shipments were up by 5.2 percent, meaning that imports took a much smaller share year over year. However, there is a big difference between products. Long products fared best with a supply growth of 13.5 percent; tubulars did worst with a contraction of 21.8 percent. Sheet products in total declined by 0.5 percent.
Now let’s look at sheet products in detail. One consideration is that historically demand in September has always been down from August a decline that has averaged 5.0 percent in the last nine years. This year, September was down by 6.1 percent, therefore fairly normal. Figure 3 shows the seasonality that has existed since January 2010.
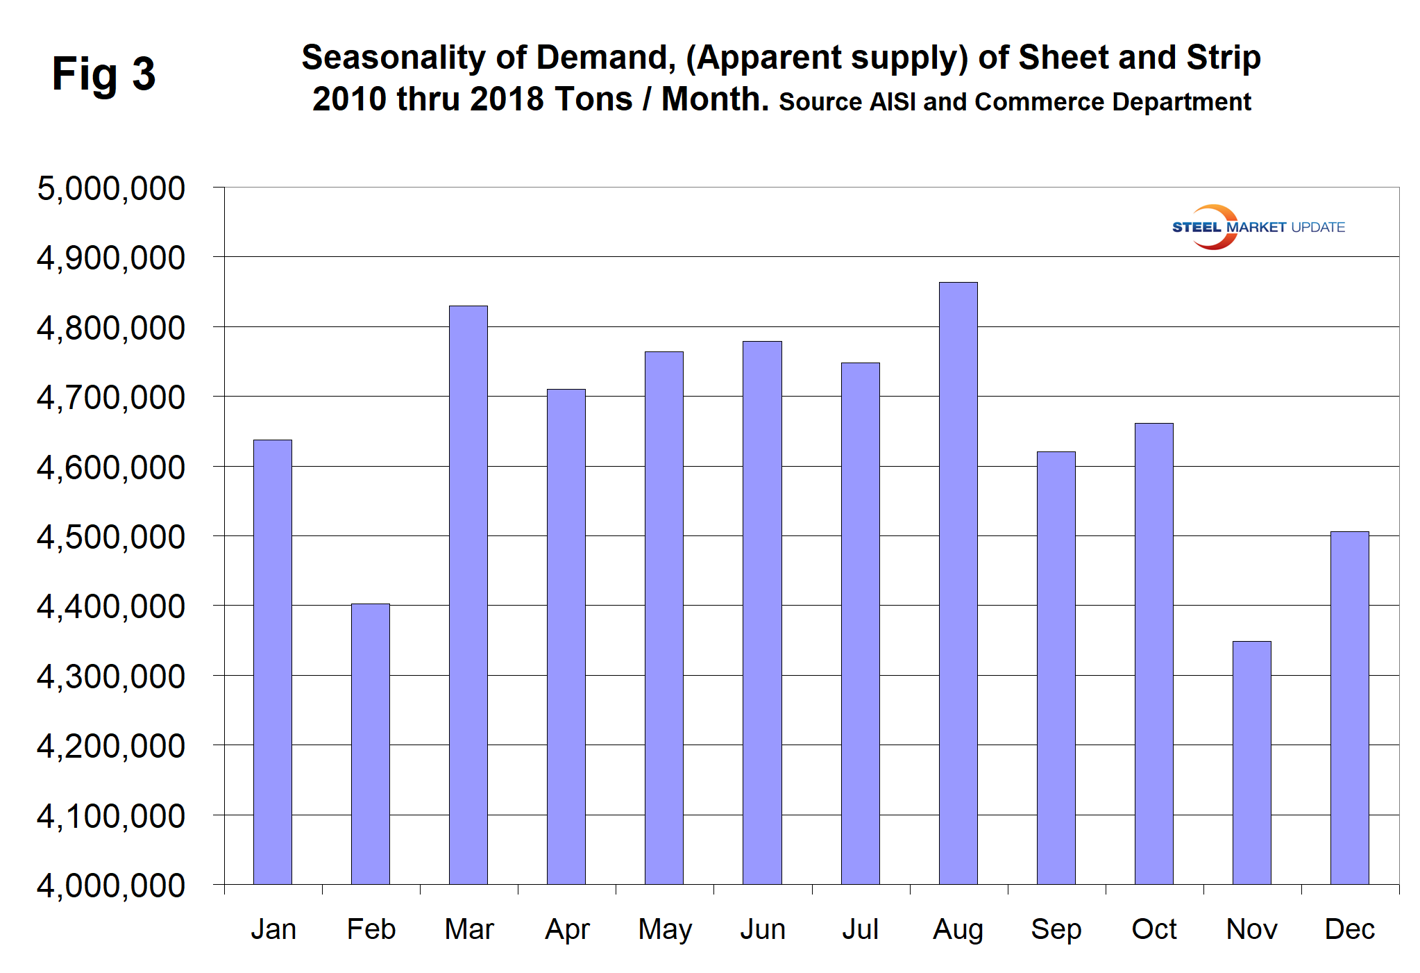
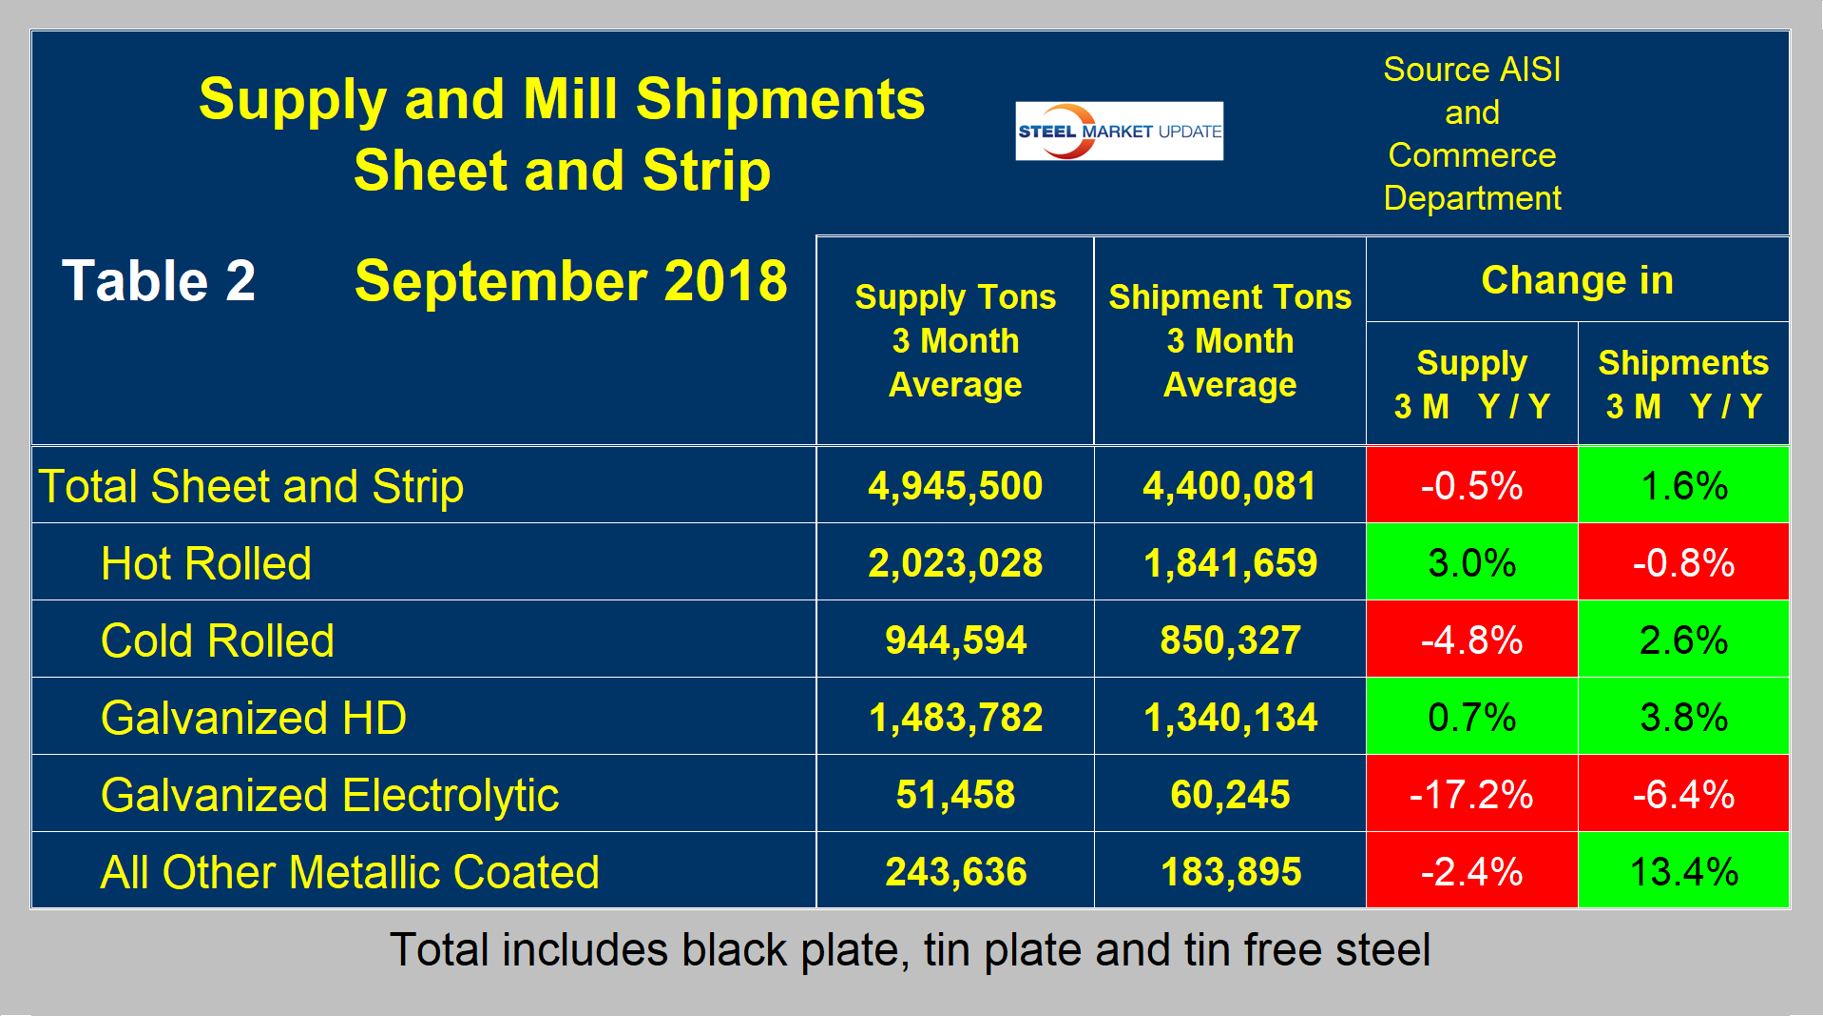
Table 2 describes both apparent supply and mill shipments of sheet products (shipments includes exports) side by side as three-month averages through September with year-over-year growth rates for each. Comparing the year-over-year time periods, total supply to the market decreased by 0.5 percent and mill shipments increased by 1.6 percent. Table 2 breaks down the total into product detail and shows that imports were more of a factor for HR and less for CR. Shipments of other metallic coated improved the most. A review of supply and shipments separately for individual sheet products is given below.
Apparent supply is defined as domestic mill shipments to domestic locations plus imports. In the three months through September 2018, the average monthly supply of sheet and strip was 4.947 million tons, down by 0.5 percent year to date and by the same amount comparing three months through September year over year. There is no seasonal manipulation of any of these numbers. By definition, year-over-year comparisons have seasonality removed, but 3M/3M comparisons do not. Table 3 shows the change in supply by product on this basis through September.
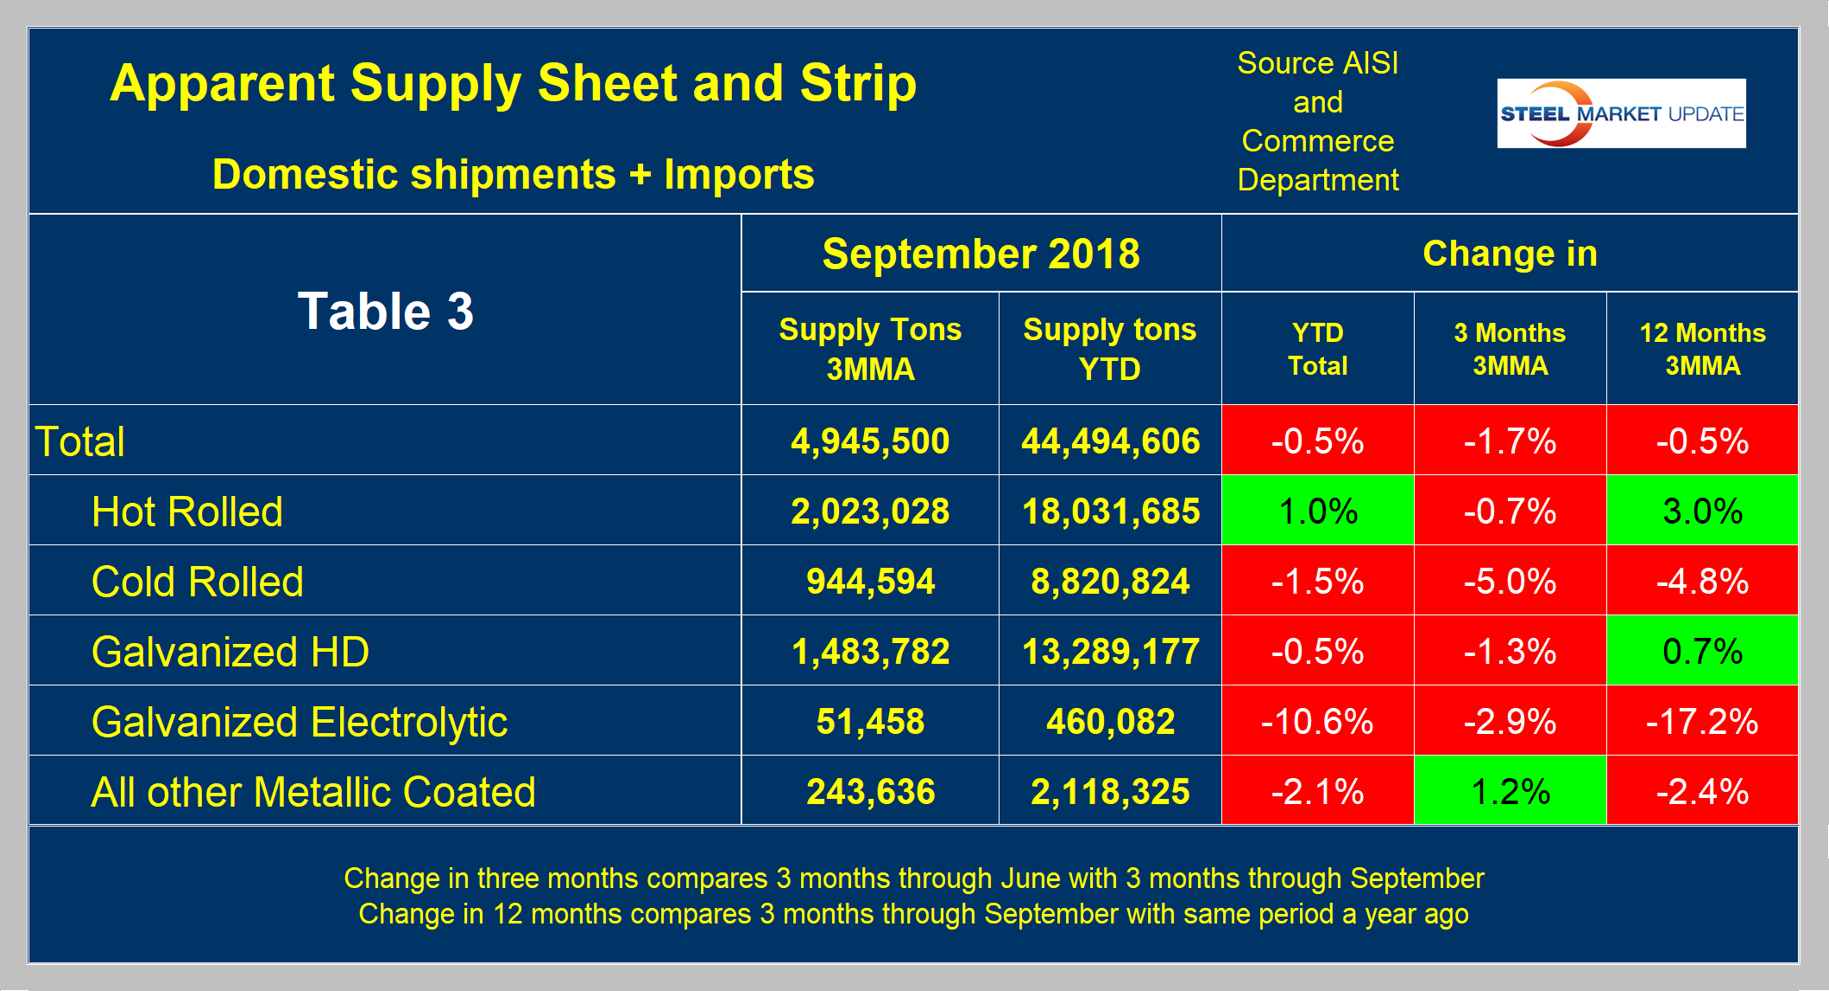
Figure 4 shows the long-term supply picture for the three major sheet and strip products—HRC, CRC and HDG—since January 2003 as three-month moving averages.
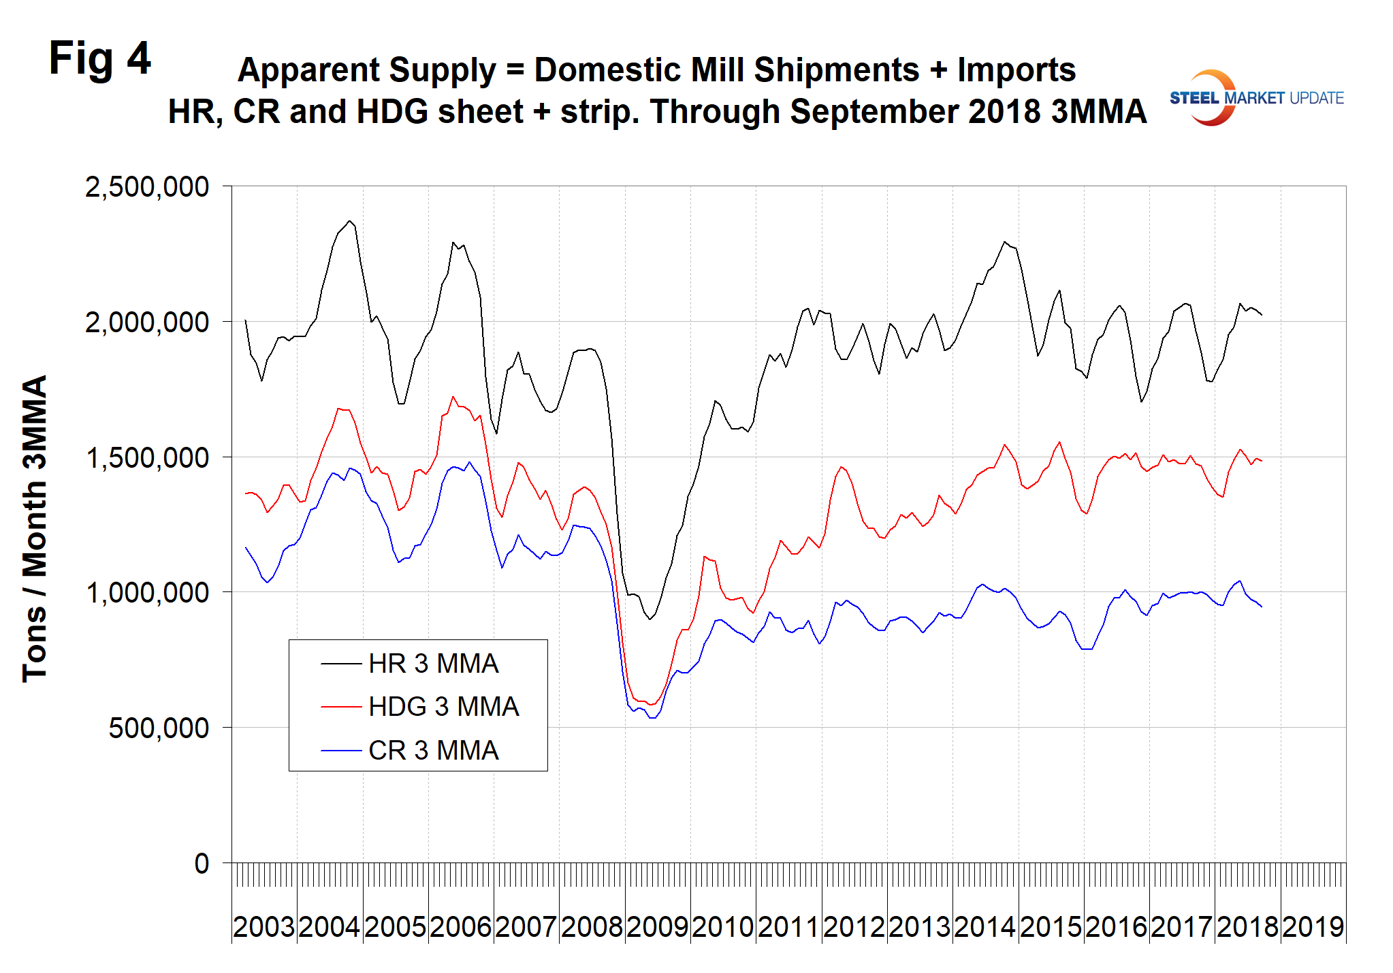
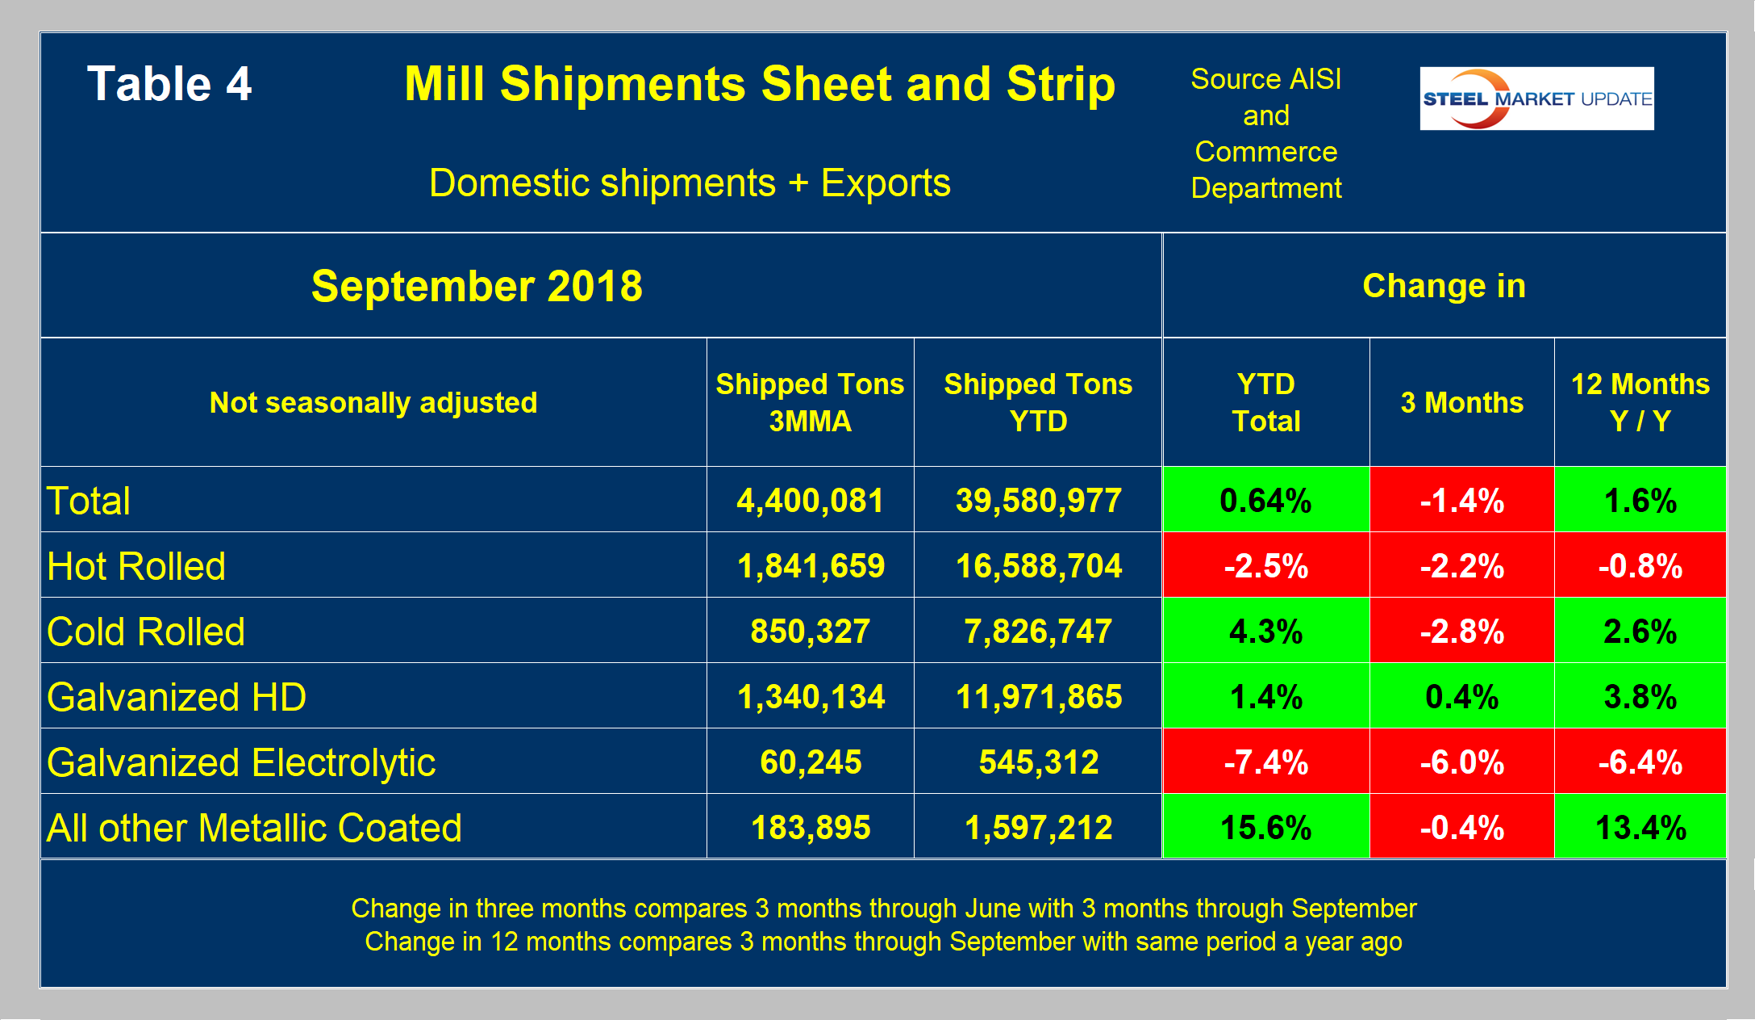
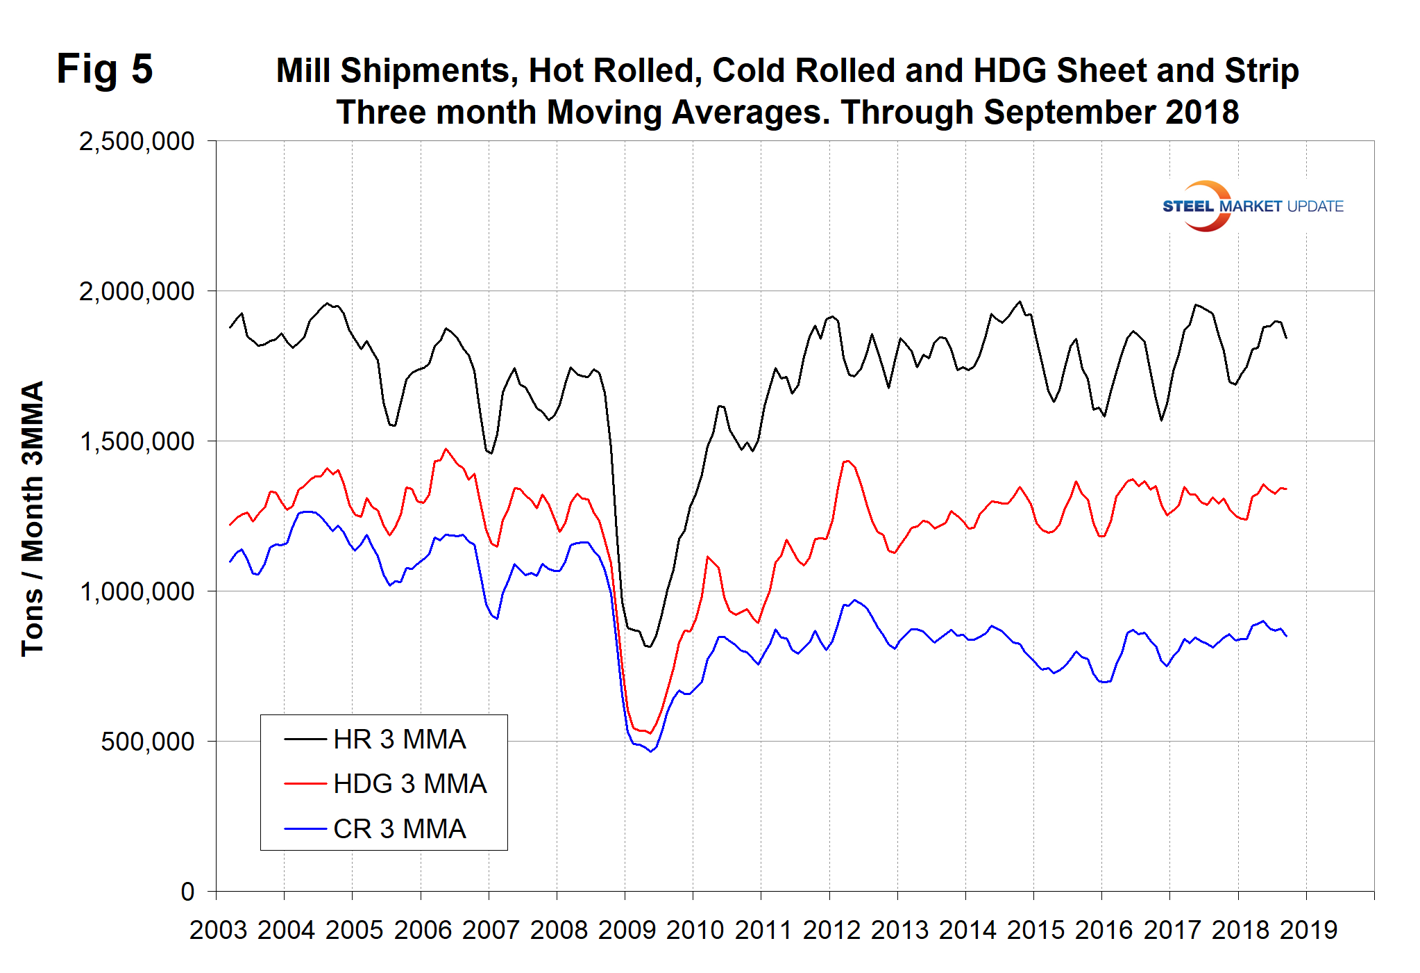
Table 4 shows that total shipments of sheet and strip products including hot rolled, cold rolled and all coated products increased by 0.6 percent year to date, and by 1.6 percent year over year. The negative growth in three months through September compared to three months through June is a seasonal effect as described above. Other metallic coated has had very strong shipment growth year to date. Figure 5 puts the shipment results for the three main products into the long-term context since January 2003.
SMU Comment: It’s now well into November and the latest information we have for shipments and supply is for September. AISI puts out weekly data for crude steel production, the latest for which is shown in Fig 1 for the week ending Nov. 3 on a four-week moving average basis. In the last two months, production has been higher than at any time since early 2015, but is still not great on a historical basis.


