Market Data

November 24, 2018
SMU Currency Analysis: Dollar Relatively Stable
Written by Peter Wright
Editor’s note: Steel Market Update is sharing the following Premium content with all its readers in this issue. For more information on how to upgrade to a Premium-level subscription, email info@SteelMarketUpdate.com.
The U.S. dollar has on average been relatively stable in the last three months against the currencies of the other steel trading nations.
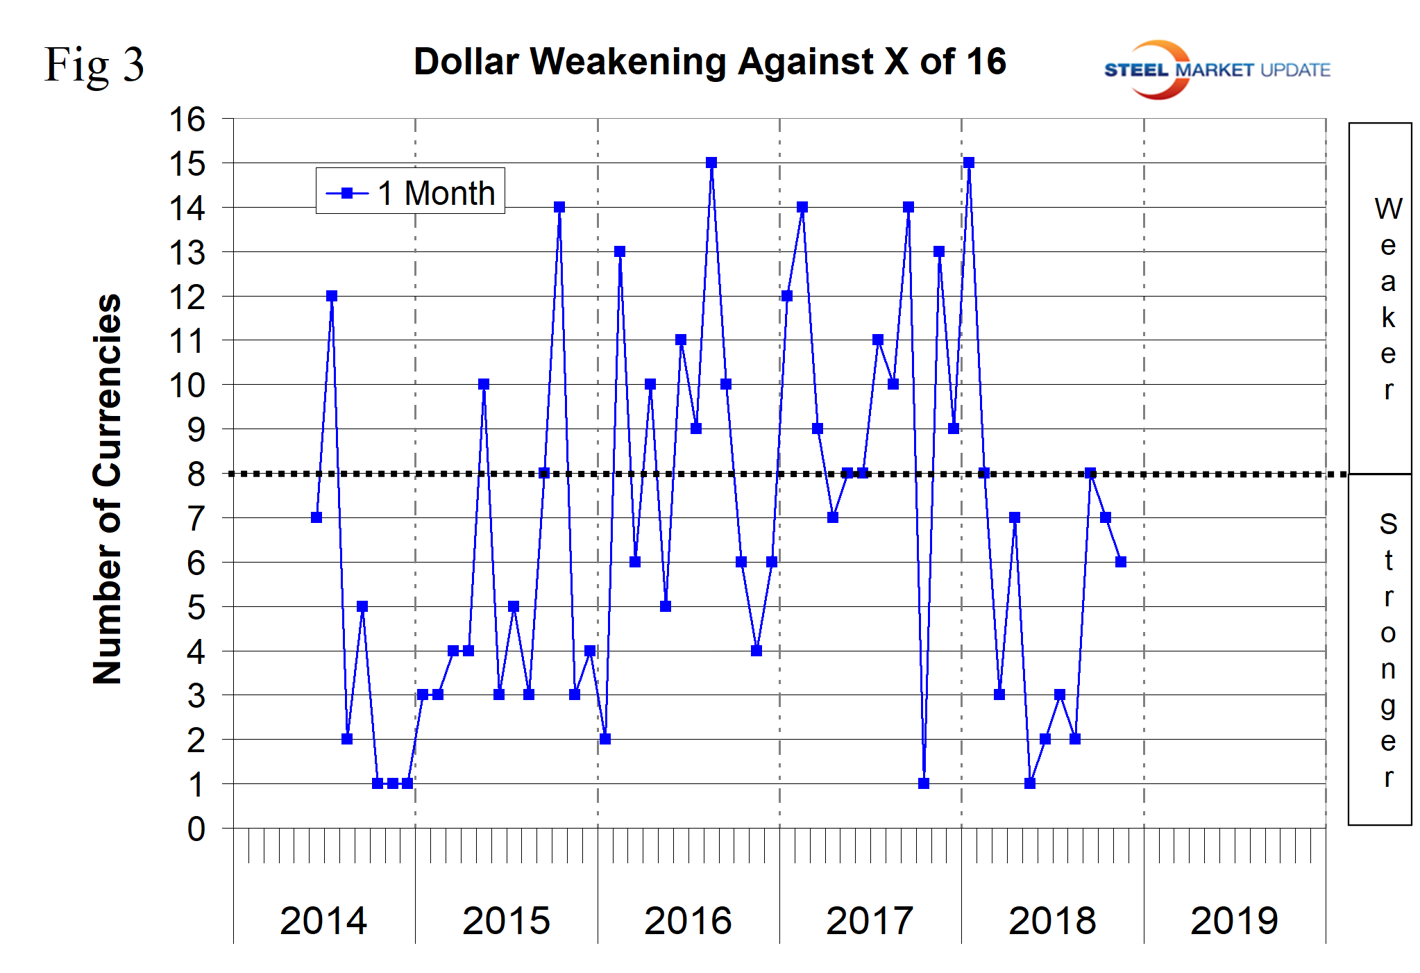
In the last month, the dollar weakened against six of the 16 currencies that Steel Market Update tracks. This was close to the performance we reported in each of the previous two months, but a dramatic change from the period May through August. In May, only one of the 16 appreciated against the dollar, in June only two, in July only three and in August just two. Please see the end of this report for an explanation of data sources.
Currency analysis is a highly complex yet important requirement for steel industry corporate management. As we produce this update, we look for expert opinion to flush out the values of the 16 steel trading nations that we track. This month we came across an Economist article that we think summarizes the overall situation very well: “Annualized quarterly growth in the U.S. is greater than 4.0 percent, yet the IMF thinks growth will slow in all of the other major advanced economies and emerging markets are in trouble. This divergence between America and the rest results in divergent monetary policies. The Federal Reserve has raised interest rates eight times since December 2015. The European Bank is still far from its first increase. In Japan, rates are negative. China has relaxed its monetary policy in response to a weakening economy. When interest rates rise in America and nowhere else the dollar strengthens making it harder for emerging markets to repay their dollar debts.”
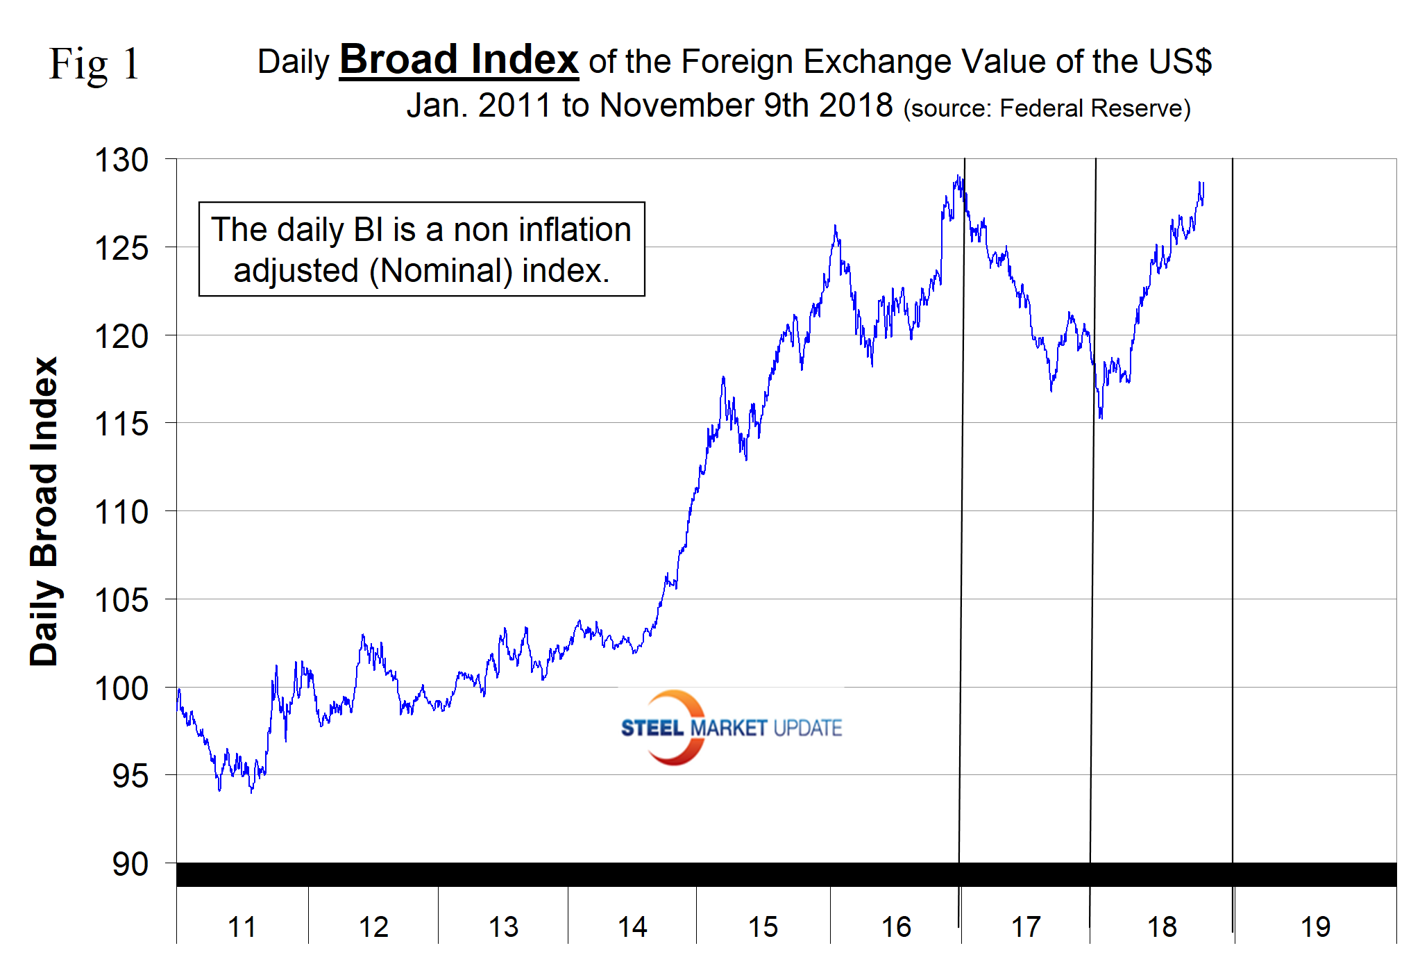
The Broad Index value of the U.S. dollar is reported several days in arrears by the Federal Reserve; the latest value published was for Nov. 9. Figure 1 shows the index value since January 2011. The dollar had a recent peak of 128.96 on Jan. 3, 2017, which was the highest value in almost 15 years; the recent low point was Feb. 1, 2018, at 115.21. On Nov. 9, the dollar had almost fully recovered to 128.65.
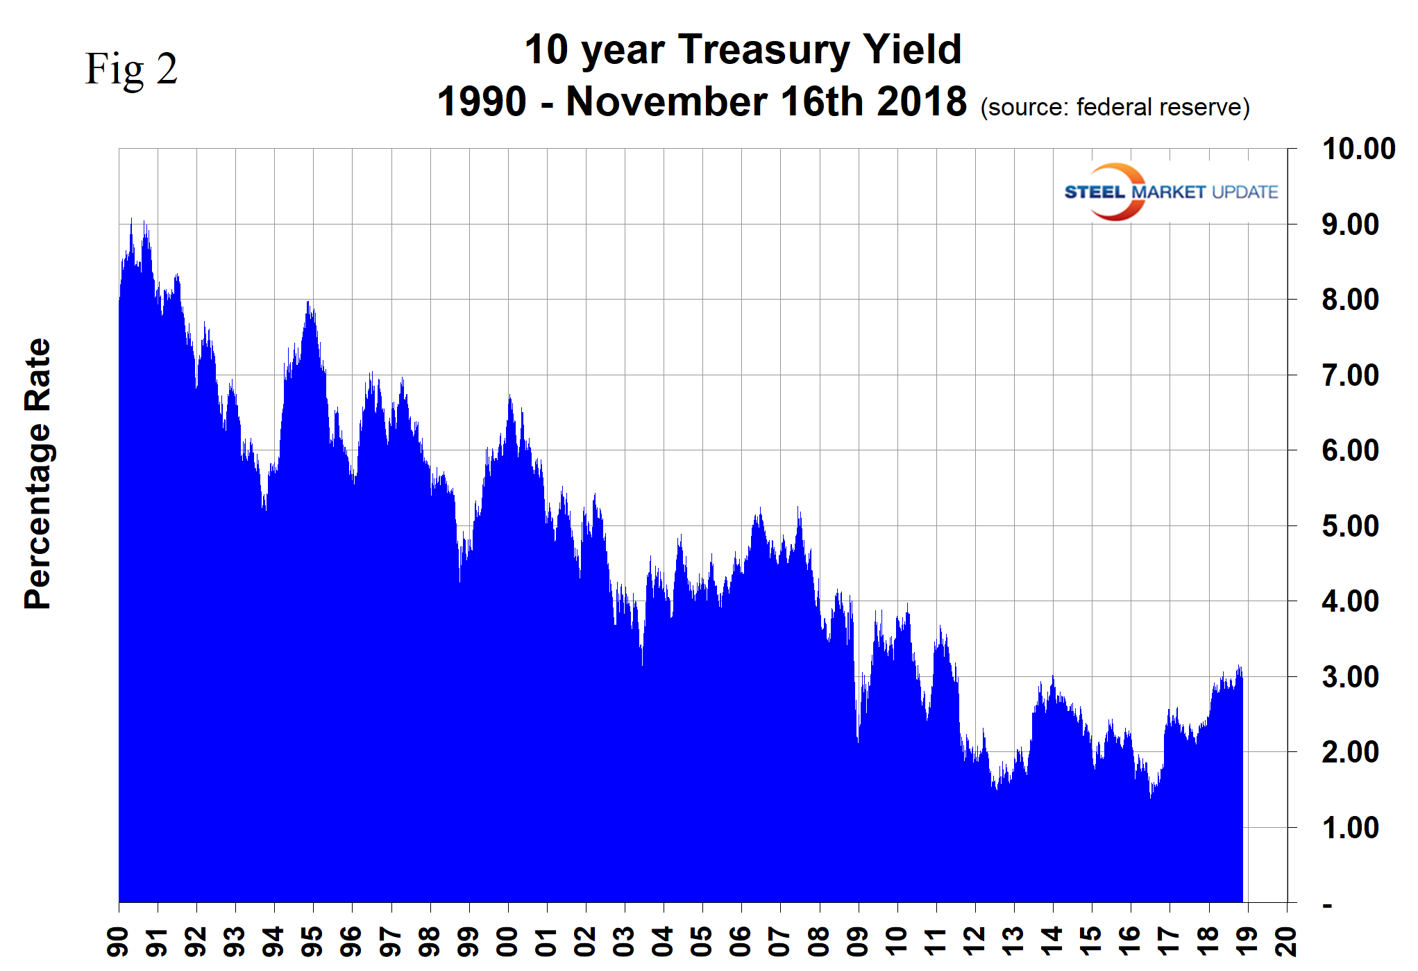
On Sept. 26, the Fed enacted its eighth rate hike of this cycle, which was universally expected and therefore priced into the dollar value at that time. Ever since the FOMC’s previous meeting in early August, federal-funds futures had implied odds of another hike at 91 percent to 100 percent at the September meeting. Figure 2 describes the 10-year treasury yield through Nov. 16 on which date the rate was 2.99 percent, down from a seven-year high of 3.17 percent on Nov. 8.
Fed officials indicated at the September meeting that, if conditions are right, there will be one more rate hike this year, three more next year, and one more coming in 2020.
Each month, SMU publishes an update of Table 1, which shows the value of the U.S. dollar against the currencies of 16 major global steel and iron ore trading nations. The table shows the change in value in one year, three months, one month and seven days through Nov. 16. Currencies that weakened against the U.S. dollar are color coded in red. Green indicates currencies that strengthened against the U.S. dollar. November was the third month in which there was a progression of the dollar weakening moving to shorter time frames. In the last seven days, the dollar weakened against 12 of the 16.
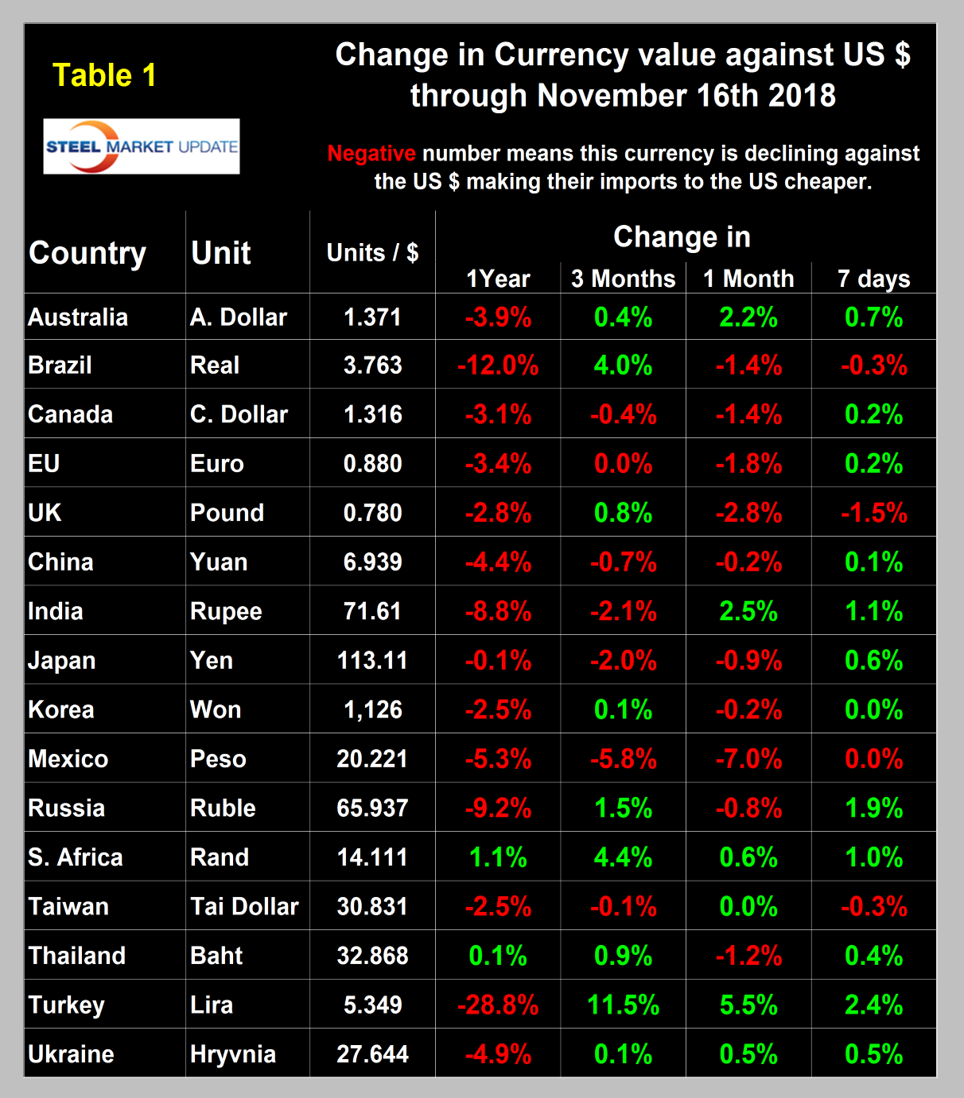
Figure 3 gives a longer-range perspective and shows the extreme gyrations that have occurred in the last three years at the one-month level. Through Nov. 16, the dollar weakened against six of the 16 in the previous month and strengthened against the other 10.
A falling dollar puts upward pressure on commodity prices that are greenback denominated. We regard strengthening of the U.S. dollar as negative and weakening as positive because of the effect on the trade balance of all commodities and on the total national trade deficit.
In each of these reports, we comment on several of the 16 steel and iron ore trading currencies listed in Table 1 and over a period of several months will describe the history of all of them. Charts for each of the 16 currencies are available through Oct. 14 for any premium subscriber who requests them.
The Canadian Dollar
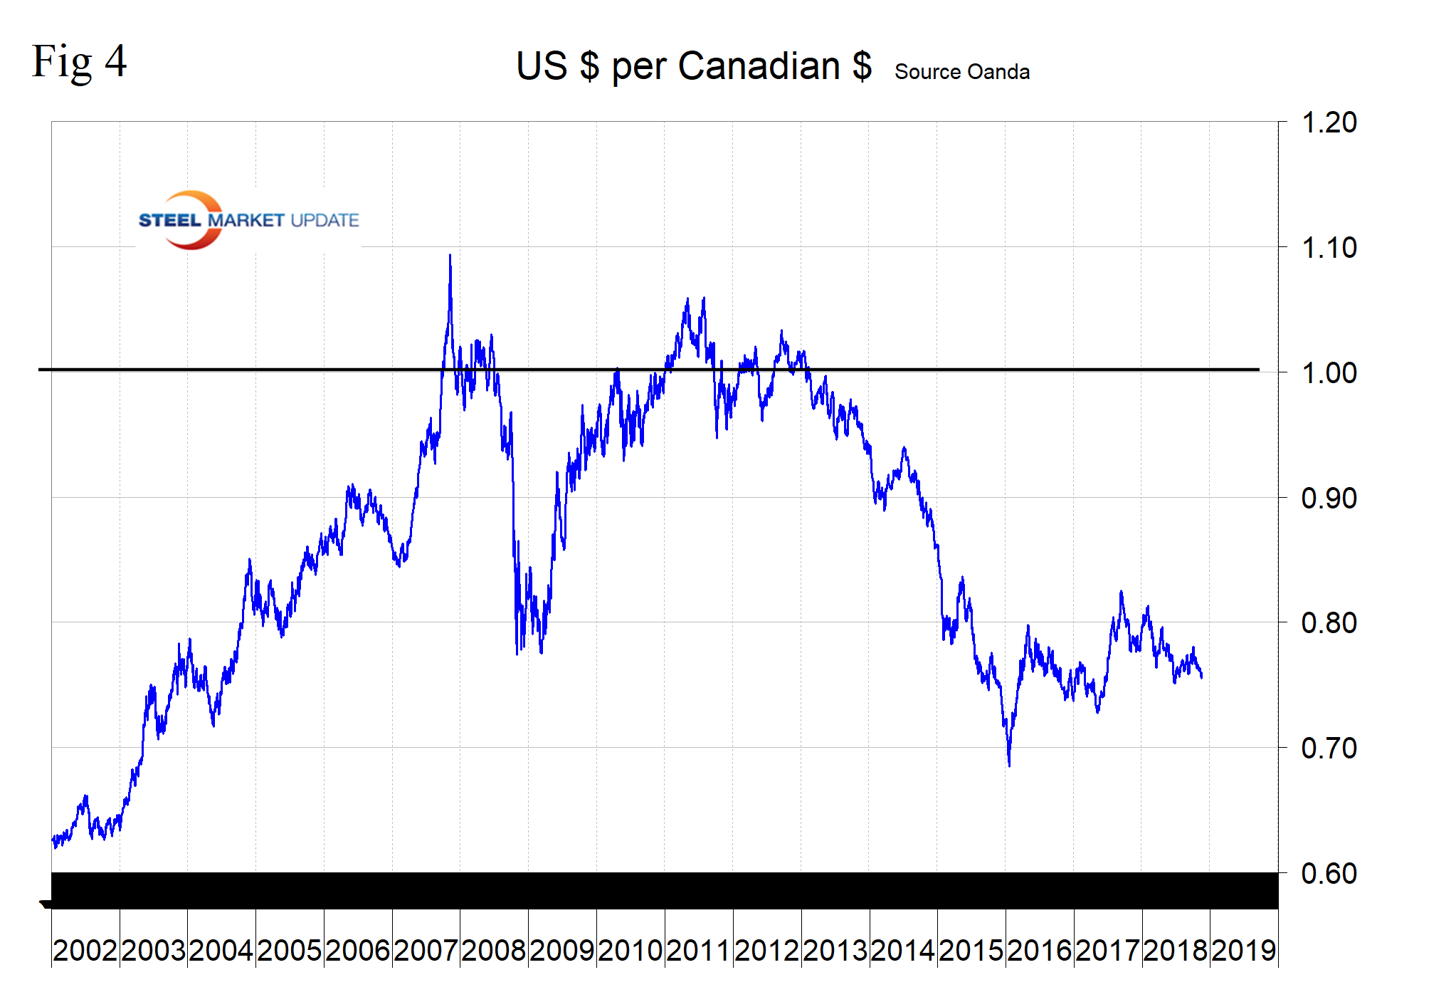
Canada’s loonie has declined by 1.4 percent against the U.S. dollar in the last month (Figure 4). On Nov. 13, currency analyst Kenny Fisher wrote: “Nervousness and uncertainty on the part of investors is never good news for the Canadian dollar, as the minor currency is dependent on risk appetite. With global stock markets seeing red over the past few days, the Canadian currency has fallen out of favor. The Bank of Canada has taken a page out of the Federal Reserve’s book, saying that its policy of gradual rate hikes will continue into 2019. The BoC will have to continue raising rates if the Canadian dollar is to hold its own against the strong U.S. dollar.”
The Mexican Peso
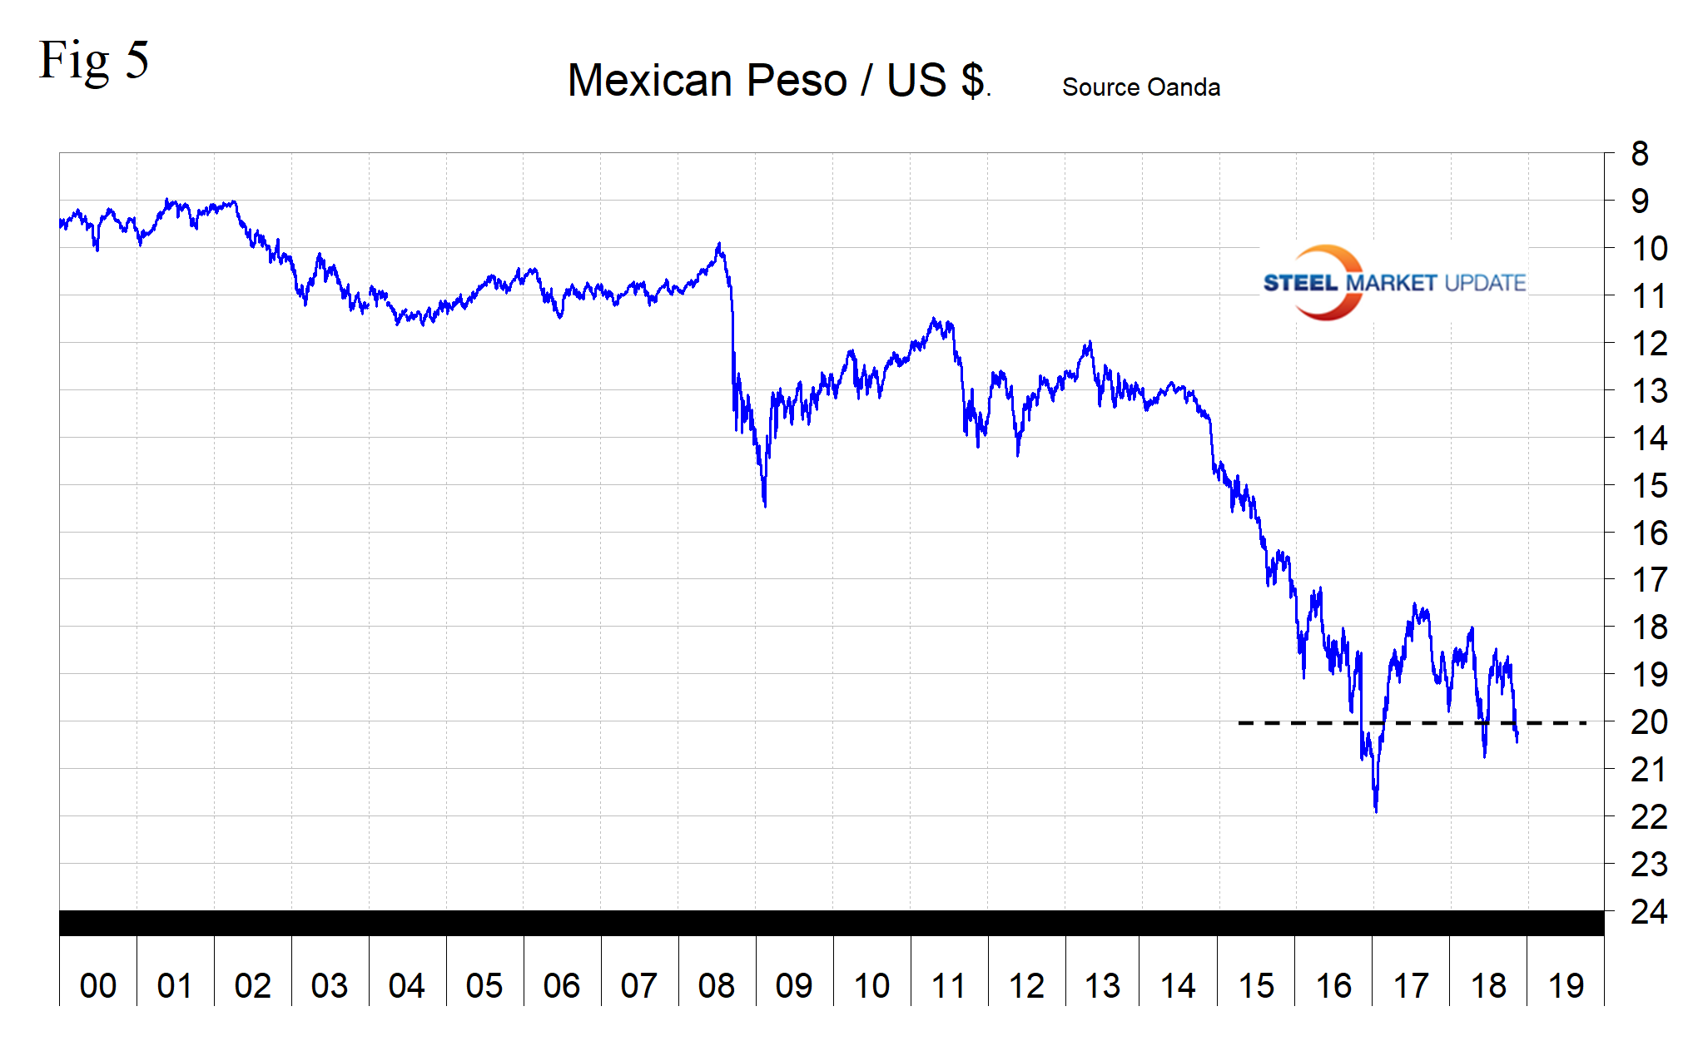
Mexico’s peso has declined by 7.0 percent against the U.S. dollar in the last month (Figure 5). On Nov. 5, the IMF concluded their Article 4 consultation with Mexico, summarized as follows: “The Mexican economy has continued to exhibit resilience in the face of a complex environment. Output has grown at a moderate pace while inflation declined, although it remains above the central bank’s target. The flexible exchange rate has continued to be a key shock absorber. Fiscal consolidation is on track, monetary policy has maintained a tight stance, while financial supervision and regulation remain strong.”
The Turkish Lira
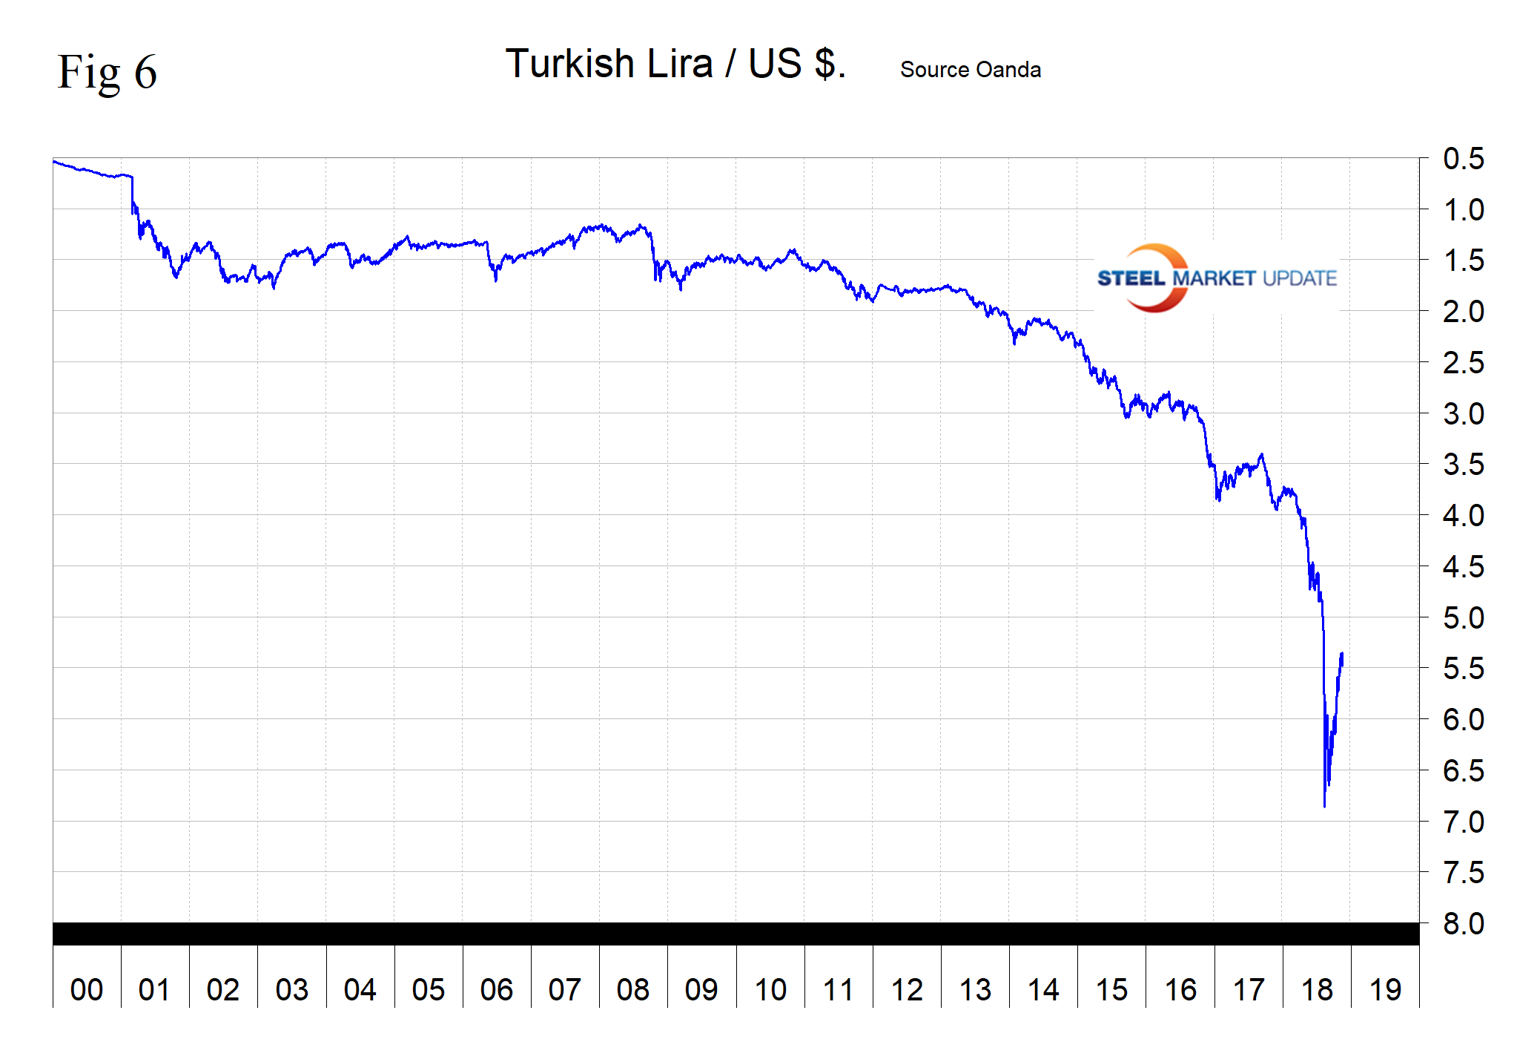
Turkey’s lira has declined by 28.8 percent in the last year (Figure 6). On Oct. 24, Simon Noble, an equities analyst, wrote: “In May, President Erdo?an conducted a Bloomberg interview that triggered the financial crisis when he said, ‘The interest rate is the cause and inflation is the result. The lower the interest rate is, the lower inflation will be.’ The effect of Erdogan’s (reverse logic) remarks to Bloomberg was acerbated by Trump’s tariffs, sanctions and tweets. The lira declined further as fears grew of the real economic impact that the devaluation could have upon externally financed Turkish companies with FX exposure. Worries also surfaced concerning the banking system, which was indirectly exposed to currency risk via corporations with FX loans, who could struggle with debt repayments due to the lira’s devaluation.”
On Sept. 3, the lira bottomed out at 6.6126 lira/U.S. dollar. Since then there has been a rebound to 5.3492 lira/dollar as of Nov. 16.
The Russian Ruble
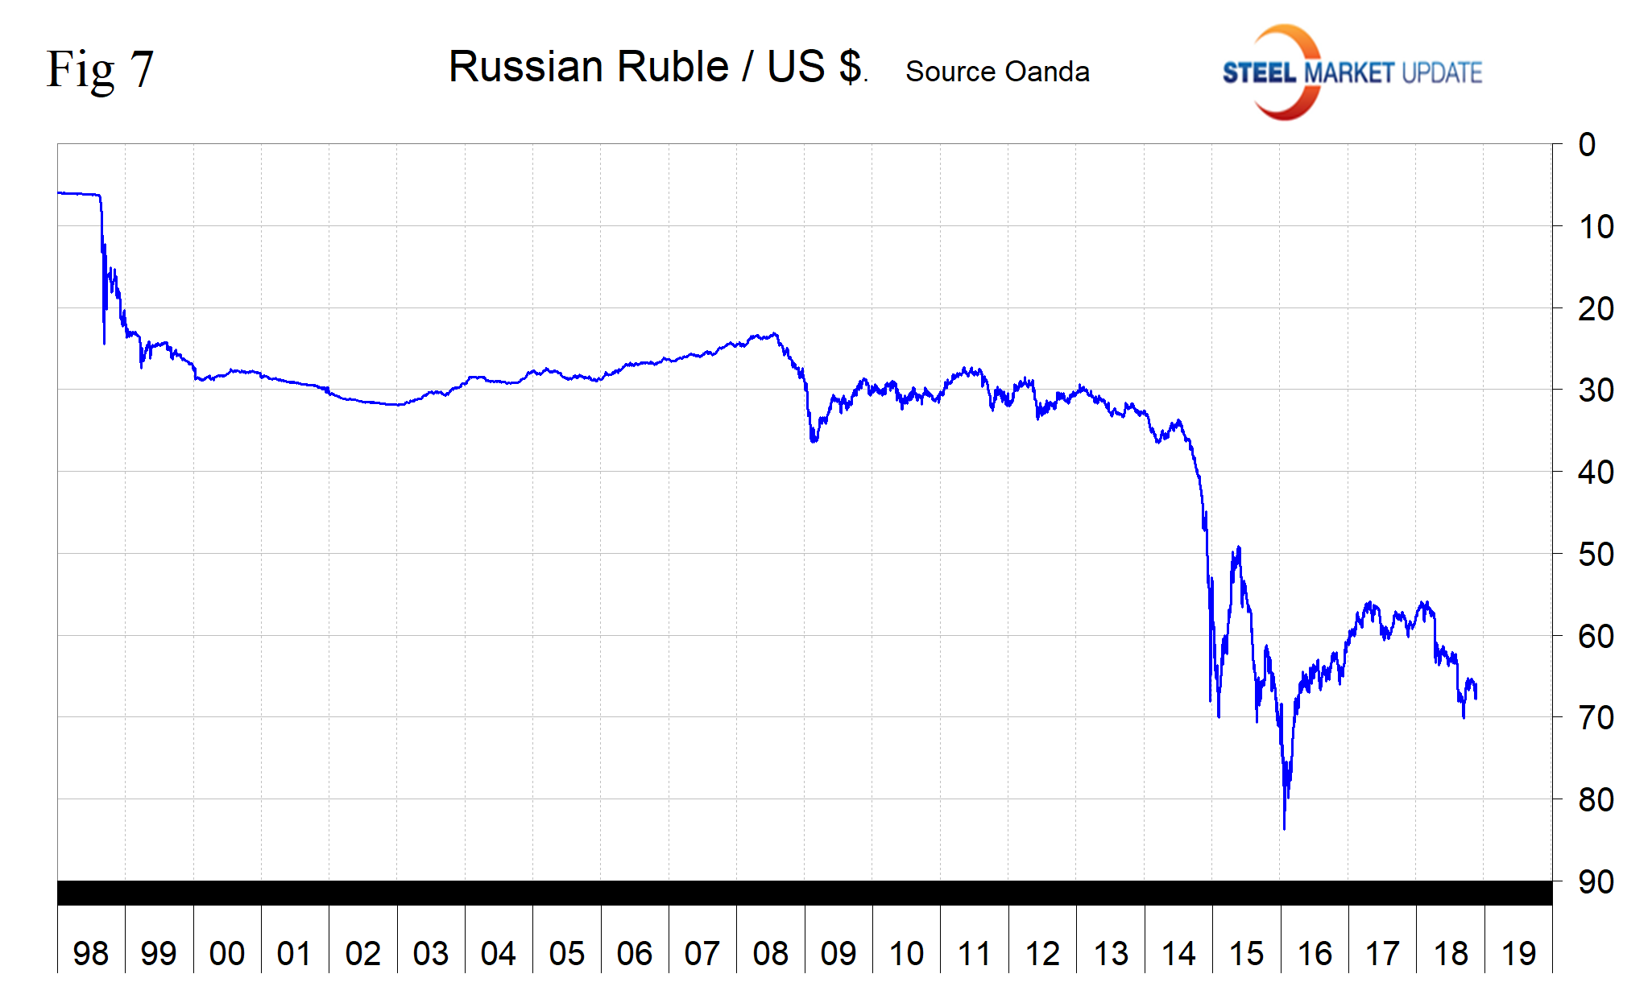
Russia’s ruble has appreciated by 1.5 percent in the last three months, but in the last month gave back 0.8 percent. The ruble has declined by 9.2 percent in the last 12 months (Figure 7).
The Ukrainian Hryvnia
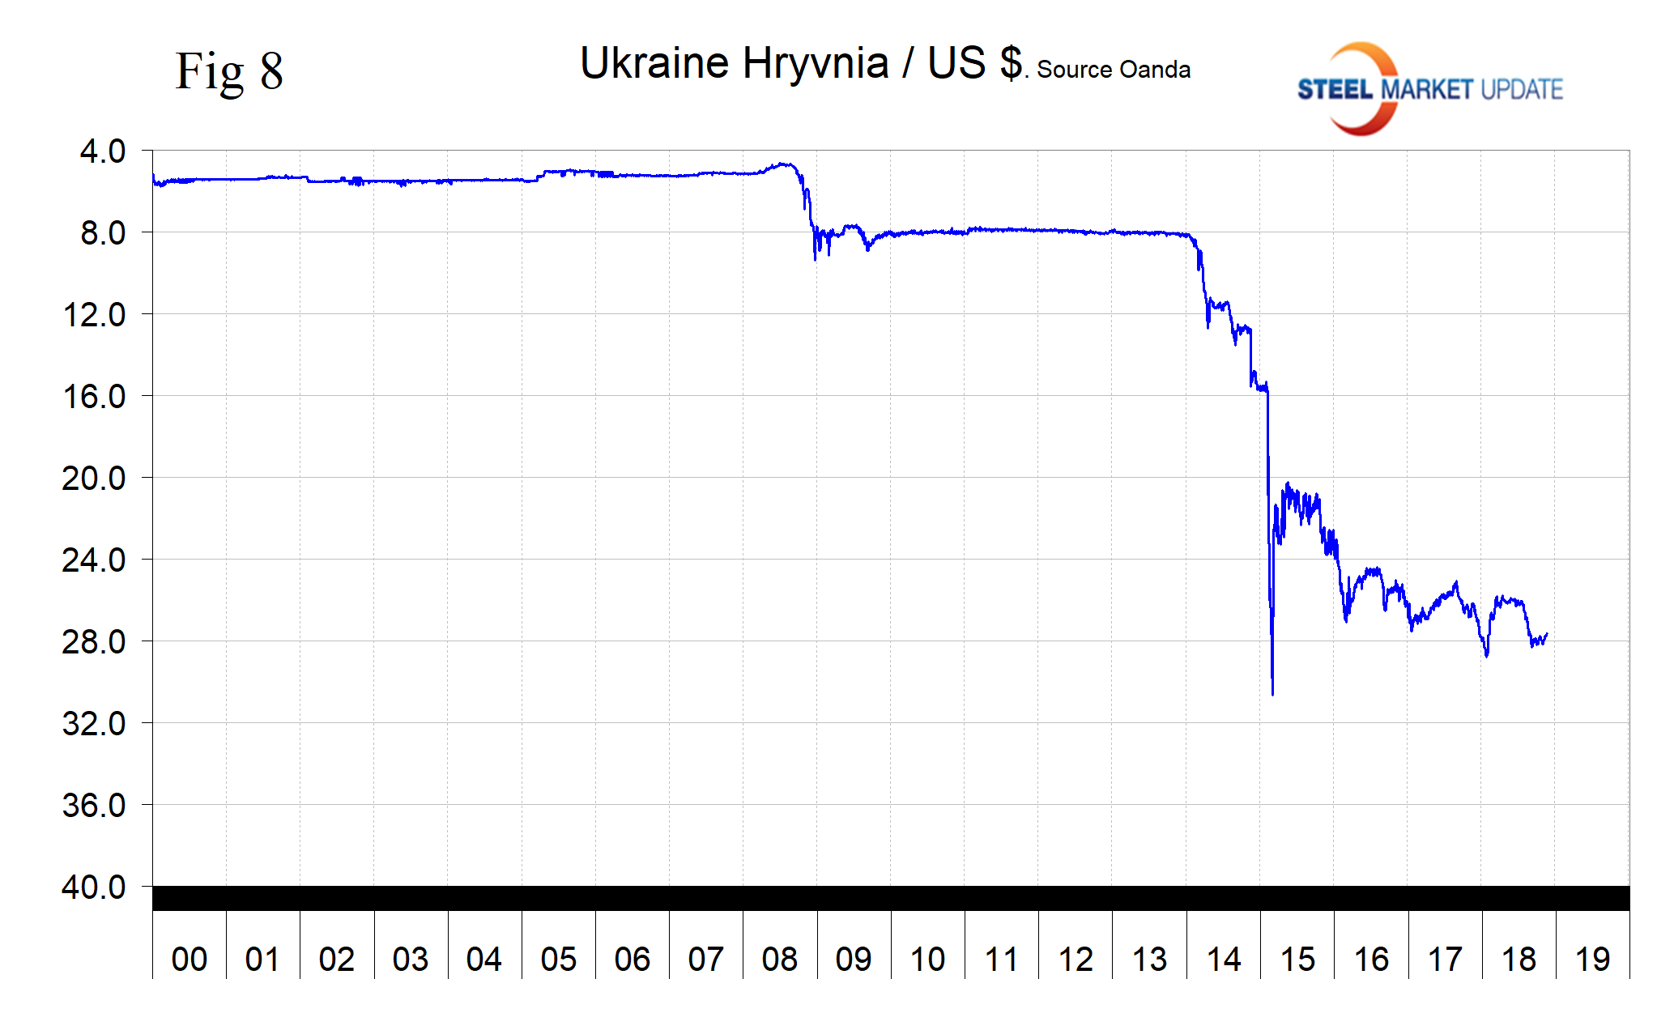
Ukraine’s hryvnia has been on a declining trajectory for three years with no precipitous movements (Figure 8). The hryvnia has strengthened against the dollar by 0.5 percent in the last month.
Explanation of Data Sources: The broad index is published by the Federal Reserve on both a daily and monthly basis. It is a weighted average of the foreign exchange values of the U.S. dollar against the currencies of a large group of major U.S. trading partners. The index weights, which change over time, are derived from U.S. export shares and from U.S. and foreign import shares. The data are noon buying rates in New York for cable transfers payable in the listed currencies. At SMU, we use the historical exchange rates published in the Oanda Forex trading platform to track the currency value of the U.S. dollar against that of 16 steel and iron ore trading nations. Oanda operates within the guidelines of six major regulatory authorities around the world and provides access to over 70 currency pairs. Approximately $4 trillion U.S. dollars are traded every day on foreign exchange markets.


