Market Data

November 14, 2018
Steel Import Market Share Through September
Written by Peter Wright
This report examines the import share of sheet, plate, long and tubular products and 16 subcategories through September.
![]() Table 1 shows total supply to the market in three months through September and in 12 months through September for the four product groups and the 16 subcategories. Supply to the market is the total of domestic mill shipments to domestic locations plus imports. It shows imports on the same three- and 12-month basis and then calculates import market share for the two time periods for 16 products. Finally, it subtracts the 12-month share from the three-month share and color codes the result green or red. If the result of the subtraction is positive, it means that import share is increasing and the code is red. The big picture is that import market share declined in three months compared to 12 months for each of the four product groups and declined for all individual products except HR coil, plate in coil and rebar.
Table 1 shows total supply to the market in three months through September and in 12 months through September for the four product groups and the 16 subcategories. Supply to the market is the total of domestic mill shipments to domestic locations plus imports. It shows imports on the same three- and 12-month basis and then calculates import market share for the two time periods for 16 products. Finally, it subtracts the 12-month share from the three-month share and color codes the result green or red. If the result of the subtraction is positive, it means that import share is increasing and the code is red. The big picture is that import market share declined in three months compared to 12 months for each of the four product groups and declined for all individual products except HR coil, plate in coil and rebar.
There is a huge difference in import market share between products, with tubular goods and coiled plate being by far the worst cases. In the tubular section of Table 1, the import share of structural tubing is blank because source data for domestic production prior to September 2017 made no sense and was not included.
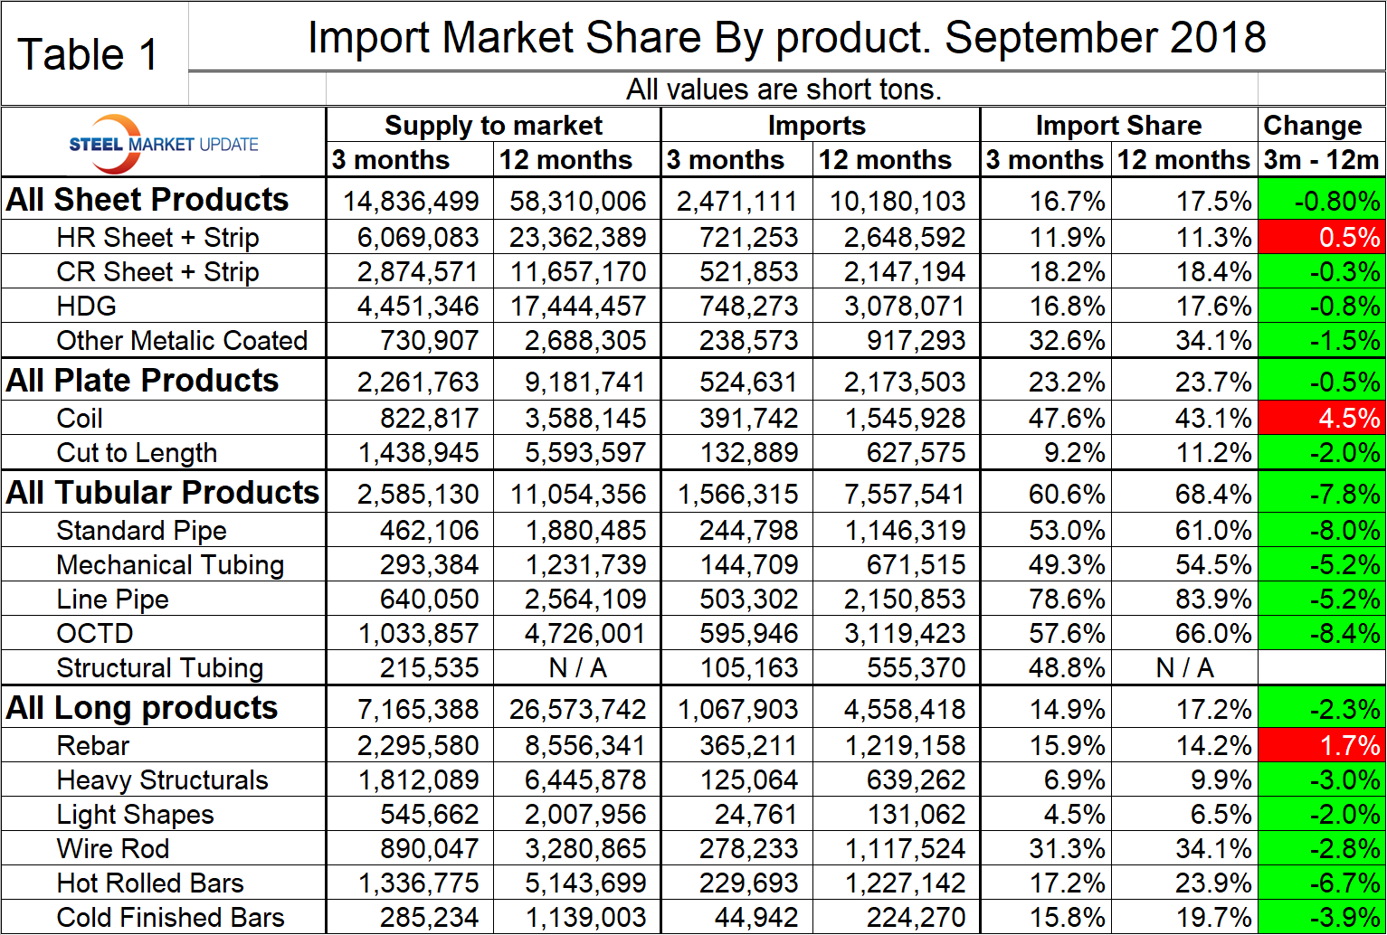
Figure 1 shows the historical import market share of plate and total sheet products. The import share of plate has been decreasing erratically for three years. Excluding the spike of April, the import share of sheet products hasn’t changed much in 10 months.
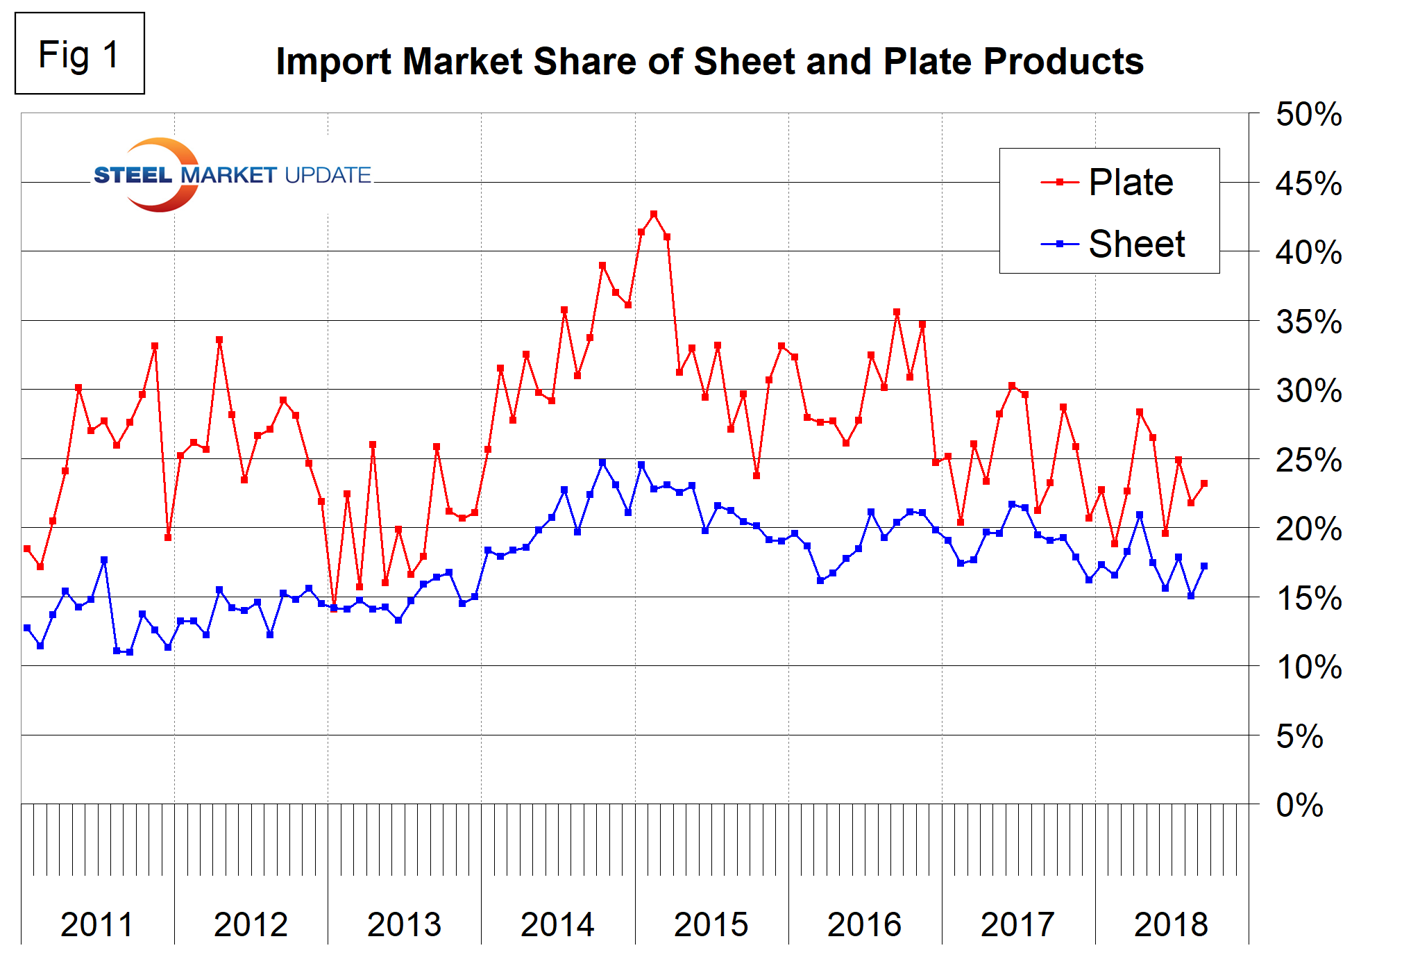
Figure 2 shows the import market share of the four major sheet products. Other metallic coated (mainly Galvalume) has by far the highest import market share and hot rolled has the lowest.
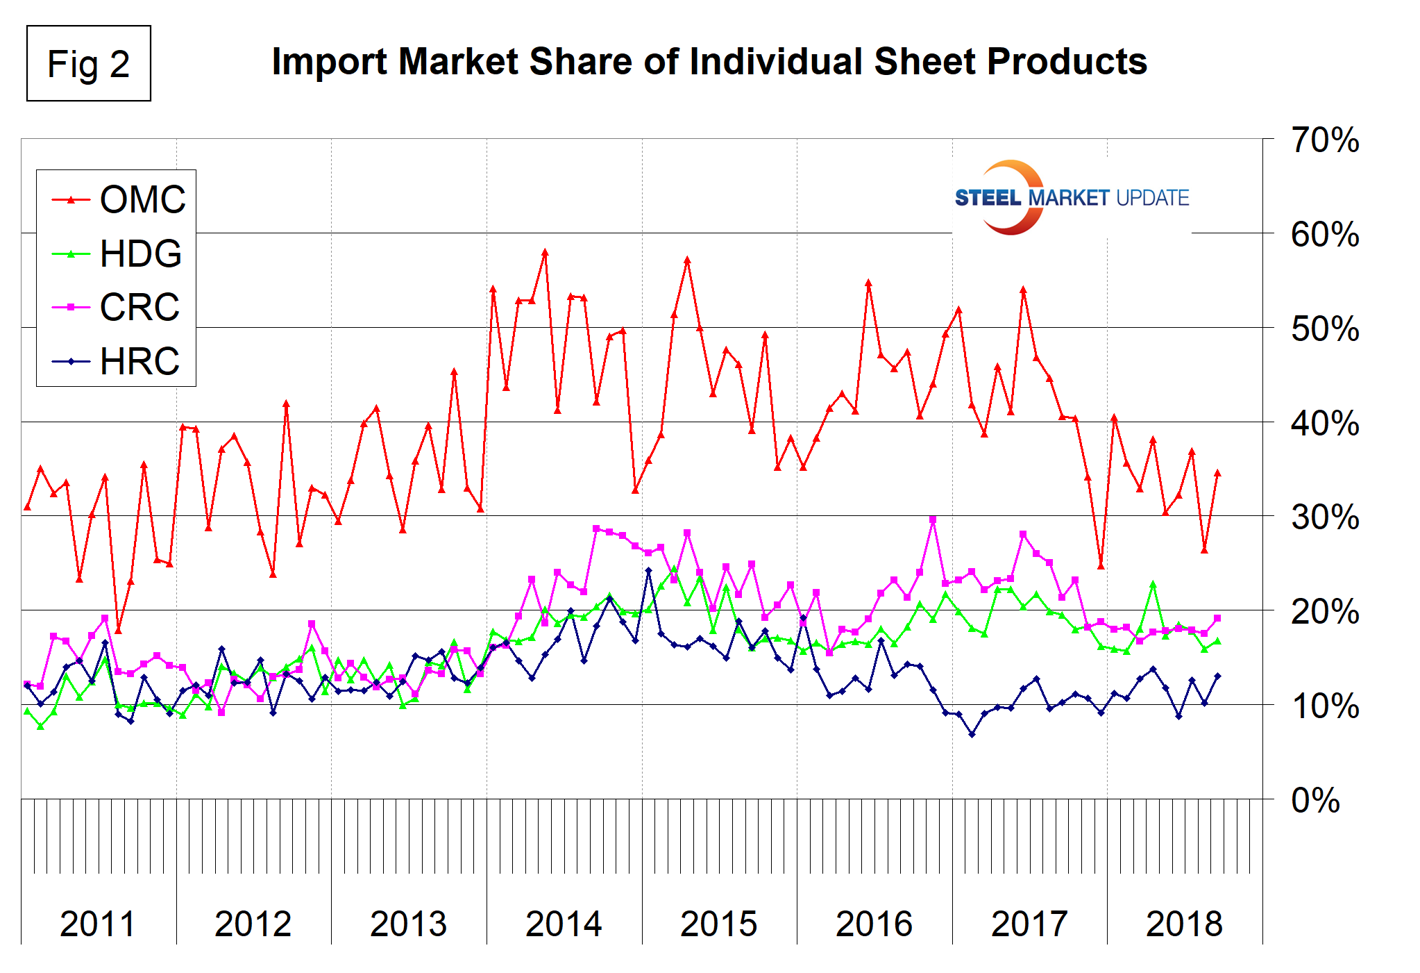
Figure 3 breaks out coiled and CTL plate from the total and shows that coil imports currently have more than four times the market share of CTL imports.
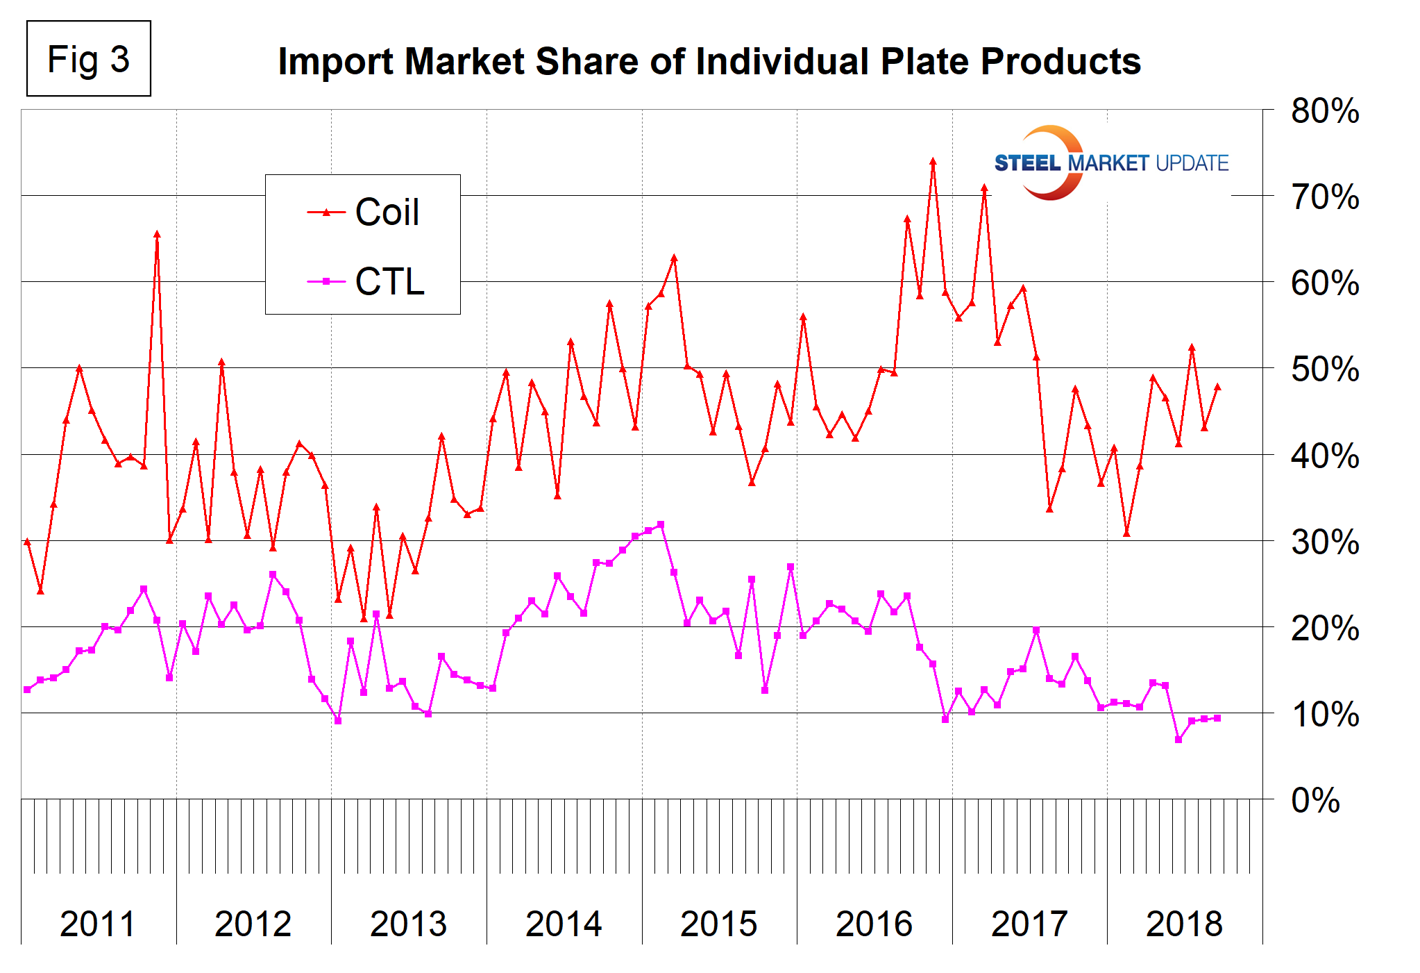
Figure 4 describes the total import share of tubular goods and long products. It is evident that data for the domestic production of tubulars is much less reliable than for other products. Domestic shipments are definitely understated for some products and we suspect for all. This is probably because of a more fragmented supply chain and the independent tubers not reporting to the extent that the steel mills do for other products. This has the result of increasing the apparent import market share.
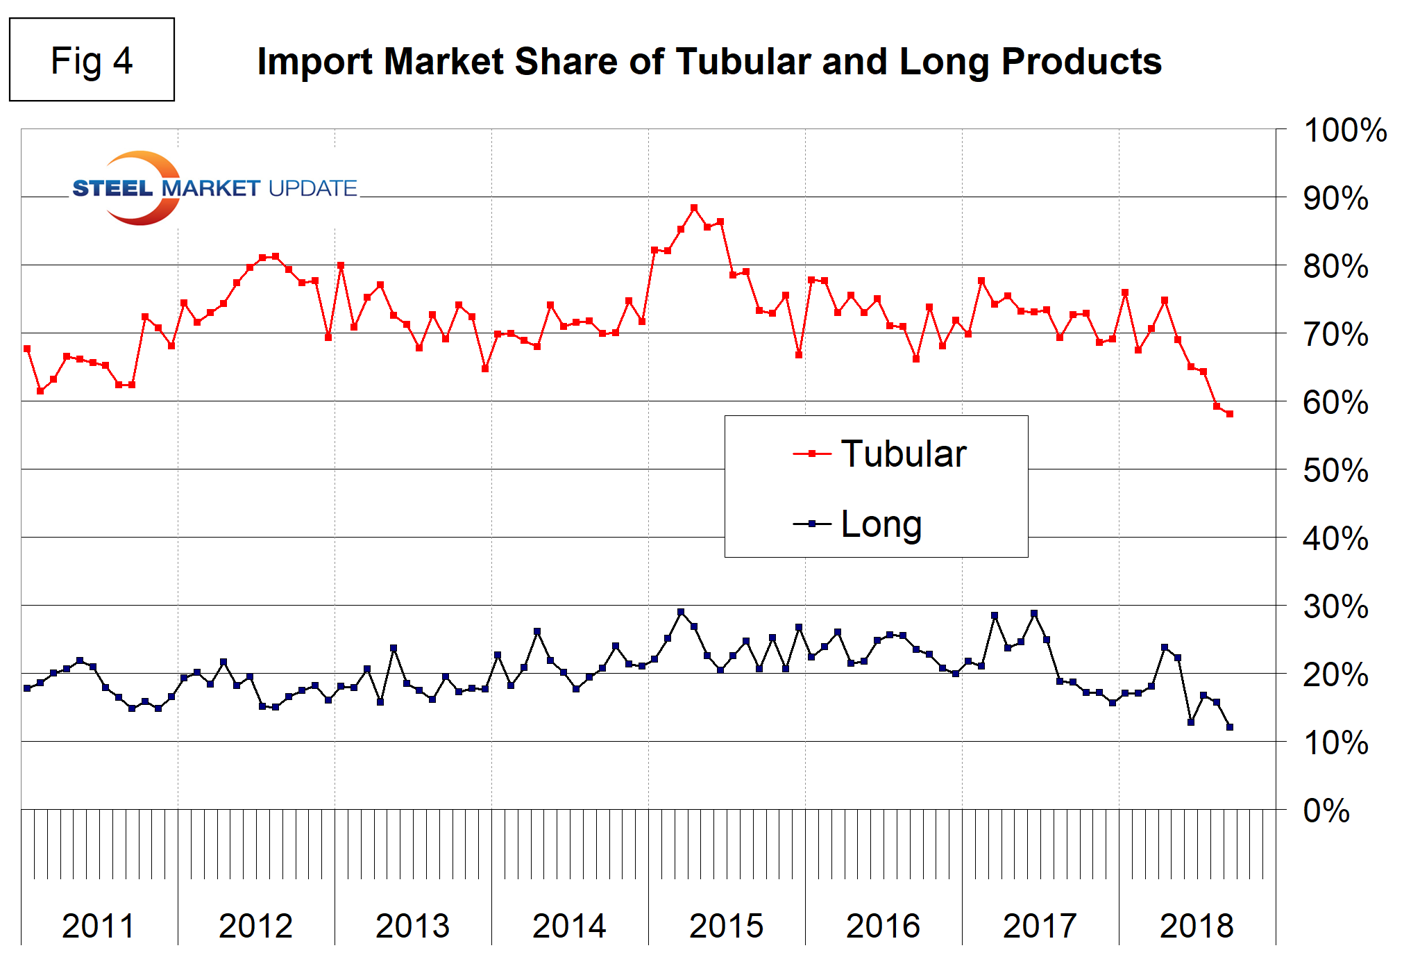
Figure 5 shows the import market share of the individual tubular products. Based on the available information, all are very high compared to other steel product groups, and line pipe is the highest.
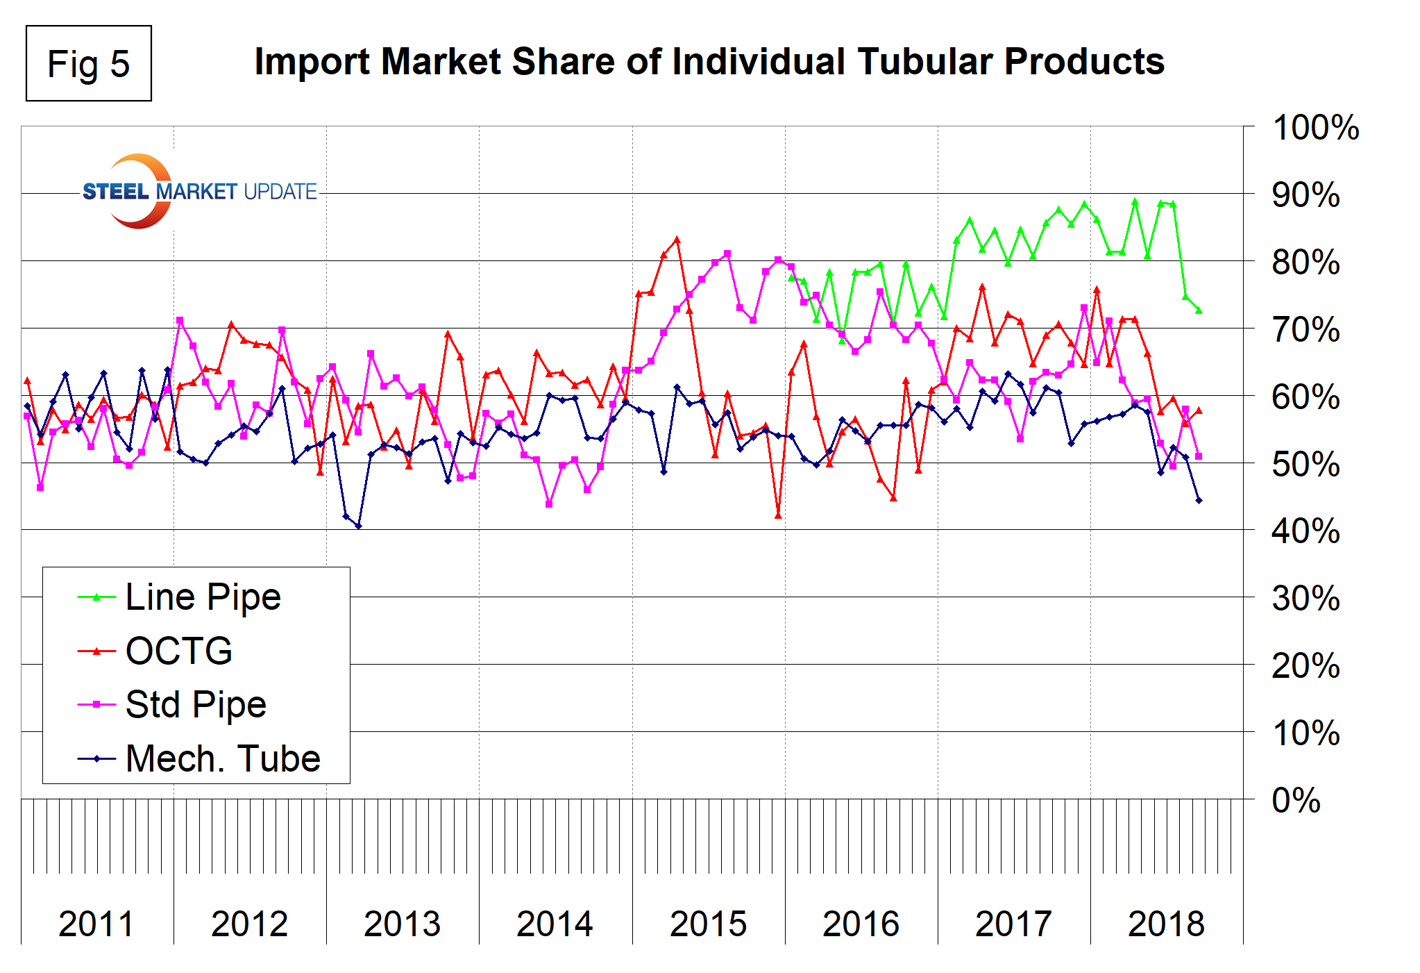
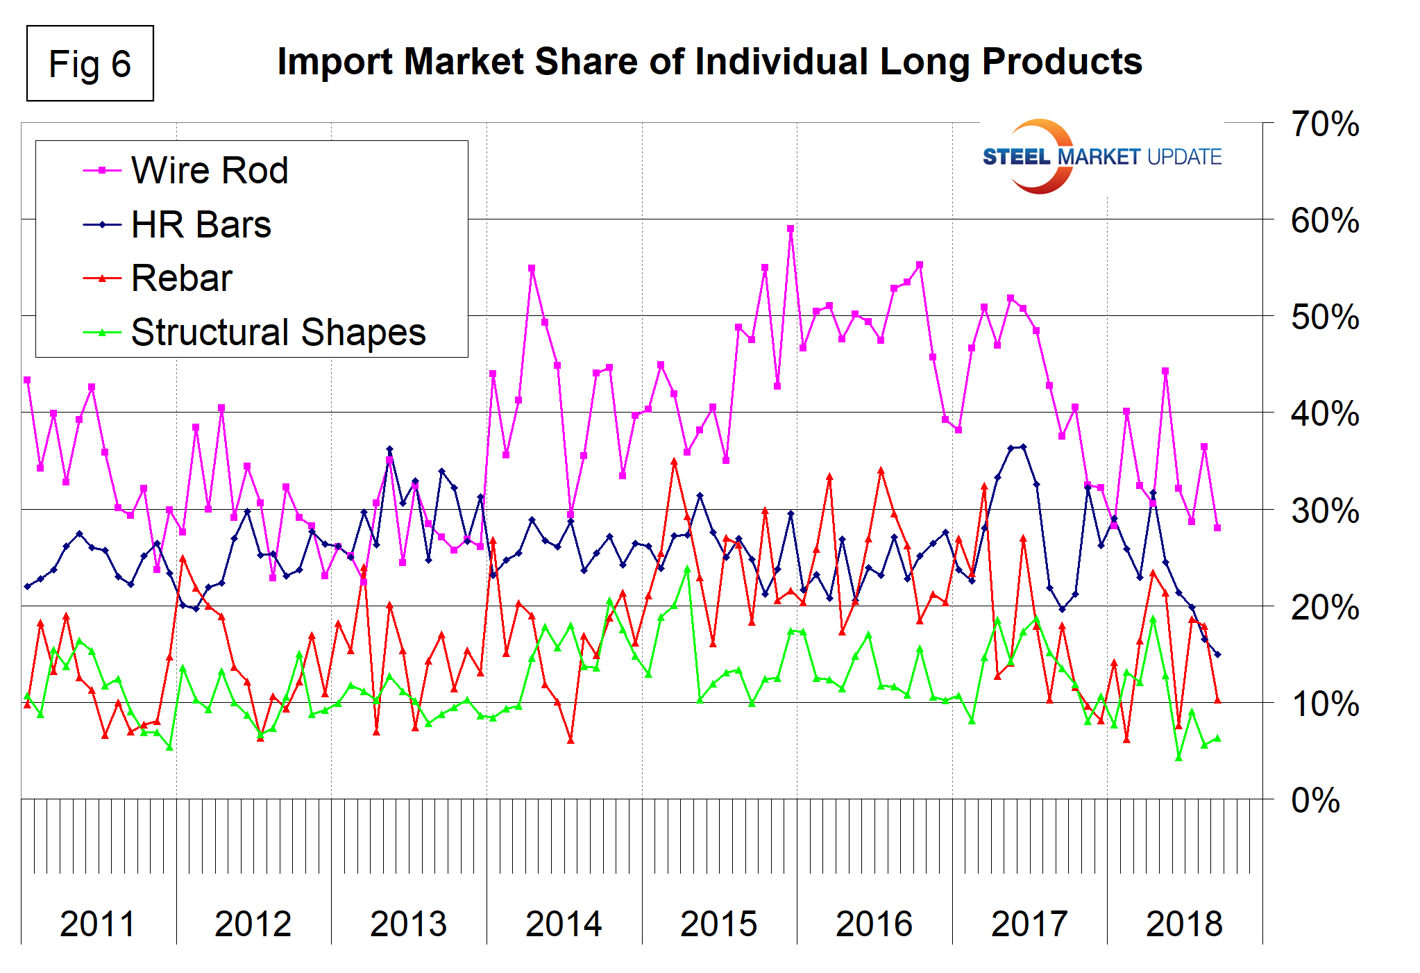
Figure 6 shows the detail for the four major sectors of the long products group. The import share of longs—with the exception of the April-May spike—has been declining for over a year. Wire rod historically has had by far the highest import share, and to make matters worse the imports of drawn wire are also very high. The highest volume item of Chinese steel imports to the U.S. is currently value-added drawn wire.