Prices

November 1, 2018
HRC Futures: Near-Term HR Futures in Holding Pattern
Written by Jack Marshall
The following article on the hot rolled coil (HRC) steel and financial futures markets was written by Jack Marshall of Crunch Risk LLC. Here is how Jack saw trading over the past week:
Steel
HR futures have been subdued the last week or so. With spot HR and the Oct’19 settle both pegged at $831/ST, the market sentiment may be beginning to shift, at least in the near date futures. However, the story is a bit more nuanced for Cal’19. The Cal’19 value is hovering around $780-$785/ST. Forward buyers with $30-$40 HR index discount deals could look at locking in Cal’19 HR at $745-$755/ST all in ($785 Cal’19 offers minus the $30-$40 discount). The current backwardation in HR for front month vs. 12 months out stands at about a $75 discount. (Roughly $825 vs. $750/ST). Q1’19 HR reflects a $20 backwardation Jan’19 vs. Mar’19 and Q2’19 HR reflects a $15/ST backwardation Apr’19 to Jun’19. Today, volumes have picked up as Dec’18 through Mar’19 traded about 10,000 to 11,000 ST. Also of note, Q1’19 traded at $804/ST today.
While volumes have been a bit lower the last week, October HR trading volumes still managed just shy of 200,000 ST traded. Open Interest also has been increasing last at 18,075 contracts or 361,500 ST.
Below is a graph showing the history of the CME Group hot rolled futures forward curve. You will need to view the graph on our website to use its interactive features; you can do so by clicking here. If you need assistance with either logging in or navigating the website, please contact Brett at 706-216-2140 or Brett@SteelMarketUpdate.com.

Scrap
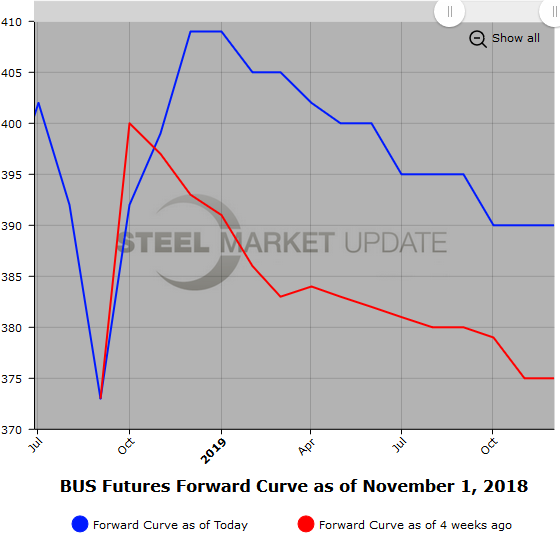
Early market chatter expectations have BUS prices rising by $15/GT for Nov’19—pretty much in line with near date futures bid levels. Last Nov’18 BUS 400/408, 500 tpm. Dec’18-Jan’19 bid levels have been $4-$6/GT higher with low volumes trading. The BUS futures curve has a slight backwardation out into Q3’19. Dec’18-Sep’19 BUS has been offered at $400/GT.
Near date USSQ futures have been hovering in the low to mid $340/GT level. Nov-Mar’19 USSQ has been $338/GT bid. Today earlier Nov’18 USSQ was offer at $348/GT. Expectations for Nov’19 USSQ are up $20/GT. (Oct’19 $331/GT).
Below is another graph showing the history of the CME Group busheling scrap futures forward curve. You will need to view the graph on our website to use its interactive features; you can do so by clicking here.
We have started tracking USSQ shredded scrap futures, shown below. Once we have built a sizable database, we will add this data to our website.