

Market Data

October 29, 2018
BLS: Pacific Region Leads in Job Creation
Written by Peter Wright
In third-quarter 2018, the Pacific region regained the lead as the engine of national job creation. Third-quarter employment data by state was released by the Bureau of Labor Statistics (BLS) on Friday. The state data follows the national figures that were published on Oct. 5 and confirm the strength of the labor market.
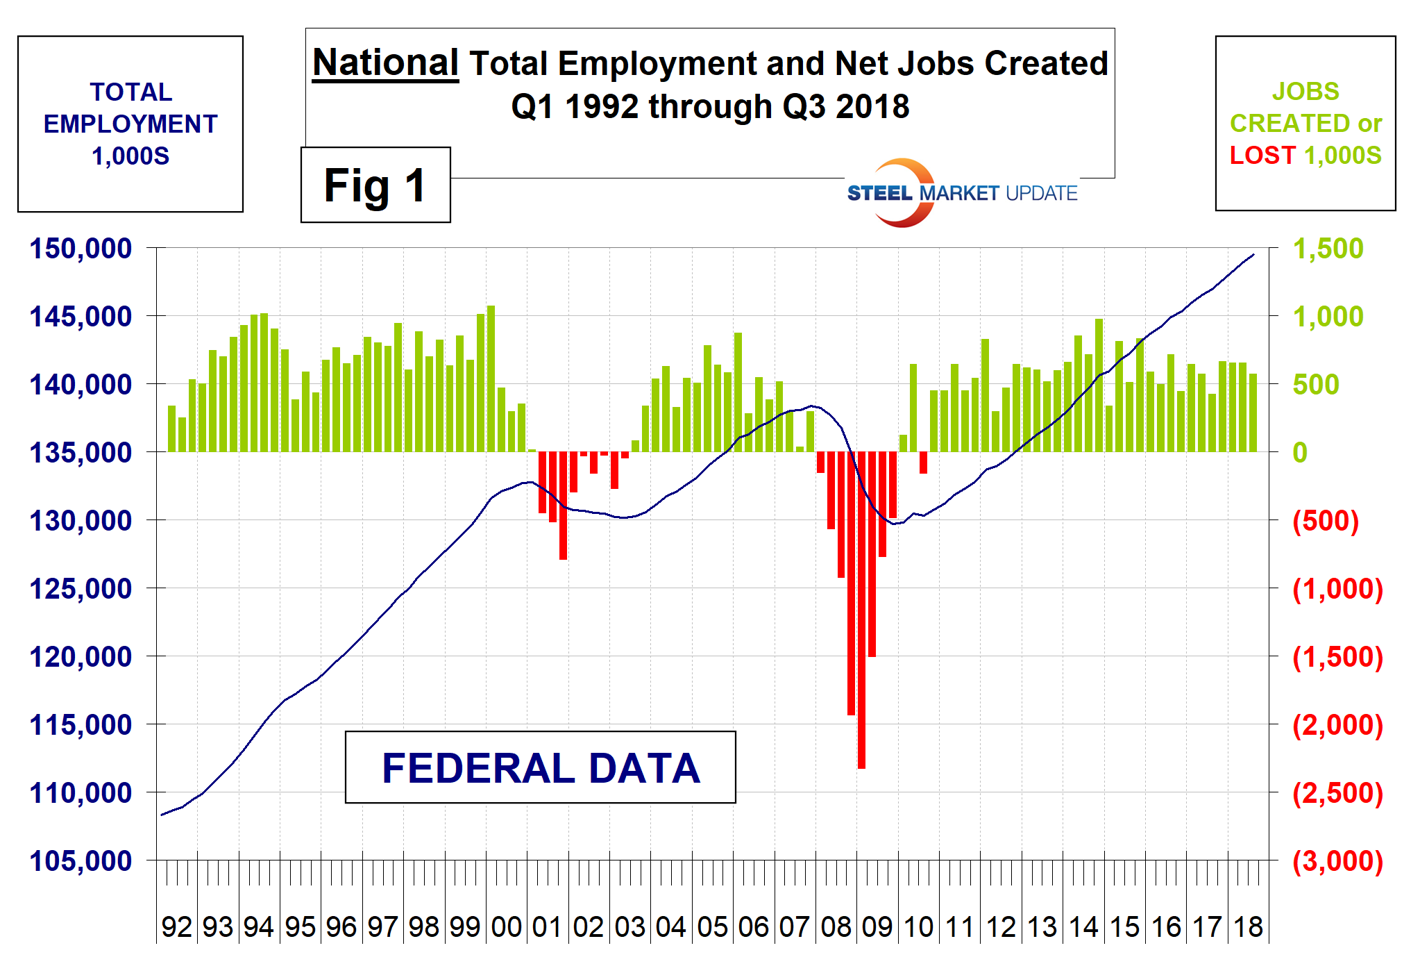
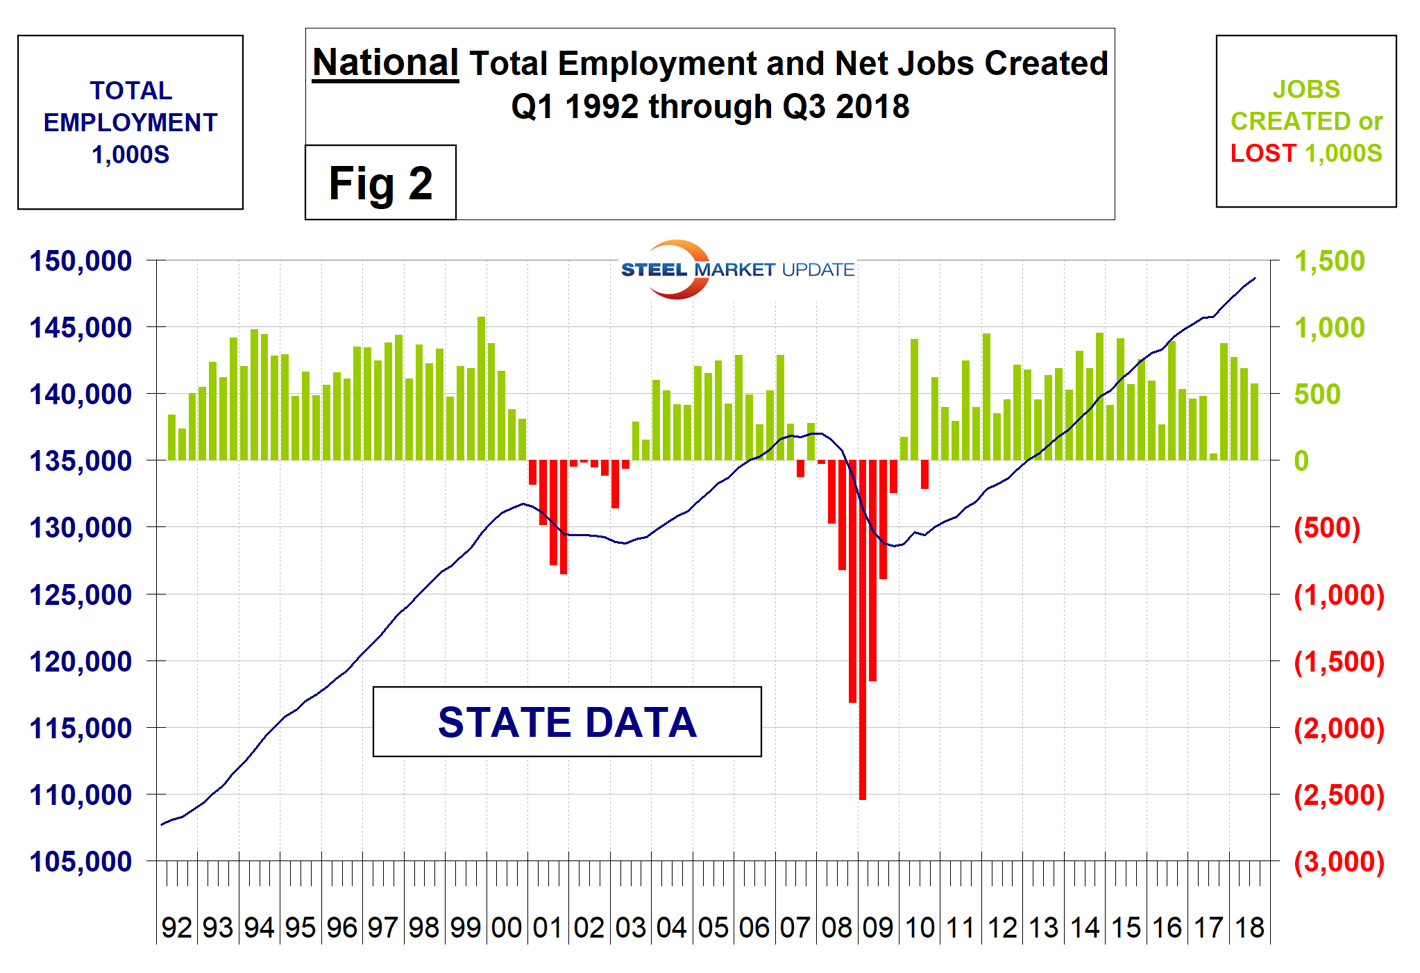
The states compile their employment numbers independently of the feds, and then both are reported by the BLS. In the 23 quarters since and including Q1 2013, the feds reported total job creation of 14,436,000 and the states reported 14,286,000, a difference of just 1.1 percent. Our report covers only the lower 48 states, and the state numbers don’t include those such as the military that are employed overseas. Therefore, the fed and state totals are impressively close. Figure 1 shows the history of federal data totals since 1992 and Figure 2 shows the same format for the state data.
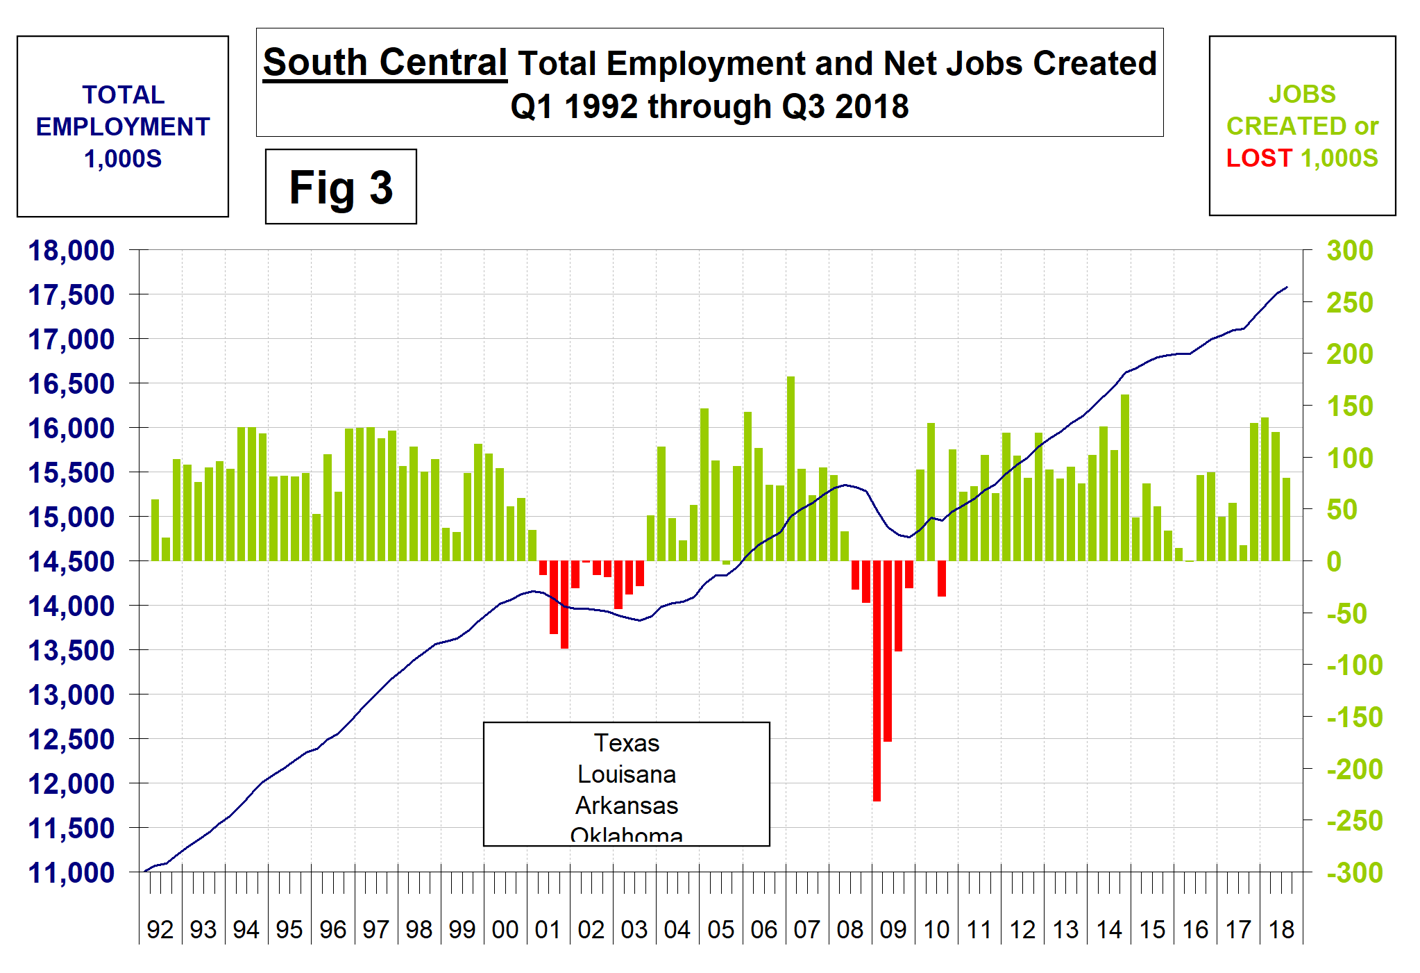
SMU has graphs in the same format for 10 geographic regions and can produce them for individual states on request. Figure 3 shows the history of the South Central region.
The 10 geographic regions described in this report are:
New England (CT, ME, MA, NH, RI, VT)
North East (NY, PA, NJ)
Mid Atlantic (DE, DC, MD, NC, SC, VA, WV)
North Central (IA, KS, MN, MO, NE, ND, SD)
East North Central (IL, IN, MI, OH, WI)
East South Central (AL, KY, MS, TN)
South Central (TX, OK, LA, AR)
Mountain (AZ, CO, ID, MT, NV, NM, UT, WY)
Pacific region (CA, OR, WA)
South East (FL, GA)
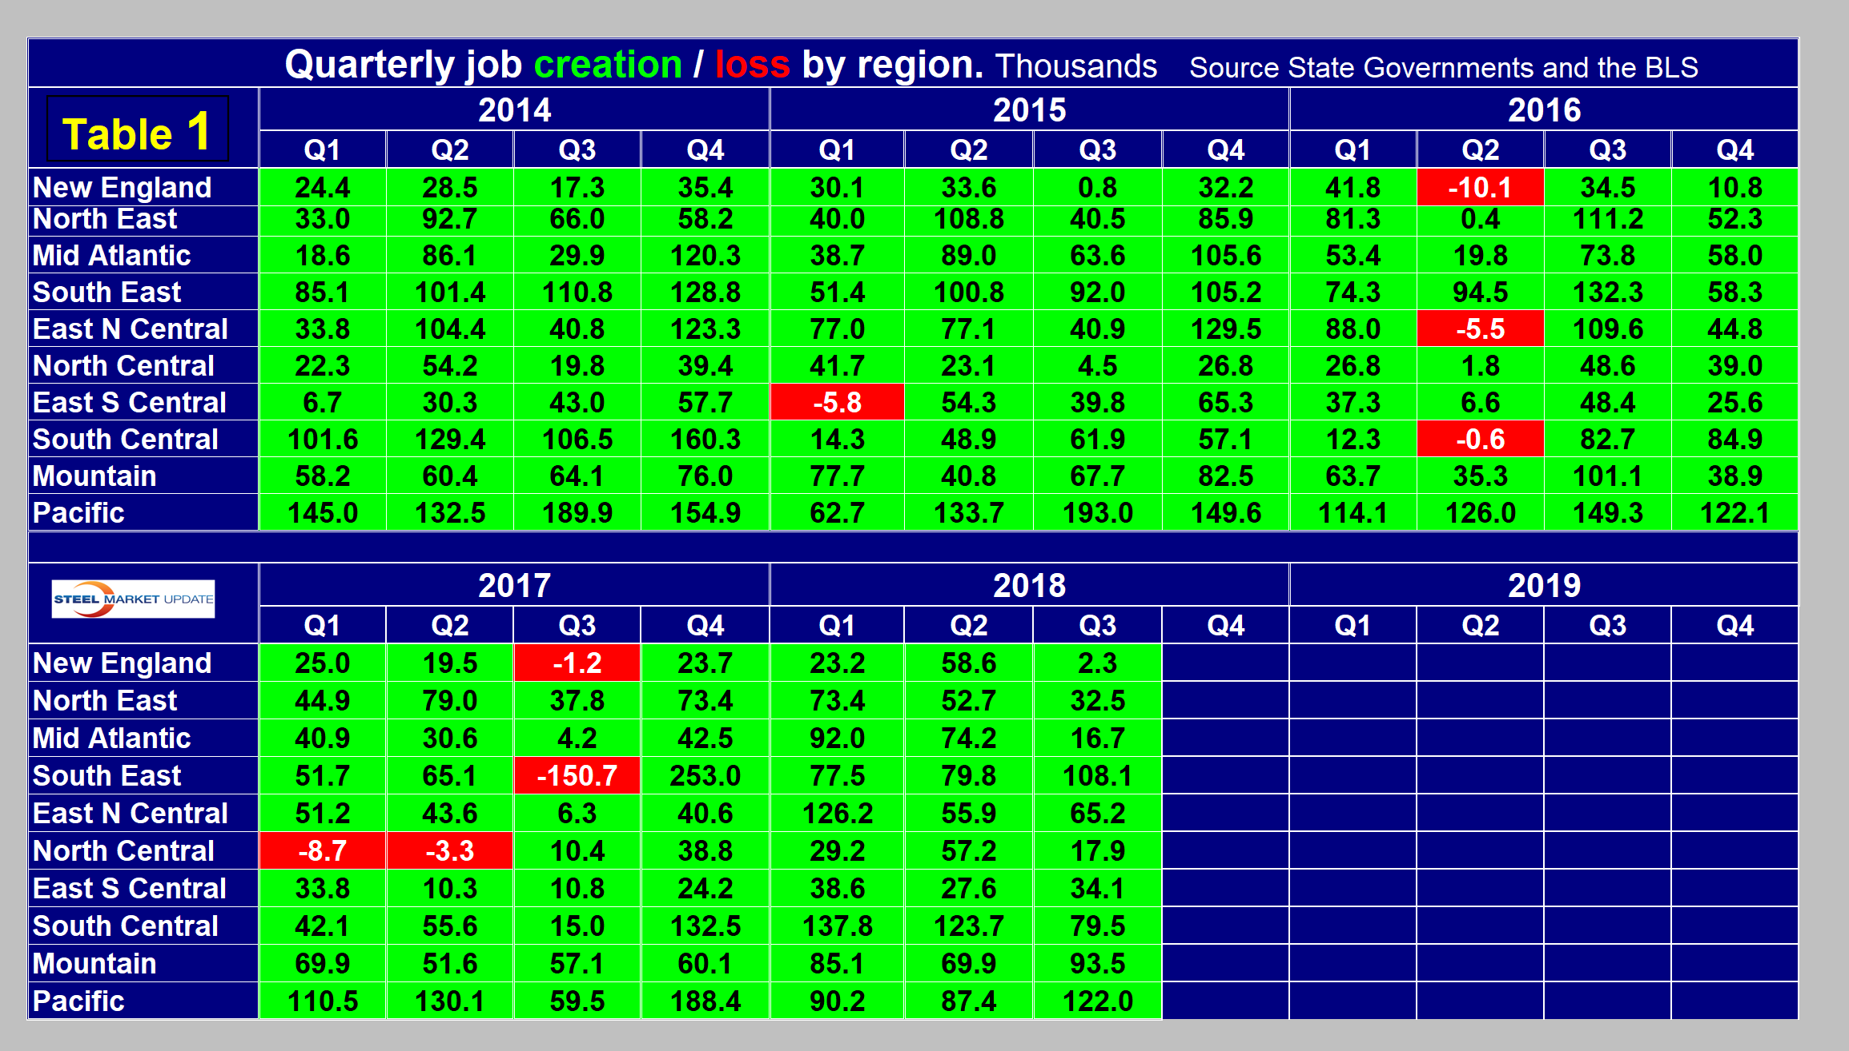
Table 1 shows the history of quarterly job creation by region since Q1 2014. In Q4 2017, the Pacific region created the most jobs. The South Central, led by Texas, took the lead in Q1 and Q2 2018 and the Pacific regained the top spot in Q3 2018. The numbers are seasonally adjusted and all regions had a positive net gain in the last four quarters.
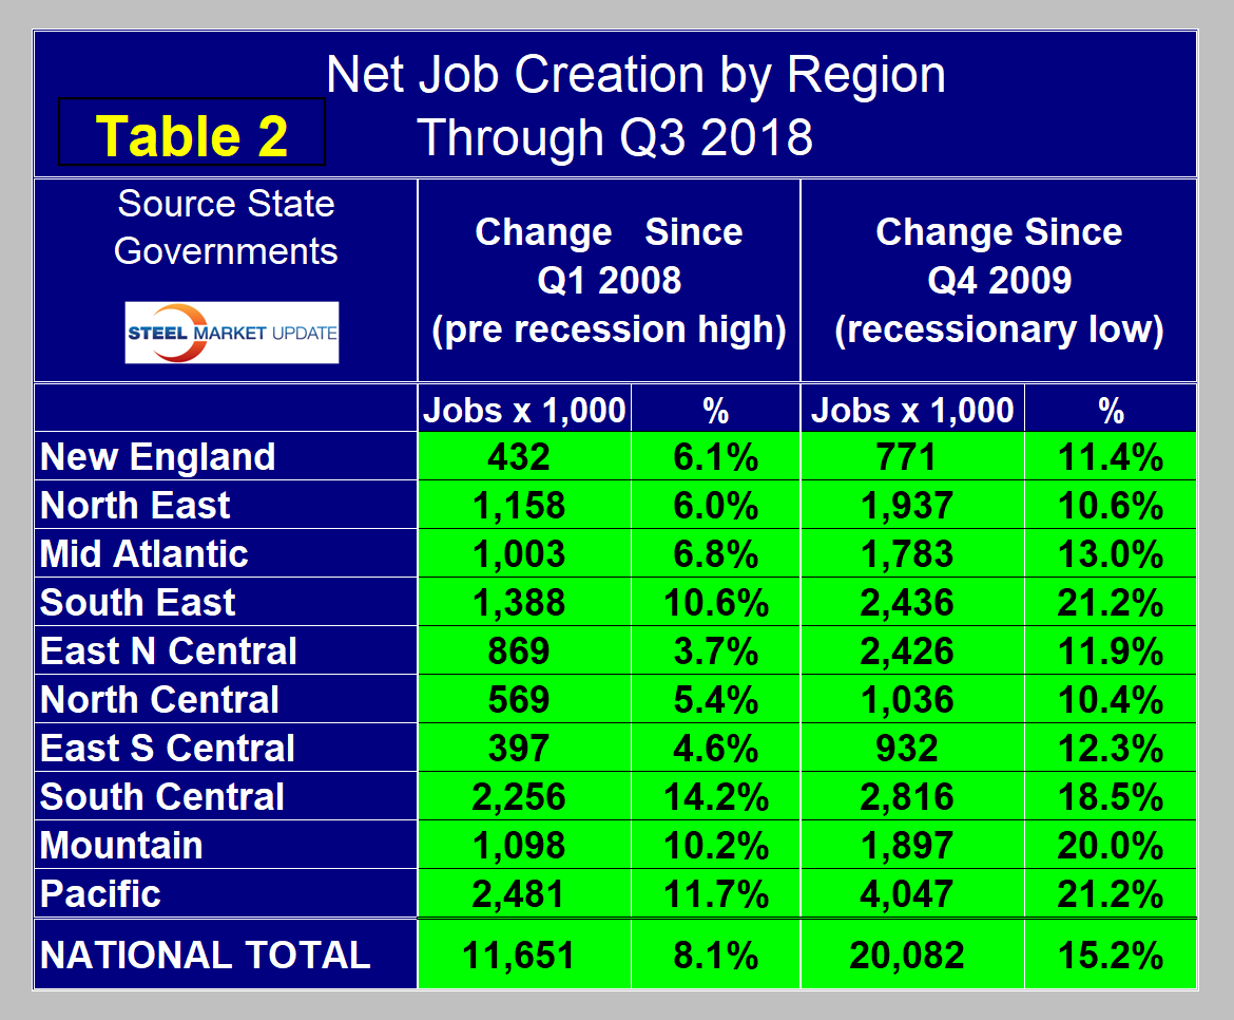
The regions have fared very differently since the pre-recession high of first-quarter 2008 and since the low point of fourth-quarter 2009. By the states’ calculations, there are now 11,651,000 more people employed than there were immediately before the recession, but of that number 40.7 percent were created in the South Central and Pacific regions (Table 2).
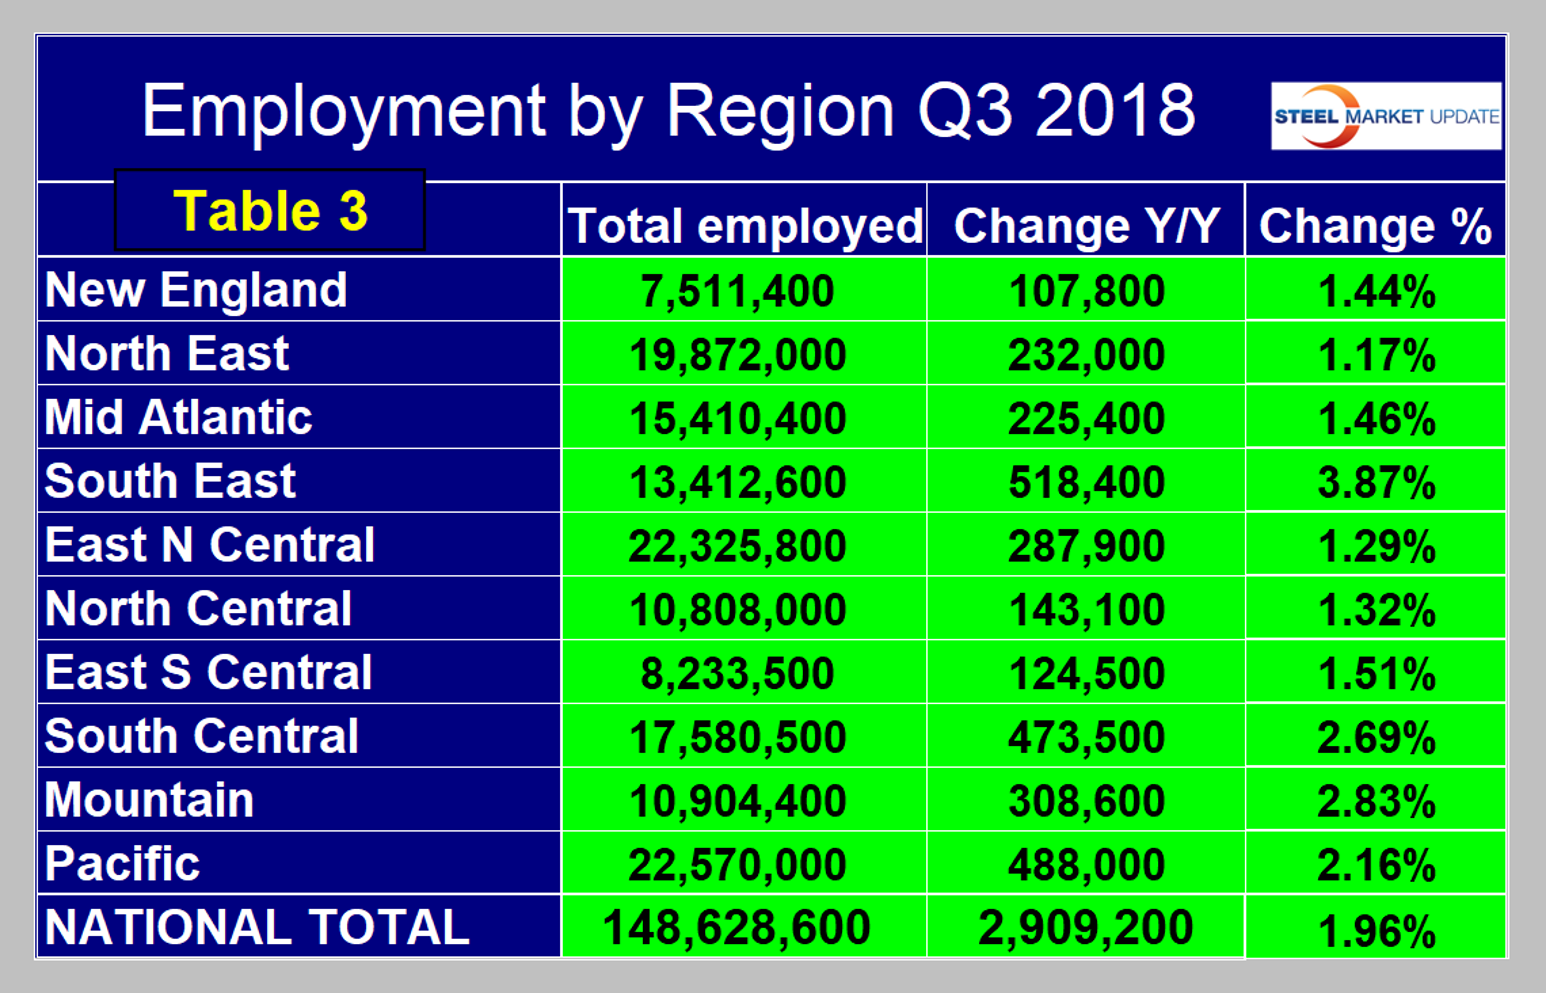
The third quarter of 2015 was the first time that every region had more people employed than it did at the pre-recession peak. The rate of job creation still varies widely across the country. In the last four quarters, the South East has had the highest rate of job growth at 3.87 percent. This was an anomaly and resulted from the huge hurricane-related job losses in September 2017. In reality, the Mountain region continues to have the best performance on a percentage basis (Table 3).
SMU Comment: We believe it’s important for those subscribers whose businesses are substantially regional to have as much data as possible to compare their own results with those of their locality. This report, along with our quarterly reports on regional GDP and regional imports, are intended to help in that respect.


